Feature Guide
1. Event
Events are the smallest data units in the Alert Center, representing raw alerts or status change notifications received from external systems. The platform converts heterogeneous data into a unified event model through standardized processing, laying the foundation for subsequent aggregation, dispatch, and recovery judgment.
1.1 Core Positioning
The Event layer addresses "how data enters the platform" and "how it associates with recovery." It serves as both the unified entry point for multi-source onboarding and the data source for full alert lifecycle tracing.
1.2 Core Capabilities
- Multi-Source Onboarding Adaptation: Supports multiple onboarding methods including REST API and NATS messaging channels, connecting to heterogeneous data sources like Prometheus, Zabbix, cloud monitoring, and Webhooks through the Adapter pattern
- Field Standardization Mapping: Maps fields from different sources to the standard event model through
event_fields_mappingconfiguration, with fallback value retrieval fromlabelsmetadata - CMDB Information Enrichment: Optionally enable CMDB auto-enrichment capability that queries and supplements instance information into event labels based on
resource_typeandresource_id/resource_name - Recovery Event Association: Achieves intelligent association between recovery events and creation events through
external_idunique identification, supporting auto-recovery judgment - Pre-Filtering Shield: Events are immediately checked against shield policies after storage; events matching policies are marked as Shielded (SHIELD) status and do not enter the subsequent alert pipeline
Interface Guide:
- Chart Interpretation / Configuration Logic: The event list is used for tracing raw data, investigating "why this alert was generated" or "why the alert hasn't recovered." Focus on event status (whether shielded), action type (created/recovery/closed), and parsed field values.
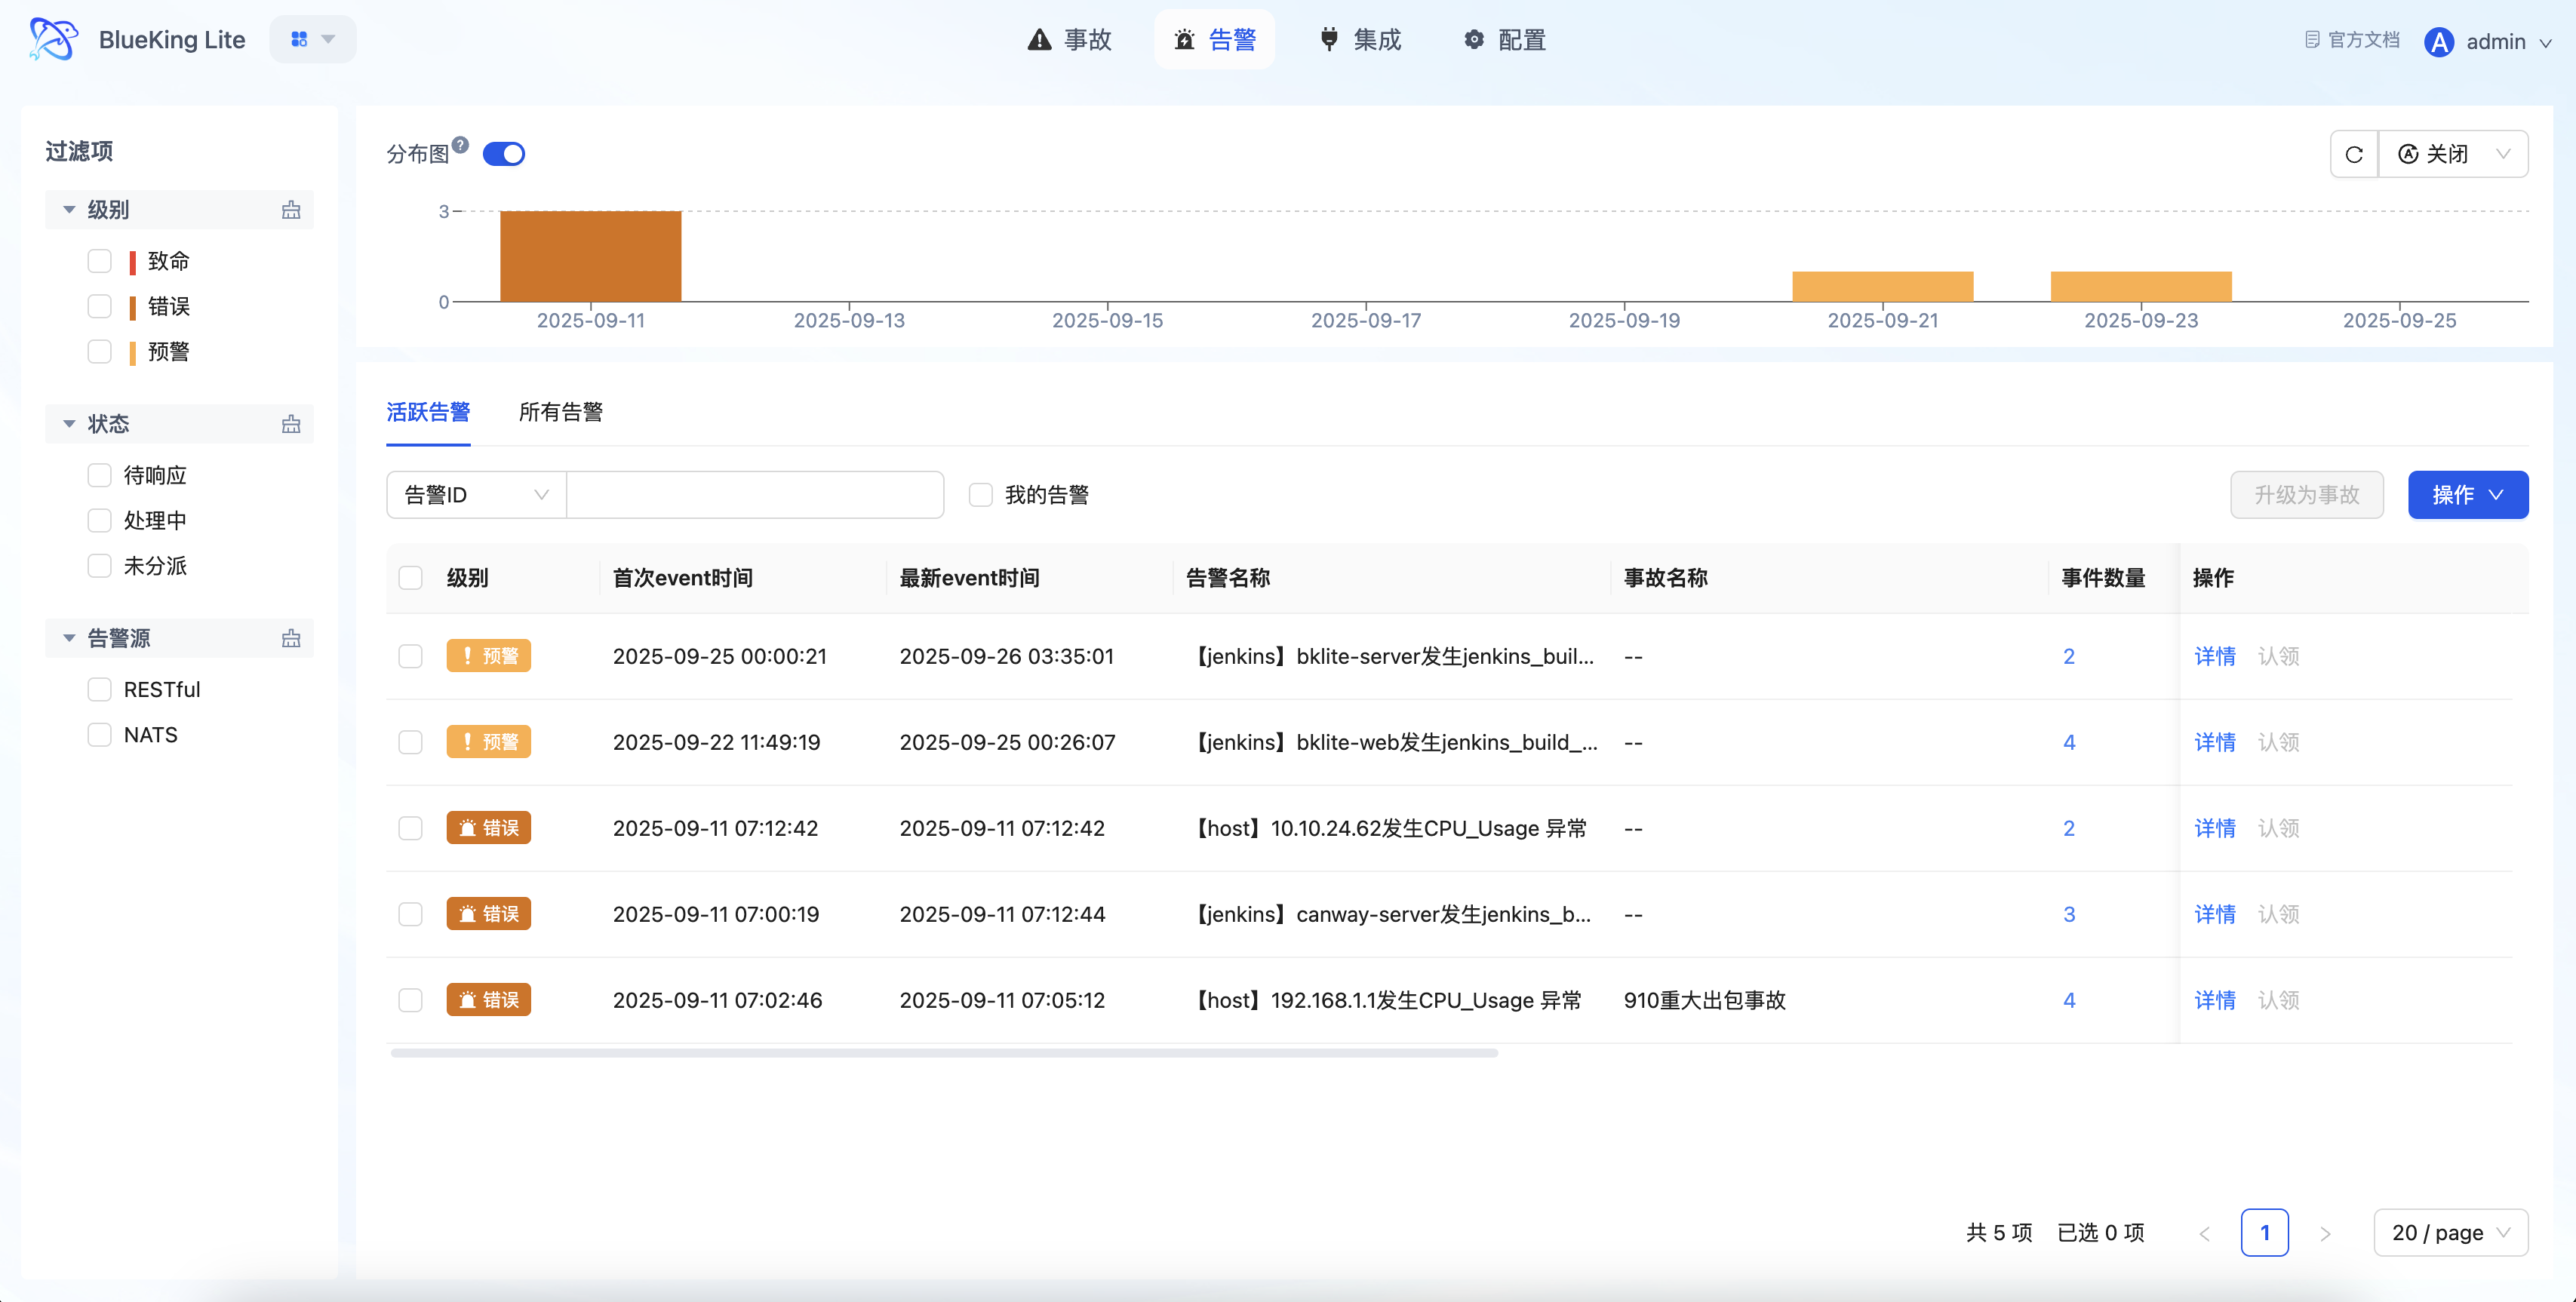
2. Alert
Alerts are processable units formed after raw Events are aggregated through correlation rules. Compared to individual events, alerts emphasize responsibility attribution, context completeness, and handling actions, serving as the core entry point for on-call personnel's daily work.
2.1 Core Positioning
Alerts are designed to accept problem units that need to be handled by manual or automated processes. They preserve original event context information (through many-to-many associations) while providing a unified state transition mechanism, helping teams escalate from "seeing an anomaly" to "starting to handle the problem."
2.2 State Machine Model
Alerts follow a strict state machine definition; illegal state transitions are rejected:
| Status | Description | Entry Method |
|---|---|---|
| unassigned | Unassigned | Initial status after alert creation |
| pending | Pending Response | After auto-dispatch or manual dispatch |
| processing | In Progress | After responsible person claims |
| resolved | Resolved | Manual recovery operation |
| closed | Closed | Manual close operation |
| auto_recovery | Auto-Recovered | Automatically triggered when recovery event covers creation event |
| auto_close | Auto-Closed | Policy close conditions met or fallback task triggered |
2.3 Core Capabilities
- Intelligent Fingerprint Aggregation: Precise deduplication based on
event fingerprint; active alerts with the same fingerprint are only updated, not duplicated - Multi-Dimensional Filtering and Sorting: Supports filtering by alert level, status, source, time range, "My Alerts" and other dimensions; list sorted by update time descending
- Associated Event Tracing: Each alert can view all its associated events to understand the aggregation process and context changes
- Batch Handling Operations: Supports batch dispatch, claim, and close for improved high-frequency operation efficiency
- Auto-Recovery Determination: When an alert's associated creation events are covered by later recovery events, automatically triggers
auto_recoverystate transition - Notification Status Tracking: Records each notification's delivery result (success/failure/partial success) for troubleshooting notification pipeline issues
- One-Click Upgrade to Incident: High-impact alerts can be upgraded to Incidents with one click, entering a higher-level collaborative workflow
Interface Guide:
- Chart Interpretation / Configuration Logic: The alert list emphasizes "quick filtering + in-place handling." After compressing the problem set through "Level, Status, Ownership," you can directly execute claim, transfer, or close operations in the list, reducing page switching.
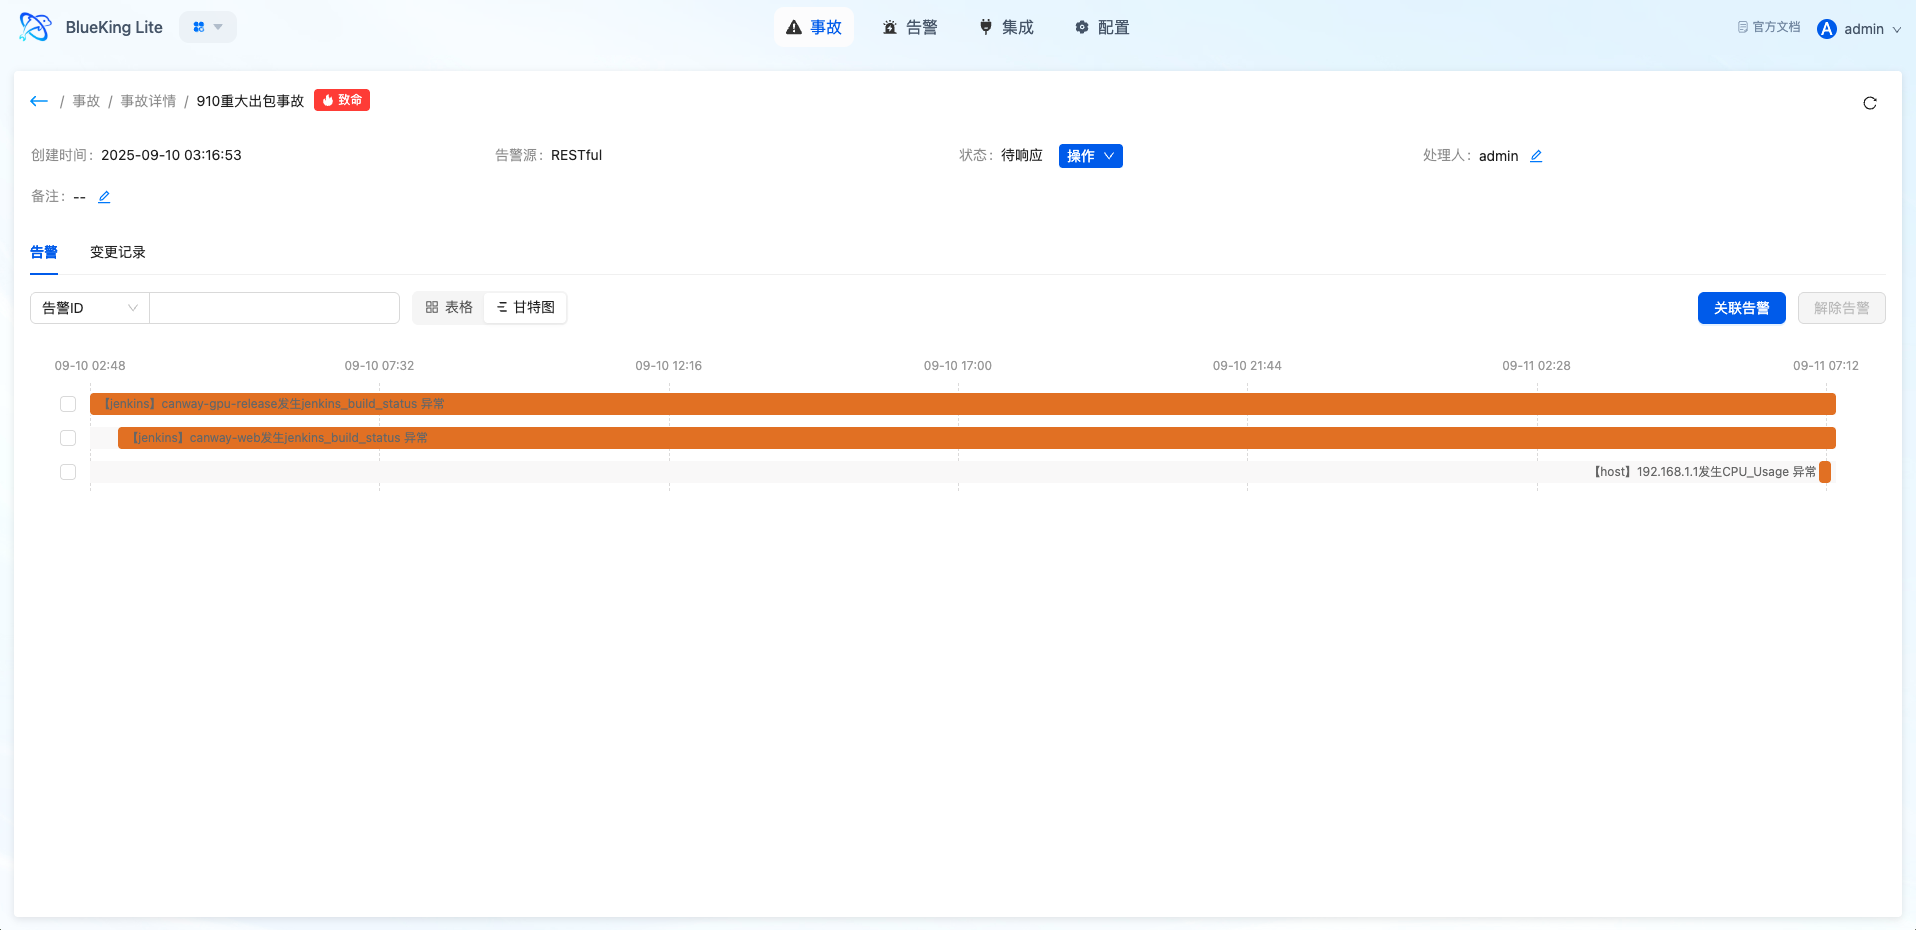
3. Incident
Incidents are used to handle problems that have escalated to higher business impact. They are not a simple rename of alerts, but rather elevate anomalies requiring team collaborative handling into higher-level management objects.
3.1 Core Positioning
When one or more alerts point to the same high-impact problem (such as core business interruption or cascading failure), upgrading to an Incident enables unified tracking of handling progress, organizing handling personnel, and centralized viewing of associated information.
3.2 State Machine Model
| Status | Description | Transition Operation |
|---|---|---|
| pending | Pending Response | Initial status after creation |
| processing | In Progress | Claim operation |
| closed | Closed | Close operation |
| resolved | Resolved | Recovery operation |
Incidents support reopen operations: closed incidents can re-enter the in-progress status.
3.3 Core Capabilities
- Multi-Alert Association: An incident can associate multiple alerts, providing unified viewing of related anomaly context and handling progress
- Centralized Collaboration Information: The incident detail page aggregates basic information, associated alert list, and handling process records, supporting multi-role sharing of the same problem view
- Gantt Chart Timeline: Visual display of the incident lifecycle and time spent in each phase, assisting post-mortem analysis
- Independent Status Management: Incidents have state transitions independent of alerts, supporting claim, close, reopen, and other operations
Interface Guide:
- Chart Interpretation / Configuration Logic: The incident page is suitable for handling medium-to-high impact problems. Compared to the alert list, it emphasizes the collaborative perspective, helping users shift from "handling individual anomalies" to "unified advancement of the same problem."
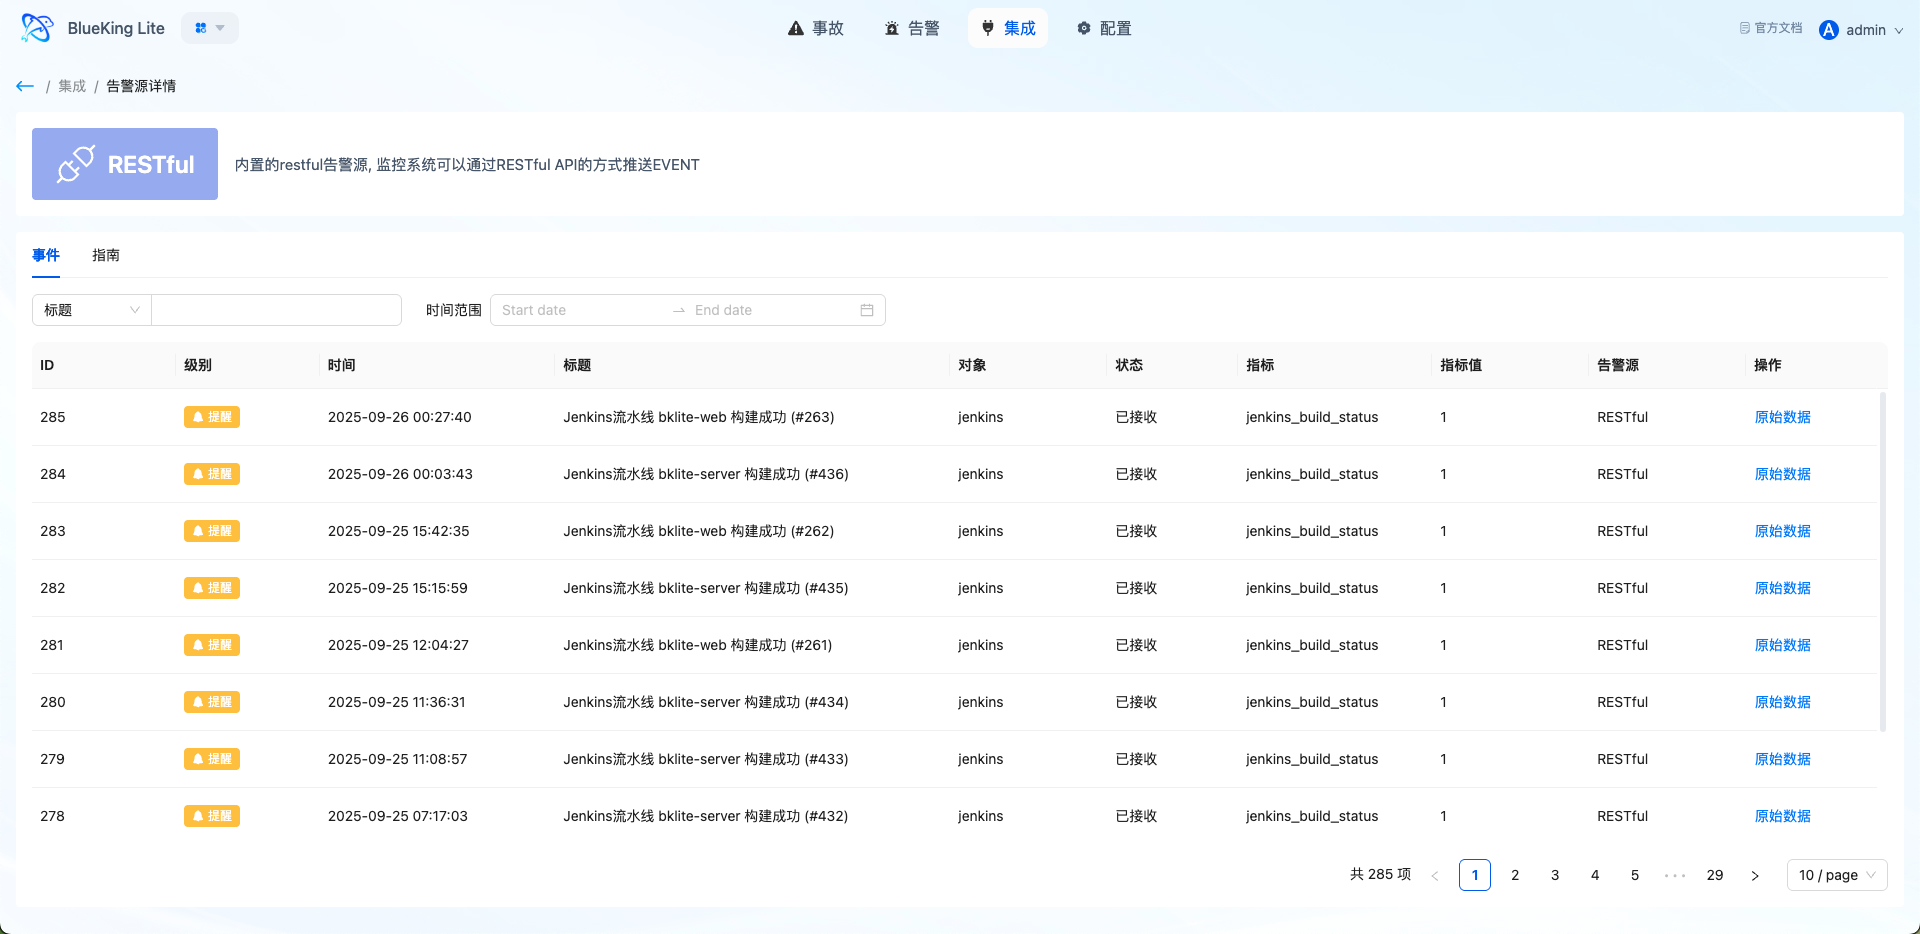
4. Integration Center
The Integration Center manages event onboarding sources and serves as the entry-level capability of the Alert Center. The platform manages different system onboarding methods, authentication information, and operational status through alert sources.
4.1 Core Positioning
The Integration Center solves "where events come from, how to safely enter the platform, and how to verify that onboarding is successful." It centralizes onboarding configuration, guide viewing, and event verification in a single entry point, facilitating platform administrators in maintaining a standardized onboarding system.
4.2 Supported Onboarding Methods
| Onboarding Method | Applicable Scenario | Authentication Method |
|---|---|---|
| REST API | External systems actively push events | SECRET field in Header or Body |
| NATS | Message queue async consumption | NATS connection configuration |
| Prometheus | Prometheus Alertmanager integration | Webhook configuration |
| Zabbix | Zabbix alert push | Custom scripts or Webhook |
| Webhook | Generic Webhook onboarding | URL + Secret |
4.3 Core Capabilities
- Source-Level Authentication Management: Each alert source has independent onboarding keys, supporting security boundary management per source
- Field Mapping Configuration: Customize upstream field to standard event model mapping through
event_fields_mapping - Onboarding Guide Generation: Automatically generates onboarding guides including interface address, request format, and authentication parameters
- Recent Event Viewing: View recently received events in alert source details for quick verification of onboarding pipeline
- Lifecycle Management: Supports add, edit, disable, and delete (soft delete) operations for alert sources
Interface Guide:
- Chart Interpretation / Configuration Logic: The Integration Center is both an onboarding configuration entry and a troubleshooting entry. If expected alerts are not seen after onboarding, you should first verify source configuration, authentication parameters, and event reception status.
5. Settings Center
The Settings Center stabilizes alert governance rules, upgrading the platform from "passively receiving messages" to "actively managing problems." It includes event-level correlation rules, dispatch policies, shield policies, system settings, and operation logs.
5.1 Correlation Rules
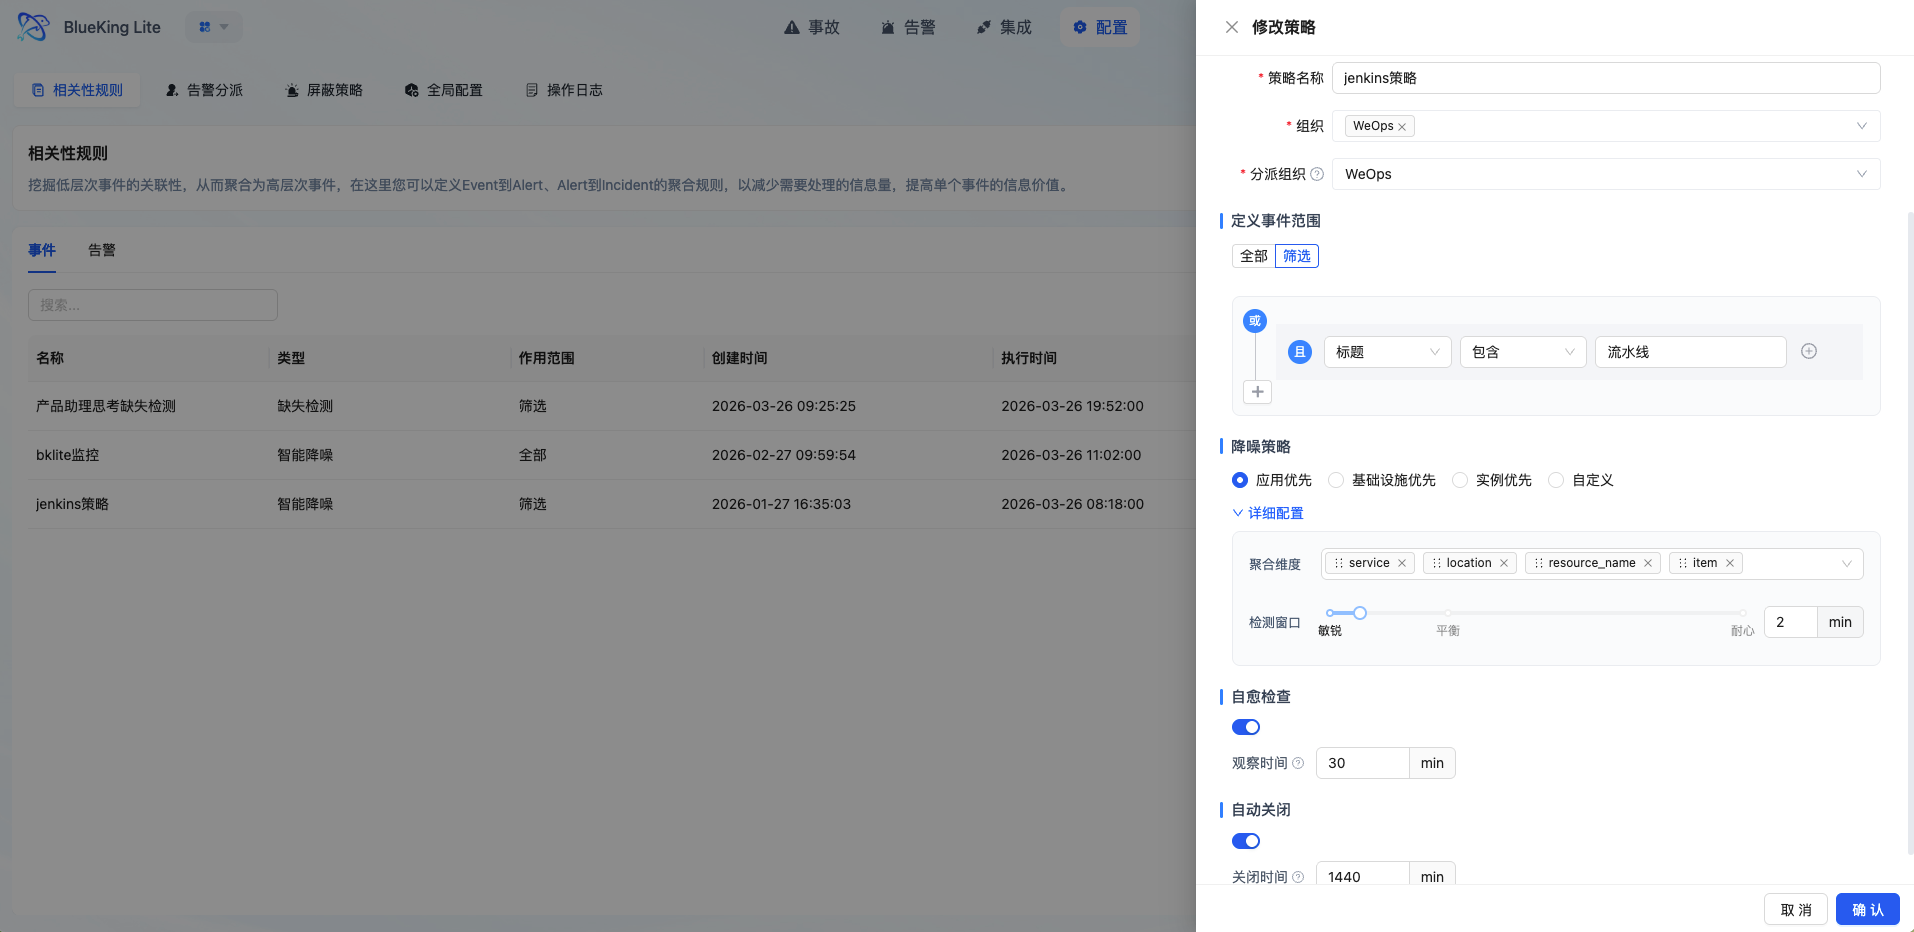
Correlation rules define how Events are aggregated into Alerts, serving as the core engine for alert noise reduction and value extraction.
5.1.1 Policy Types
| Policy Type | Description | Applicable Scenario |
|---|---|---|
| Smart Denoise | Aggregates matching events for noise reduction | Routine monitoring alert convergence |
| Missing Detection | Detects when expected events fail to arrive on time | Scheduled tasks, heartbeat monitoring |
| Instant | Generates one-to-one alerts immediately upon event storage without aggregation window | Critical single-point anomalies requiring zero-latency awareness |
5.1.2 Window Types
| Window Type | Description | Applicable Scenario |
|---|---|---|
| Sliding | Continuous time segments with overlapping windows | Continuous anomaly monitoring |
| Fixed | Fixed time slices, such as per minute/hour | Periodic statistics |
| Session | Identifies problem persistence based on event intervals | Jitter filtering, timeout detection |
5.1.3 Core Capabilities
- Flexible Matching Rules: Supports multiple condition combinations (outer OR, inner AND), filtering by source, level, resource, labels, and other dimensions
- Multi-Dimensional Group Aggregation: Define aggregation dimensions through
group_by(e.g.,resource_id,service); events with the same dimension aggregate into a single alert - Fingerprint Algorithm Deduplication: Ensures only one active alert is produced per problem through MD5 hash-based event fingerprint calculation
- Session Observation Period: Session window policies support observation period mechanism; events recovering within the observation period do not transition to formal alerts
- Auto-Close Configuration: Supports setting auto-close time for rule-generated alerts to control long-standing problem accumulation
- Async Dispatch Scheduling: New alerts execute auto-dispatch through Celery async tasks without blocking aggregation flow
Interface Guide:
5.2 Alert Dispatch
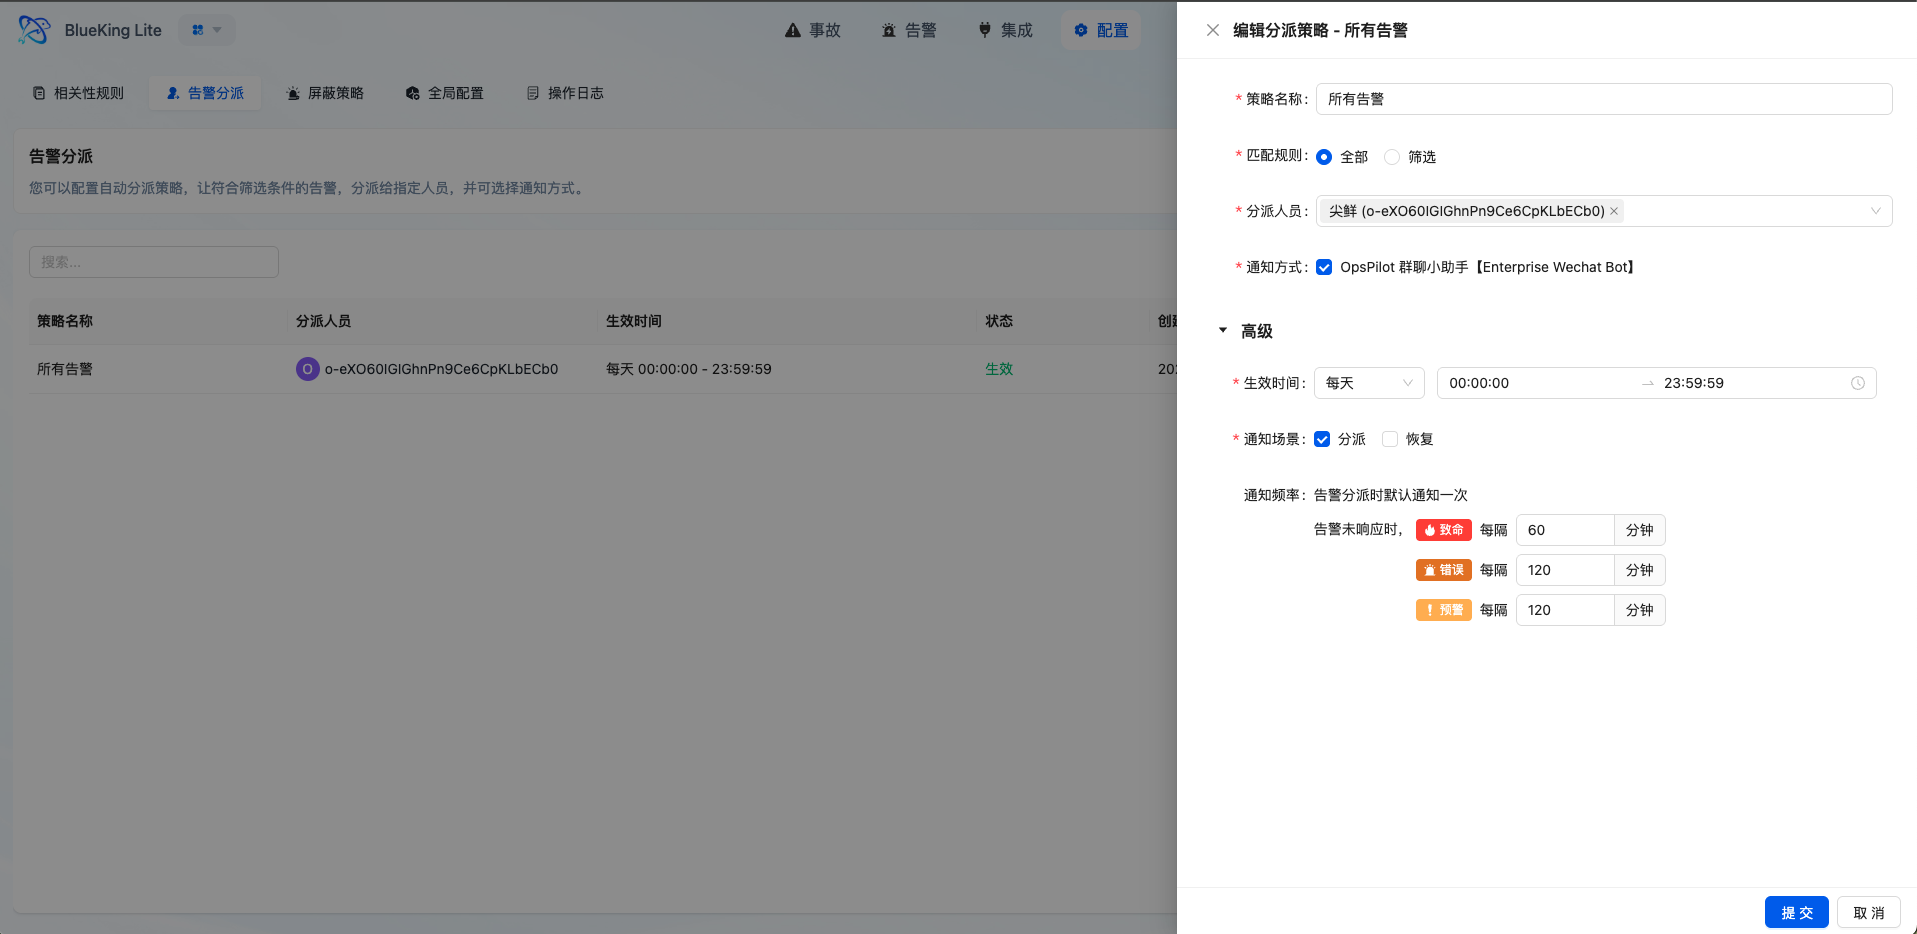
Dispatch policies are responsible for automatically assigning alerts matching conditions to responsible persons or teams, improving problem flow into handling processes.
5.2.1 Matching Types
| Matching Type | Description |
|---|---|
| All Match (ALL) | All unassigned alerts matching the time range are hit |
| Condition Filter (FILTER) | Matches alert fields to rules, supporting operators like eq, ne, contains, not_contains, re |
5.2.2 Core Capabilities
- Flexible Effective Time: Supports one-time, daily, weekly, and monthly time range configurations to adapt to different on-call schedules
- Tiered Reminder Mechanism: Configurable reminder frequencies by alert level (e.g., fatal level reminds every 30 minutes, up to 10 times)
- Notification Channel Integration: Auto-triggers notifications after successful dispatch, synchronizing problems to responsible persons
- Fallback Dispatch Guarantee: Alerts not matching any policy enter the fallback queue, receiving periodic administrator notifications per global configuration
- Operation Log Recording: Auto-dispatch operations are recorded in operation logs for audit tracing
Interface Guide:
- Chart Interpretation / Configuration Logic: The core of dispatch policies is defining "what type of problem gets automatically assigned to whom at what time." Properly configured policies can significantly reduce manual judgment and transfer overhead, improving MTTR.
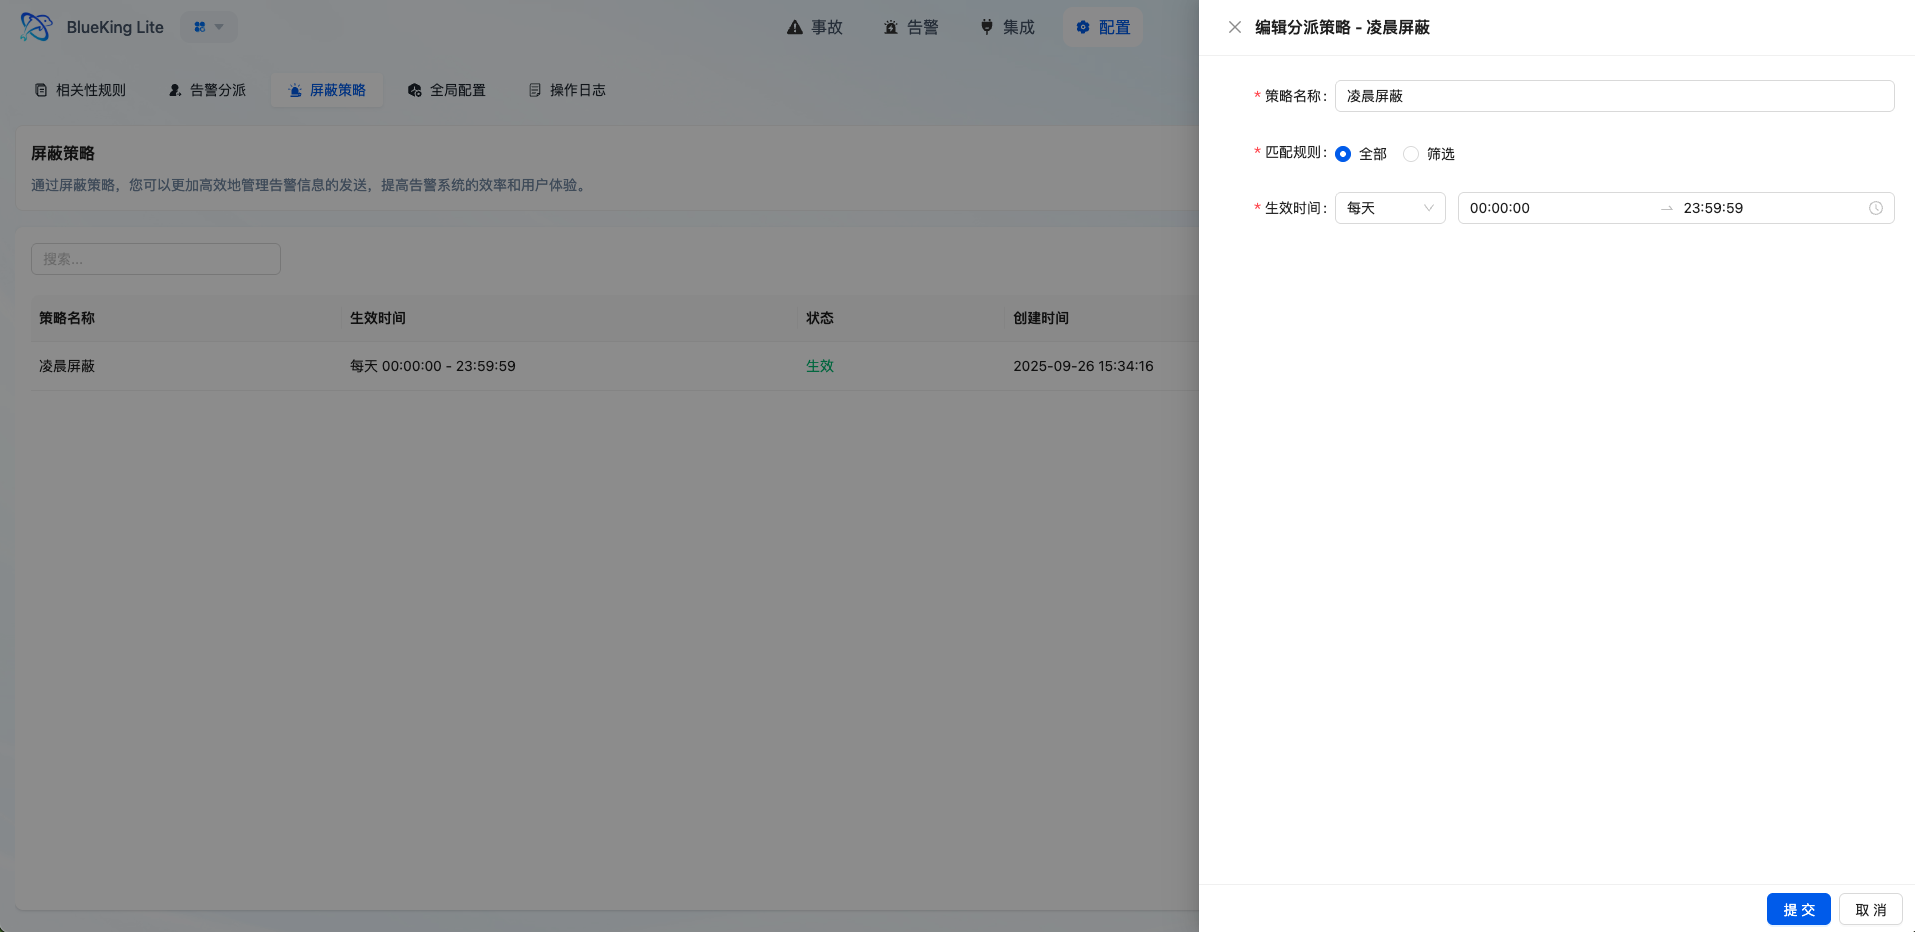
5.3 Shield Policy
Shield policies filter out low-value, known, or maintenance-window events that don't need to enter the alert handling pipeline.
5.3.1 Core Capabilities
- Multi-Dimensional Condition Matching: Supports configuring match conditions by source, resource, title, content, level, and other fields
- Flexible Time Control: Supports one-time, daily, weekly, monthly, and other time range configurations for maintenance windows or periodic operations
- Pre-Filtering Noise Reduction: Events matching shield policies are immediately marked as
SHIELDstatus after storage, bypassing subsequent aggregation and dispatch pipelines - Visibility Preservation: Shielded events remain viewable in the event list for tracing and audit purposes
Interface Guide:
- Chart Interpretation / Configuration Logic: Shield policies are suitable for governing "events known to not require handling," such as planned maintenance and repetitive low-value notifications. Use with caution to avoid over-shielding.
5.4 Missing Detection Policy
Missing Detection is a special policy type for detecting expected events that fail to arrive on time, applicable to scheduled tasks, heartbeat monitoring, and similar scenarios.
5.4.1 Core Capabilities
- Cron Expression Configuration: Define expected event arrival patterns through Cron
- Activation Mode Selection: Supports "first heartbeat activation" (monitoring starts after receiving first event) or "immediate activation"
- Grace Period Setting: Supports configuring grace period (delayed time after expected arrival before triggering alert)
- Auto-Recovery: When missing alerts are generated, subsequent events matching the rule automatically recover the alert
- Runtime Status Tracking: Records last heartbeat time and current monitoring status (waiting/monitoring/alerting)
Note: Missing Detection policies depend on continuous scheduled task checks. Ensure platform Celery Worker is running normally.
5.5 Alert Enrichment
Alert enrichment automatically supplements context fields from external data sources (currently supporting CMDB) during alert generation through manageable declarative rules, solving the "alerts exist but we don't know who is affected, responsible, or in which data center" information gap.
5.5.1 Operating Principle
Each enrichment rule contains the following core configuration items:
| Configuration Item | Description |
|---|---|
| Match Conditions | OR-of-AND condition combinations supporting operators like equals, not equals, contains, not contains, regex; no conditions match all alerts |
| Data Source Binding | Define mapping from alert fields to data source query parameters (e.g., use alert's resource ID to query same-named instance in CMDB) |
| Output Projection | Declare which fields to extract from data source results, with what aliases to write into alerts; no configuration writes all result fields |
| Namespace | Assigns an identifier to the rule (e.g., cmdb); enrichment results partition into alert extension info by namespace; different rules don't overwrite each other's results |
| Enable/Disable | Rule-level switch to control if the rule takes effect without deleting it |
5.5.2 Multi-Result Handling Strategy
When a single query matches multiple data source records, configure one of the following strategies:
| Strategy | Description |
|---|---|
| First (first) | Default strategy; take fields from the first sorted record; suitable for ID-unique lookups |
| Merge (merge) | Merge fields from multiple records sequentially (latter overrides same-named fields from former) |
| List (list) | Collect same-named fields from multiple records as lists; suitable for one-to-many relationships |
5.5.3 Propagation to Alerts
Enrichment executes when Events are ingested, with results propagated to corresponding Alerts. For multiple events under the same alert, take the first non-empty enrichment data per namespace, ensuring later events don't overwrite existing context.
5.5.4 Enrichment Rule Management
- Visual CRUD: Create, edit, enable/disable enrichment rules through settings center interface with all changes recorded in operation logs
- Built-in Preset Rules: Platform provides out-of-the-box built-in rules (named with "Built-in-" prefix); enable enrichment function switch in global configuration to take effect immediately
- Adoption Metrics: Settings center provides enrichment rule adoption metrics including total rules, enablement ratio, enriched alert count and ratio for effectiveness evaluation
- Replaces Global Enrichment Switch: This function replaces the old version's binary "on/off" global enrichment switch with a refined rule engine, allowing separate enrichment logic configuration per alert type, balancing flexibility and performance
Interface Guide:
- Chart Interpretation / Configuration Logic: Enrichment rules' core value is enabling on-call personnel to view alerts without manually querying CMDB or other systems for "which business owns this host, who's responsible" — this context is already auto-attached to alert details, directly supporting dispatch and handling decisions.
5.6 Alert Escalation
Alert escalation adds "escalation chain" capability within dispatch policies: if dispatched alerts remain unclaimed within the configured wait time, the platform automatically switches or expands the on-duty personnel set and re-notifies, ensuring high-impact problems don't suspend due to no response.
5.6.1 Operating Principle
Escalation chains are stored as JSON structures within dispatch rules, advanced by independent AlertEscalationTask every minute, decoupled from in-level reminder tasks. After each escalation, reminder count auto-resets and budget re-allocates per new on-duty set; both clocks share the same notification sending exit.
5.6.2 Escalation Modes
| Mode | Description |
|---|---|
| Append | Handlers from next level append to previous level; claim eligibility continuously expands |
| Replace | Next level handlers completely replace previous level; notification recipients switch to new team |
5.6.3 Escalation Chain Configuration
Each escalation chain consists of multiple levels; each level requires configuring:
| Configuration Item | Description |
|---|---|
| Personnel | Responsible persons on duty at this level (required, at least one person) |
| Wait Minutes | After how many minutes at this level without claims trigger escalation (must > 0) |
| Level Notification Channels | Optional; uses dispatch rule's default channels if not configured |
Level 0 is the initial responsible person; subsequent levels are escalation targets. Layer 0 personnel are incorporated into the alert's claim candidate set at dispatch time.
5.6.4 Escalation Termination Conditions
Escalation tasks immediately stop when any of the following occurs:
- Claim: Alert is claimed; problem has a handler
- Resolve: Alert marked as resolved
- Close: Alert closed
Reassign does not stop escalation; instead resets escalation timing to Level 0, restarting the countdown from the new responsible person.
Note: Escalation tasks depend on Celery Beat's minute-level
check_and_send_escalationsscheduling. Ensure platform scheduled tasks run normally.
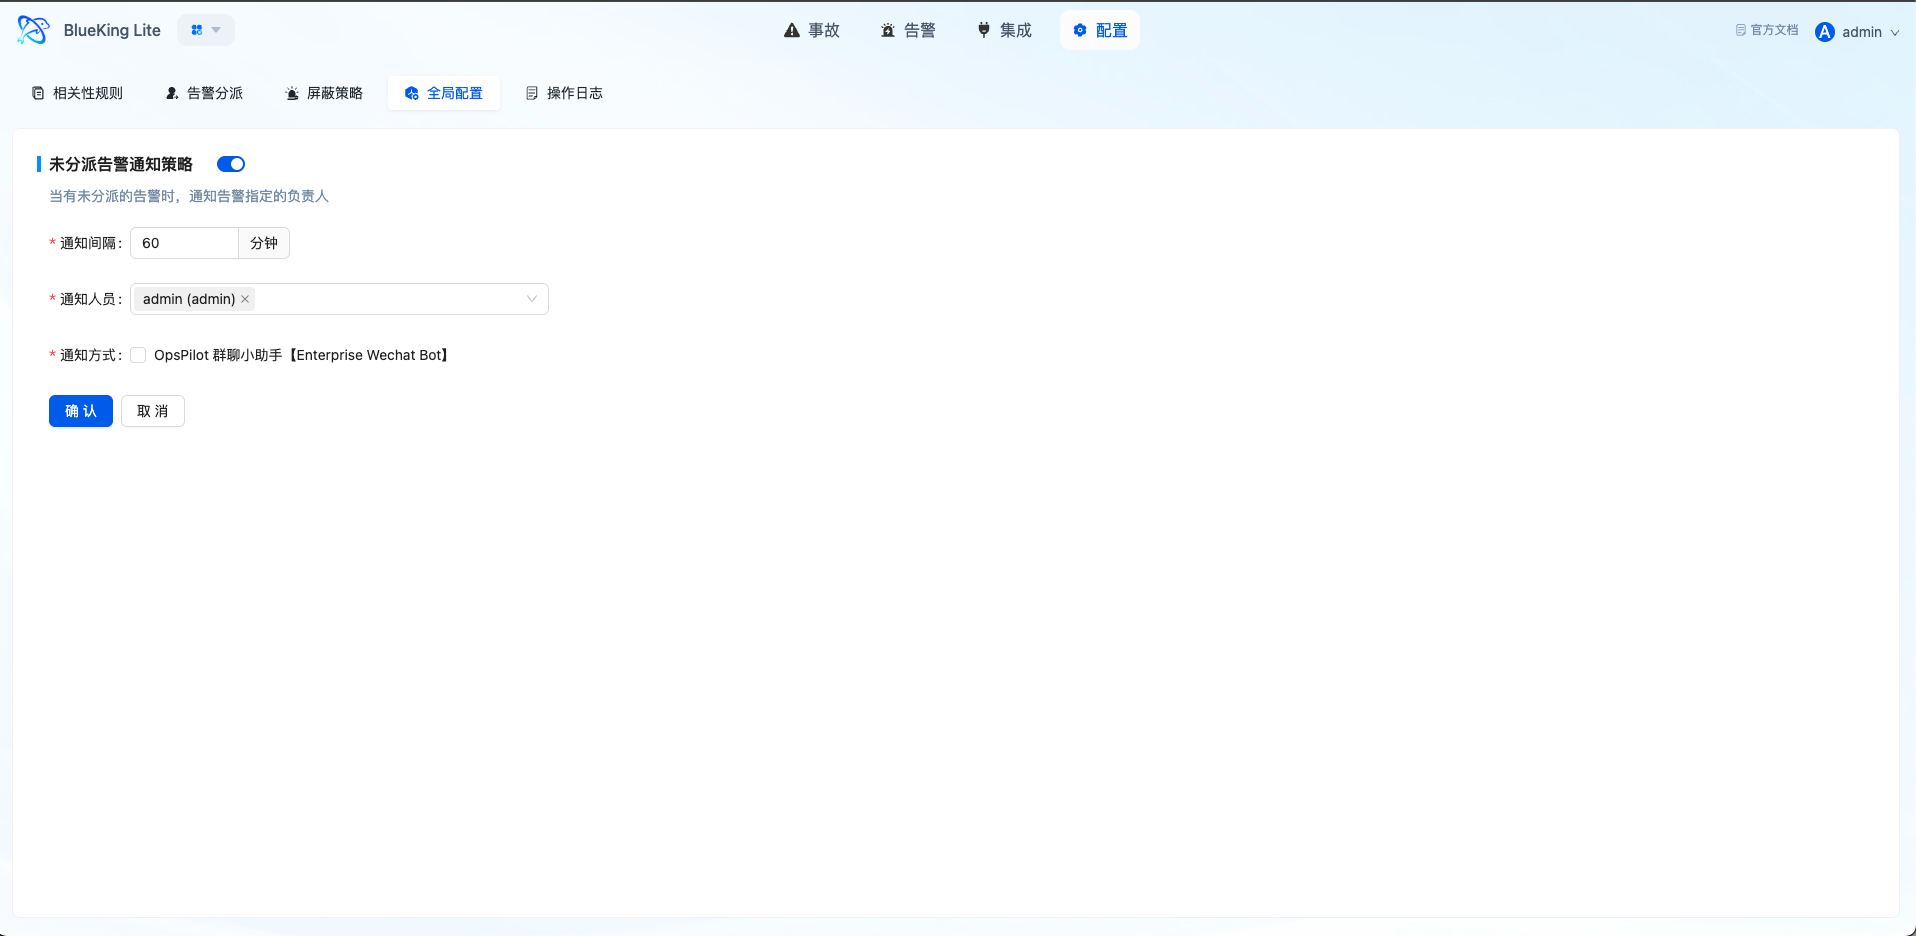
5.7 Global Configuration and Operation Logs
5.7.1 Global Configuration
System-level configuration items control Alert Center global behavior, including:
- Fallback dispatch notification configuration
- Alert enrichment feature switch
- Auto-close policy parameters
5.7.2 Operation Logs
Operation logs record critical changes and handling actions, forming important components of platform governance and audit:
- Log Types: Event, Alert, Incident, System
- Operation Types: Create, Modify, Delete, Execute
- Record Contents: Operator, operation object, before/after values, operation timestamp
Interface Guide:
- Chart Interpretation / Configuration Logic: Global configuration embodies the consistency of platform handling policies; operation logs embody the transparency of governance actions. Together, they guide the Alert Center from "functional" to "governable."