Features
1. Monitoring View (View)
The Monitoring View is the daily core workstation for operations personnel, enabling layered visualization from "global resource overview" to "deep instance-level metrics," covering all scenarios including resource status viewing, metric trend analysis, and alert correlation.
1.1 Global Resource View (List/Honeycomb)
Provides a centralized overview of all operations objects, supporting switching between list and honeycomb (Hive) views for quick target resource identification and basic status viewing (due to type differences, some resources like Pod/Node support honeycomb extended display).
Core Capabilities
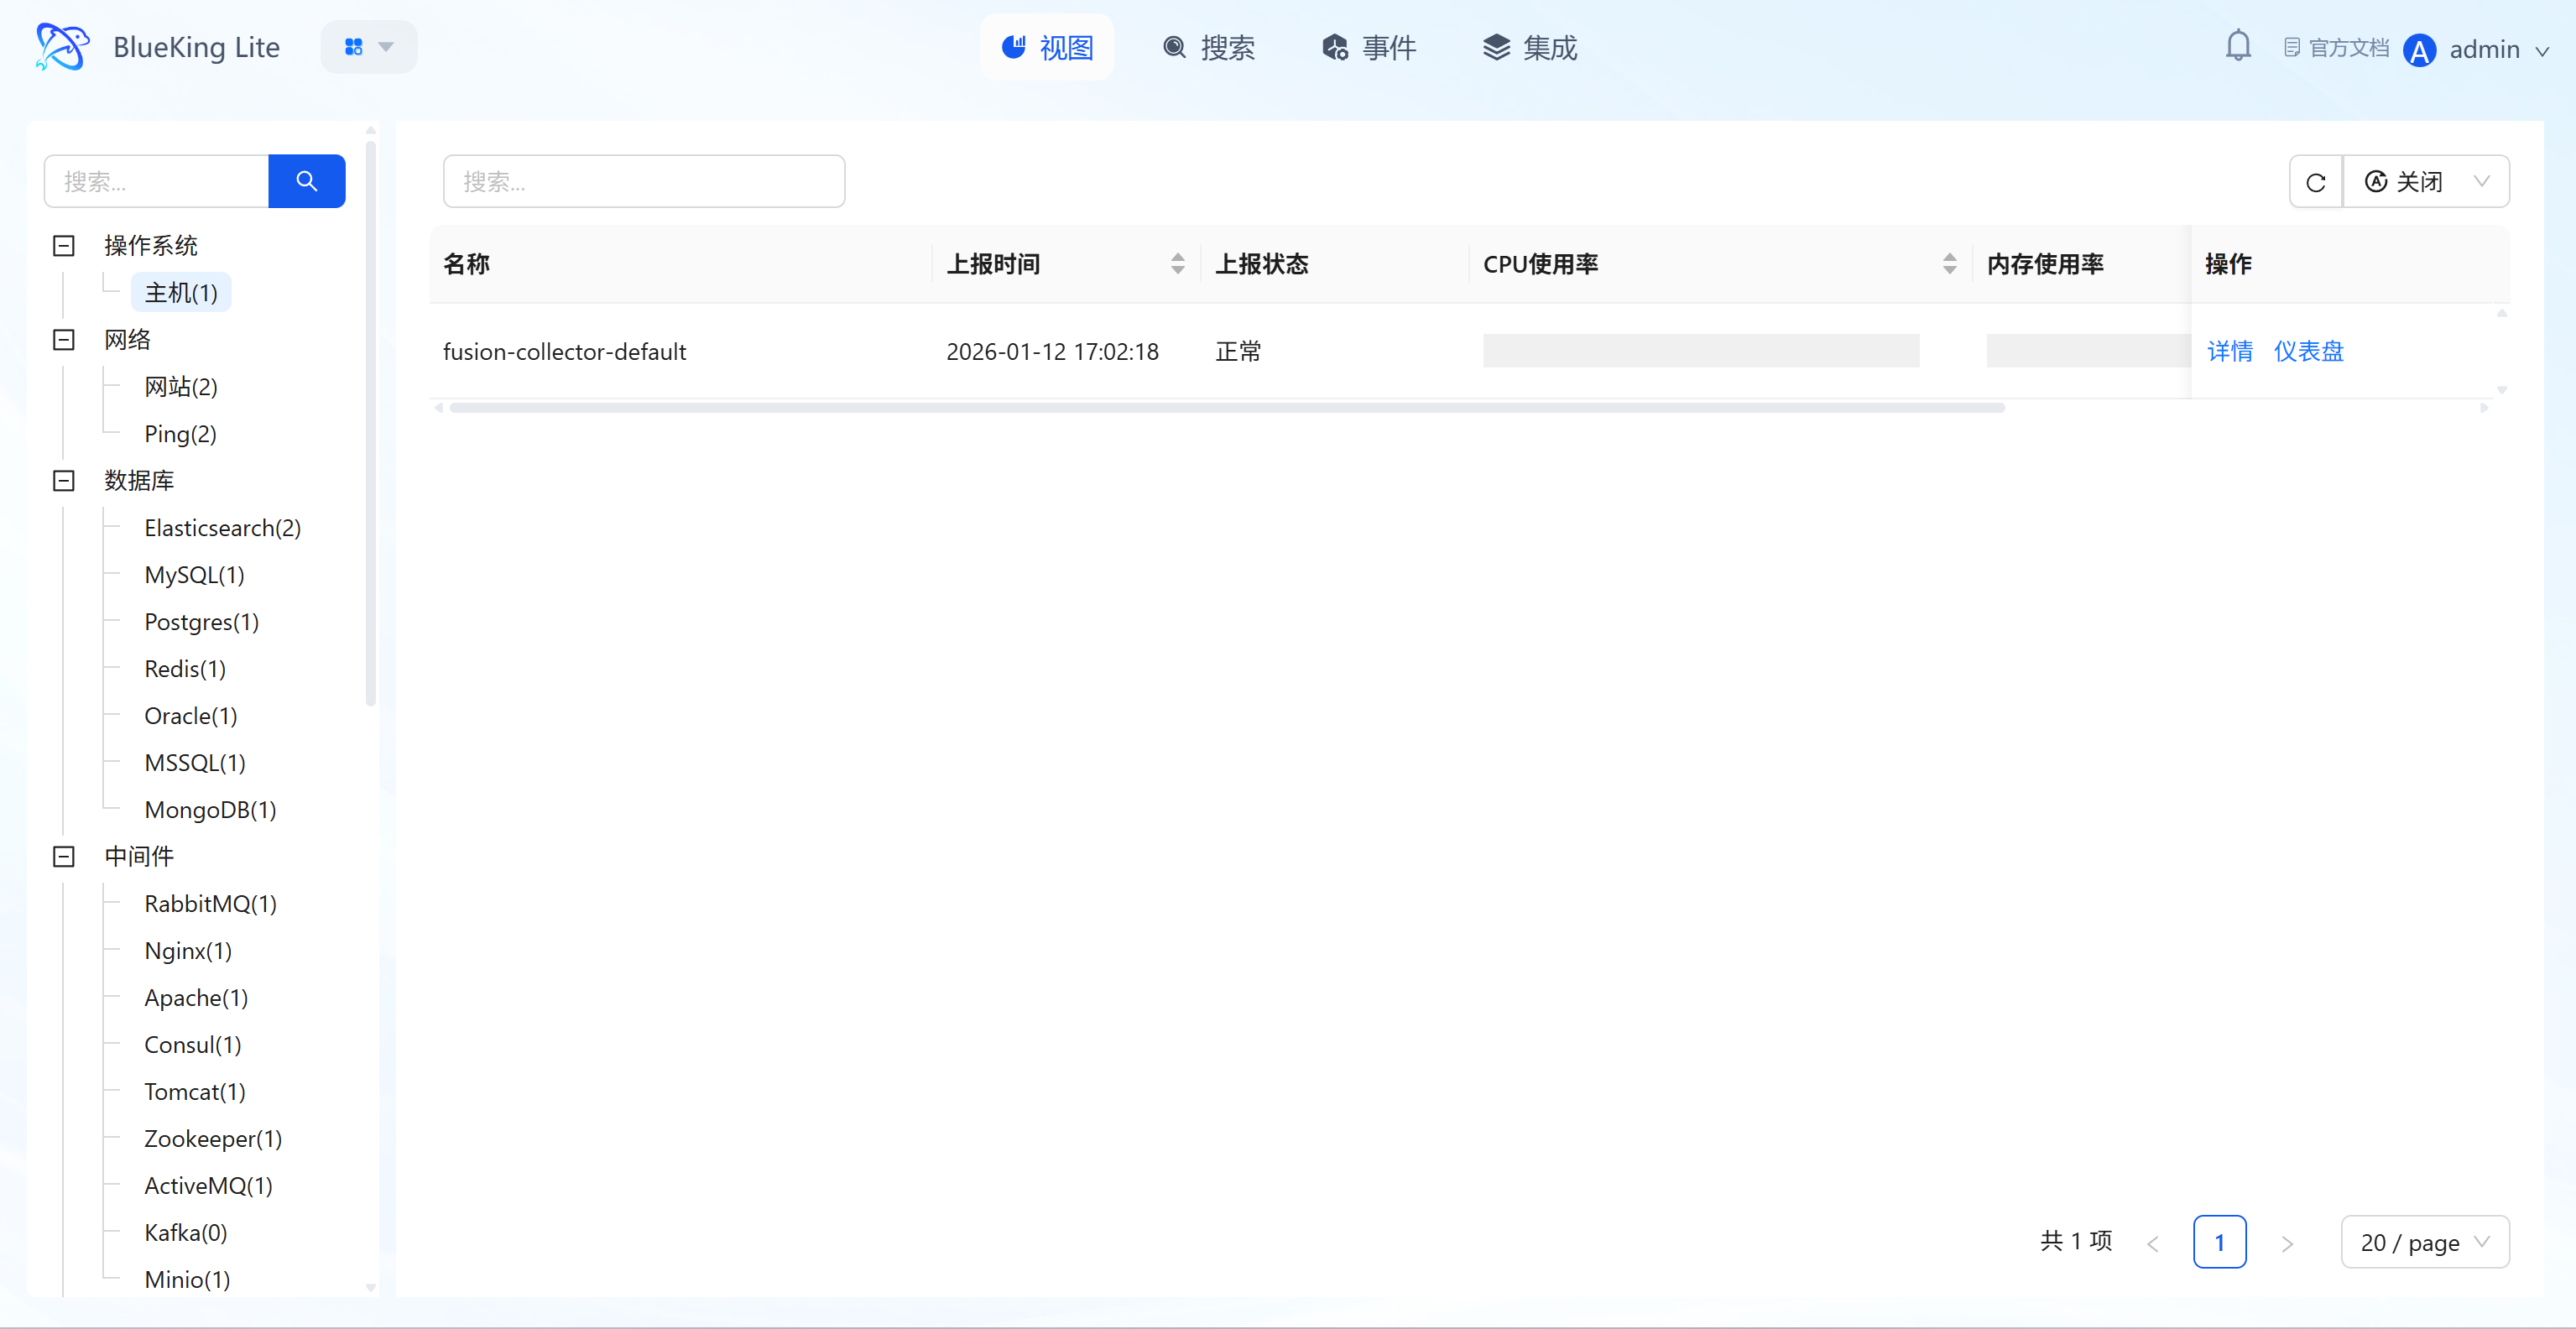
- Multi-Dimensional Category Navigation: The left panel supports filtering managed objects by dimensions such as "Operating System (Host), Network (Website/Ping), Database (Elasticsearch/MySQL, etc.), Middleware (RabbitMQ/Nginx, etc.)," with resource counts annotated next to each category (e.g., "Host(1)");
- Core Status Overview: List mode displays resource "Name, Report Time, Report Status (Normal/Abnormal), CPU Usage, Memory Usage"; honeycomb mode visually presents cluster or node density and status distribution through hexagonal color blocks;
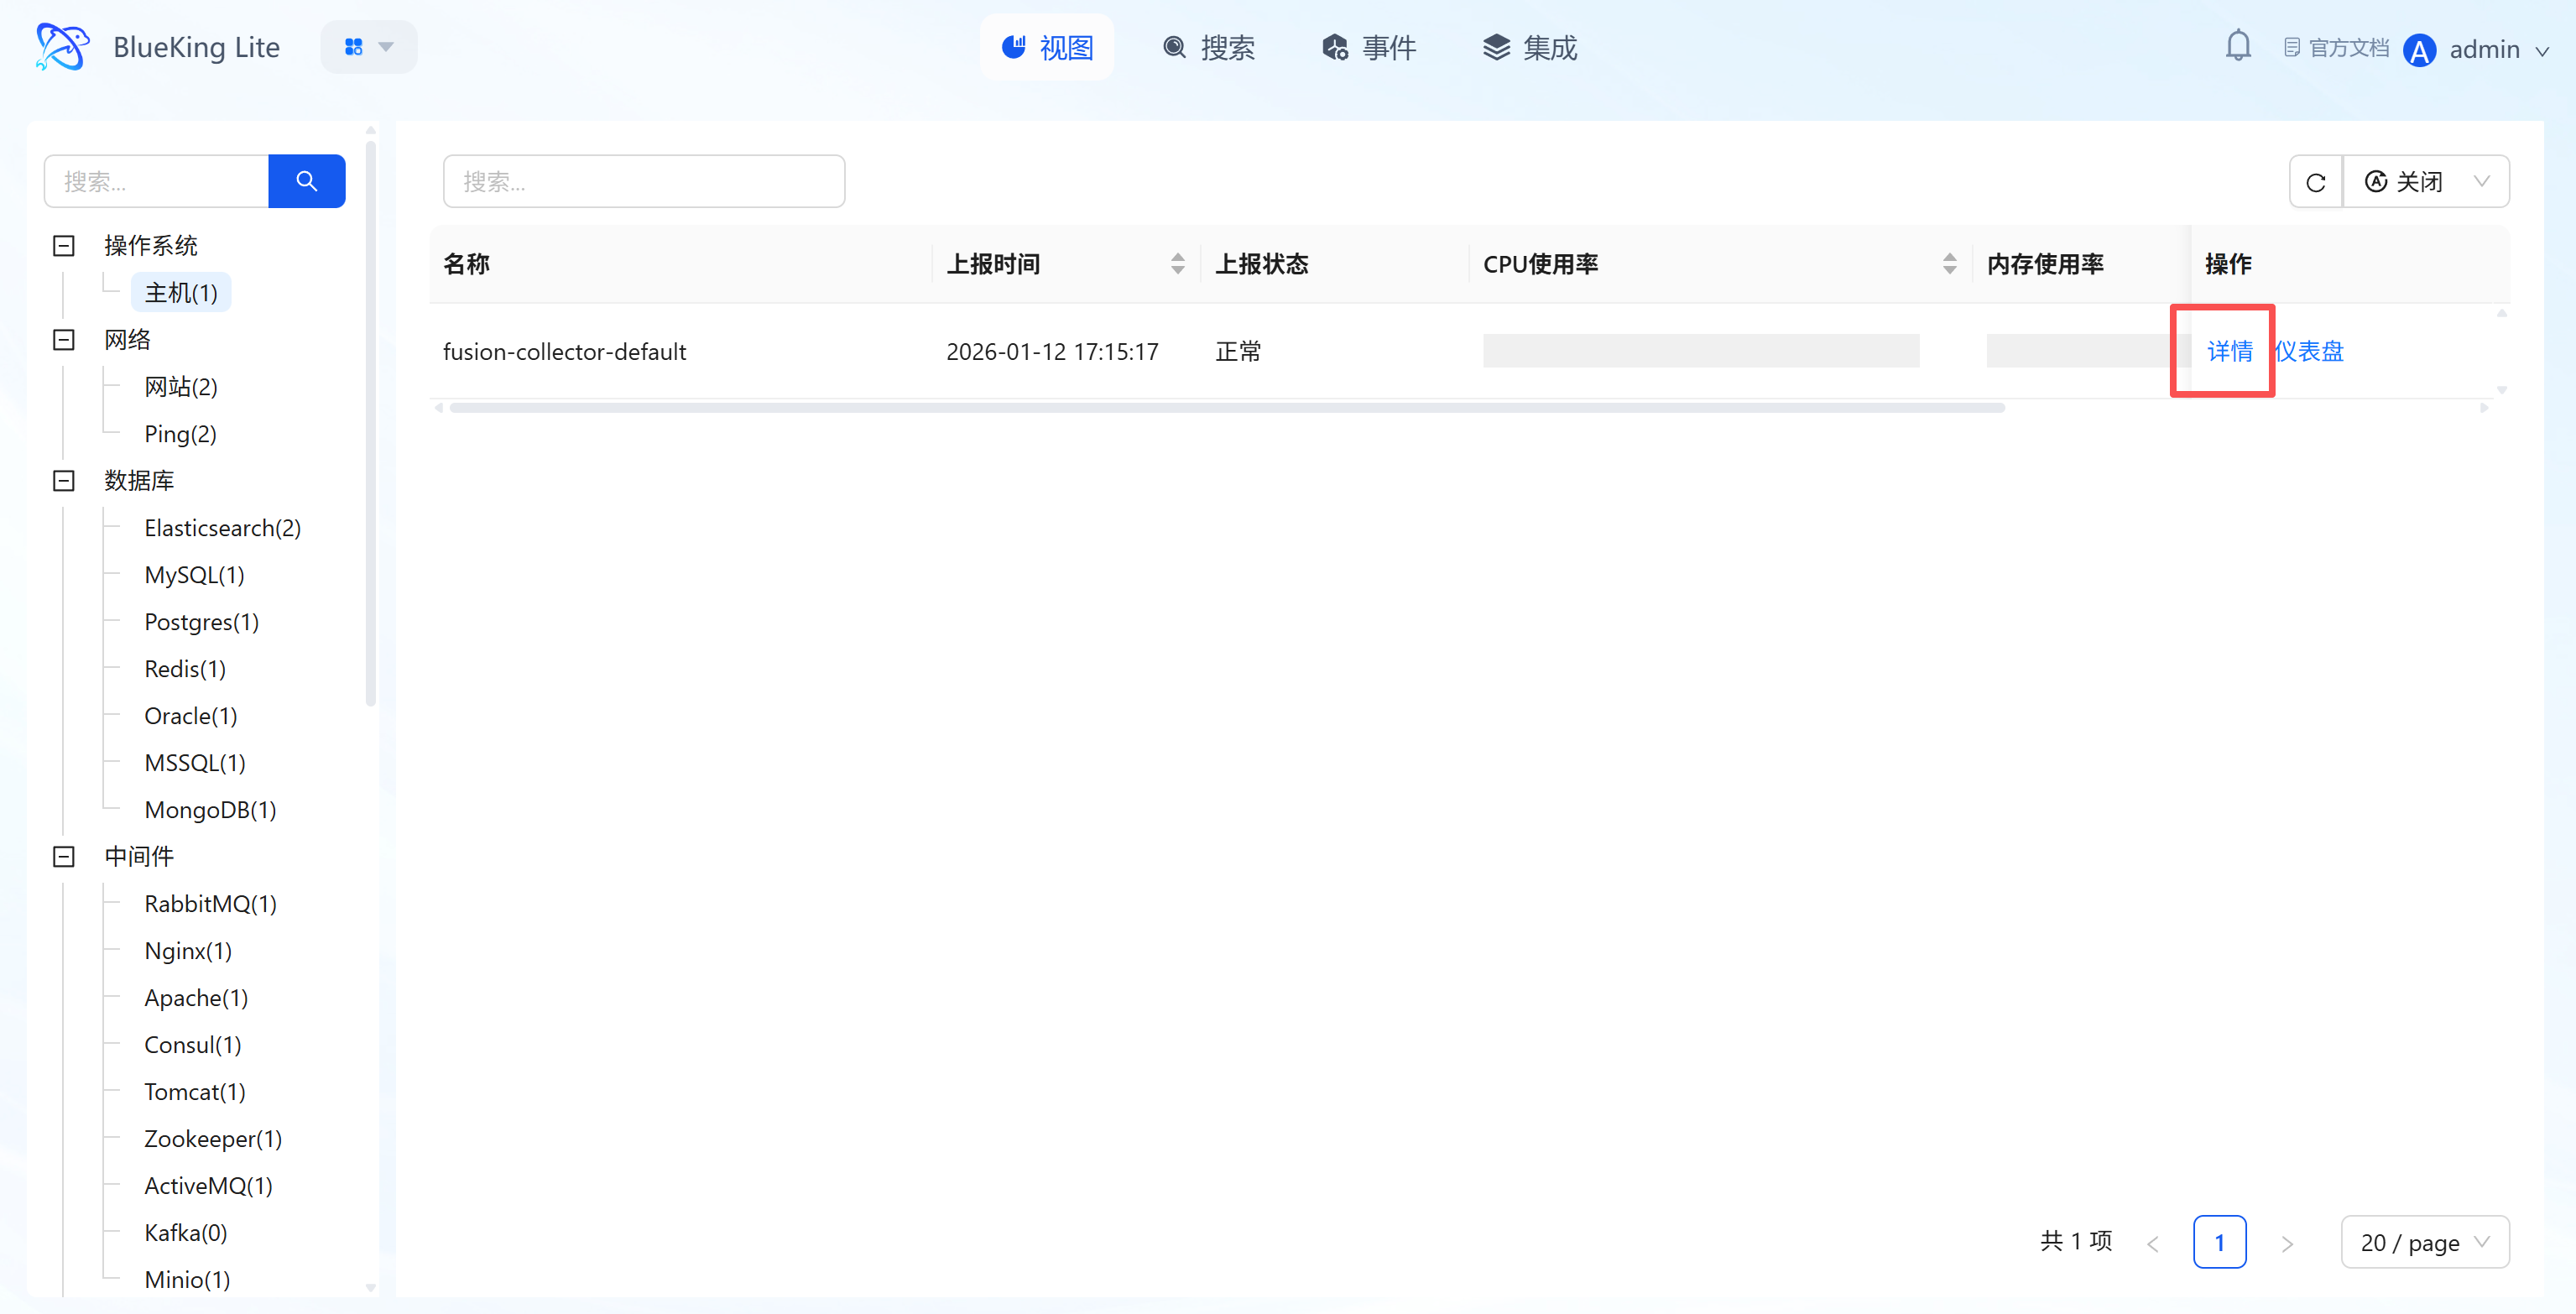
- Quick Action Entry Points: Each resource provides "View Instance (modal)" and "Dashboard Details" buttons on the right side or in hover tooltips, enabling one-click access to in-depth information.
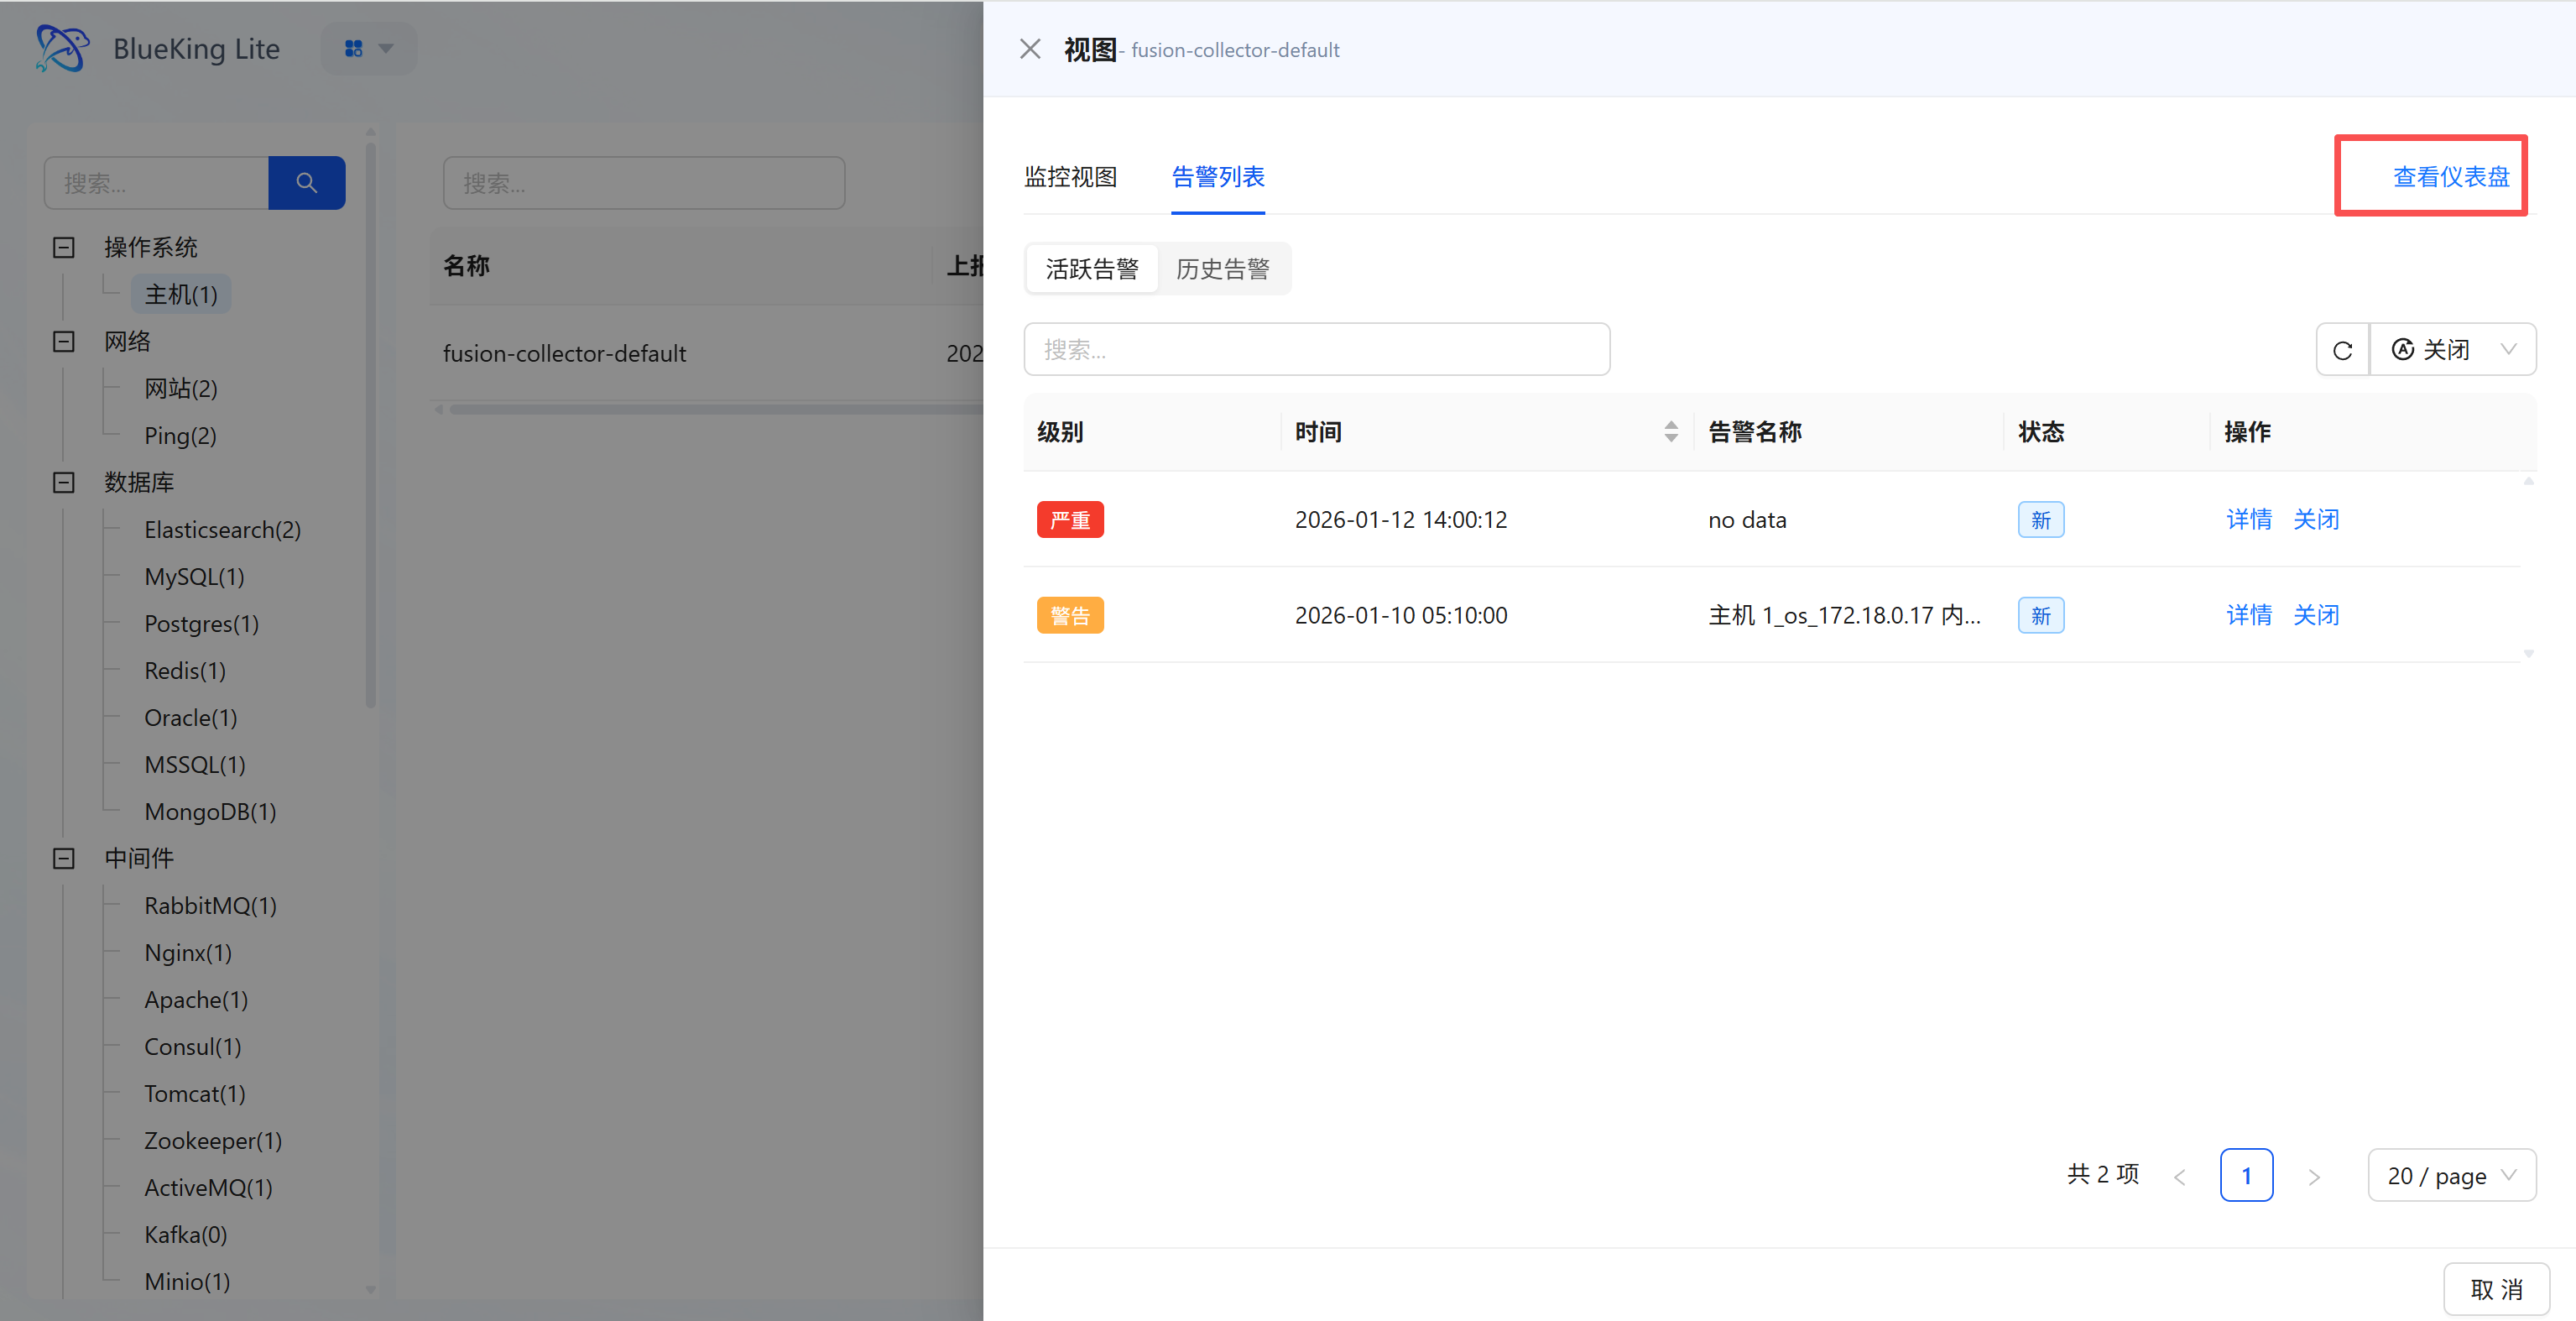
1.2 Instance View Modal (View Modal)
Provides quick deep information aggregation for a single resource, allowing you to view charts and alerts within the current context without page navigation.
Core Capabilities
- Dual Tab Switching:
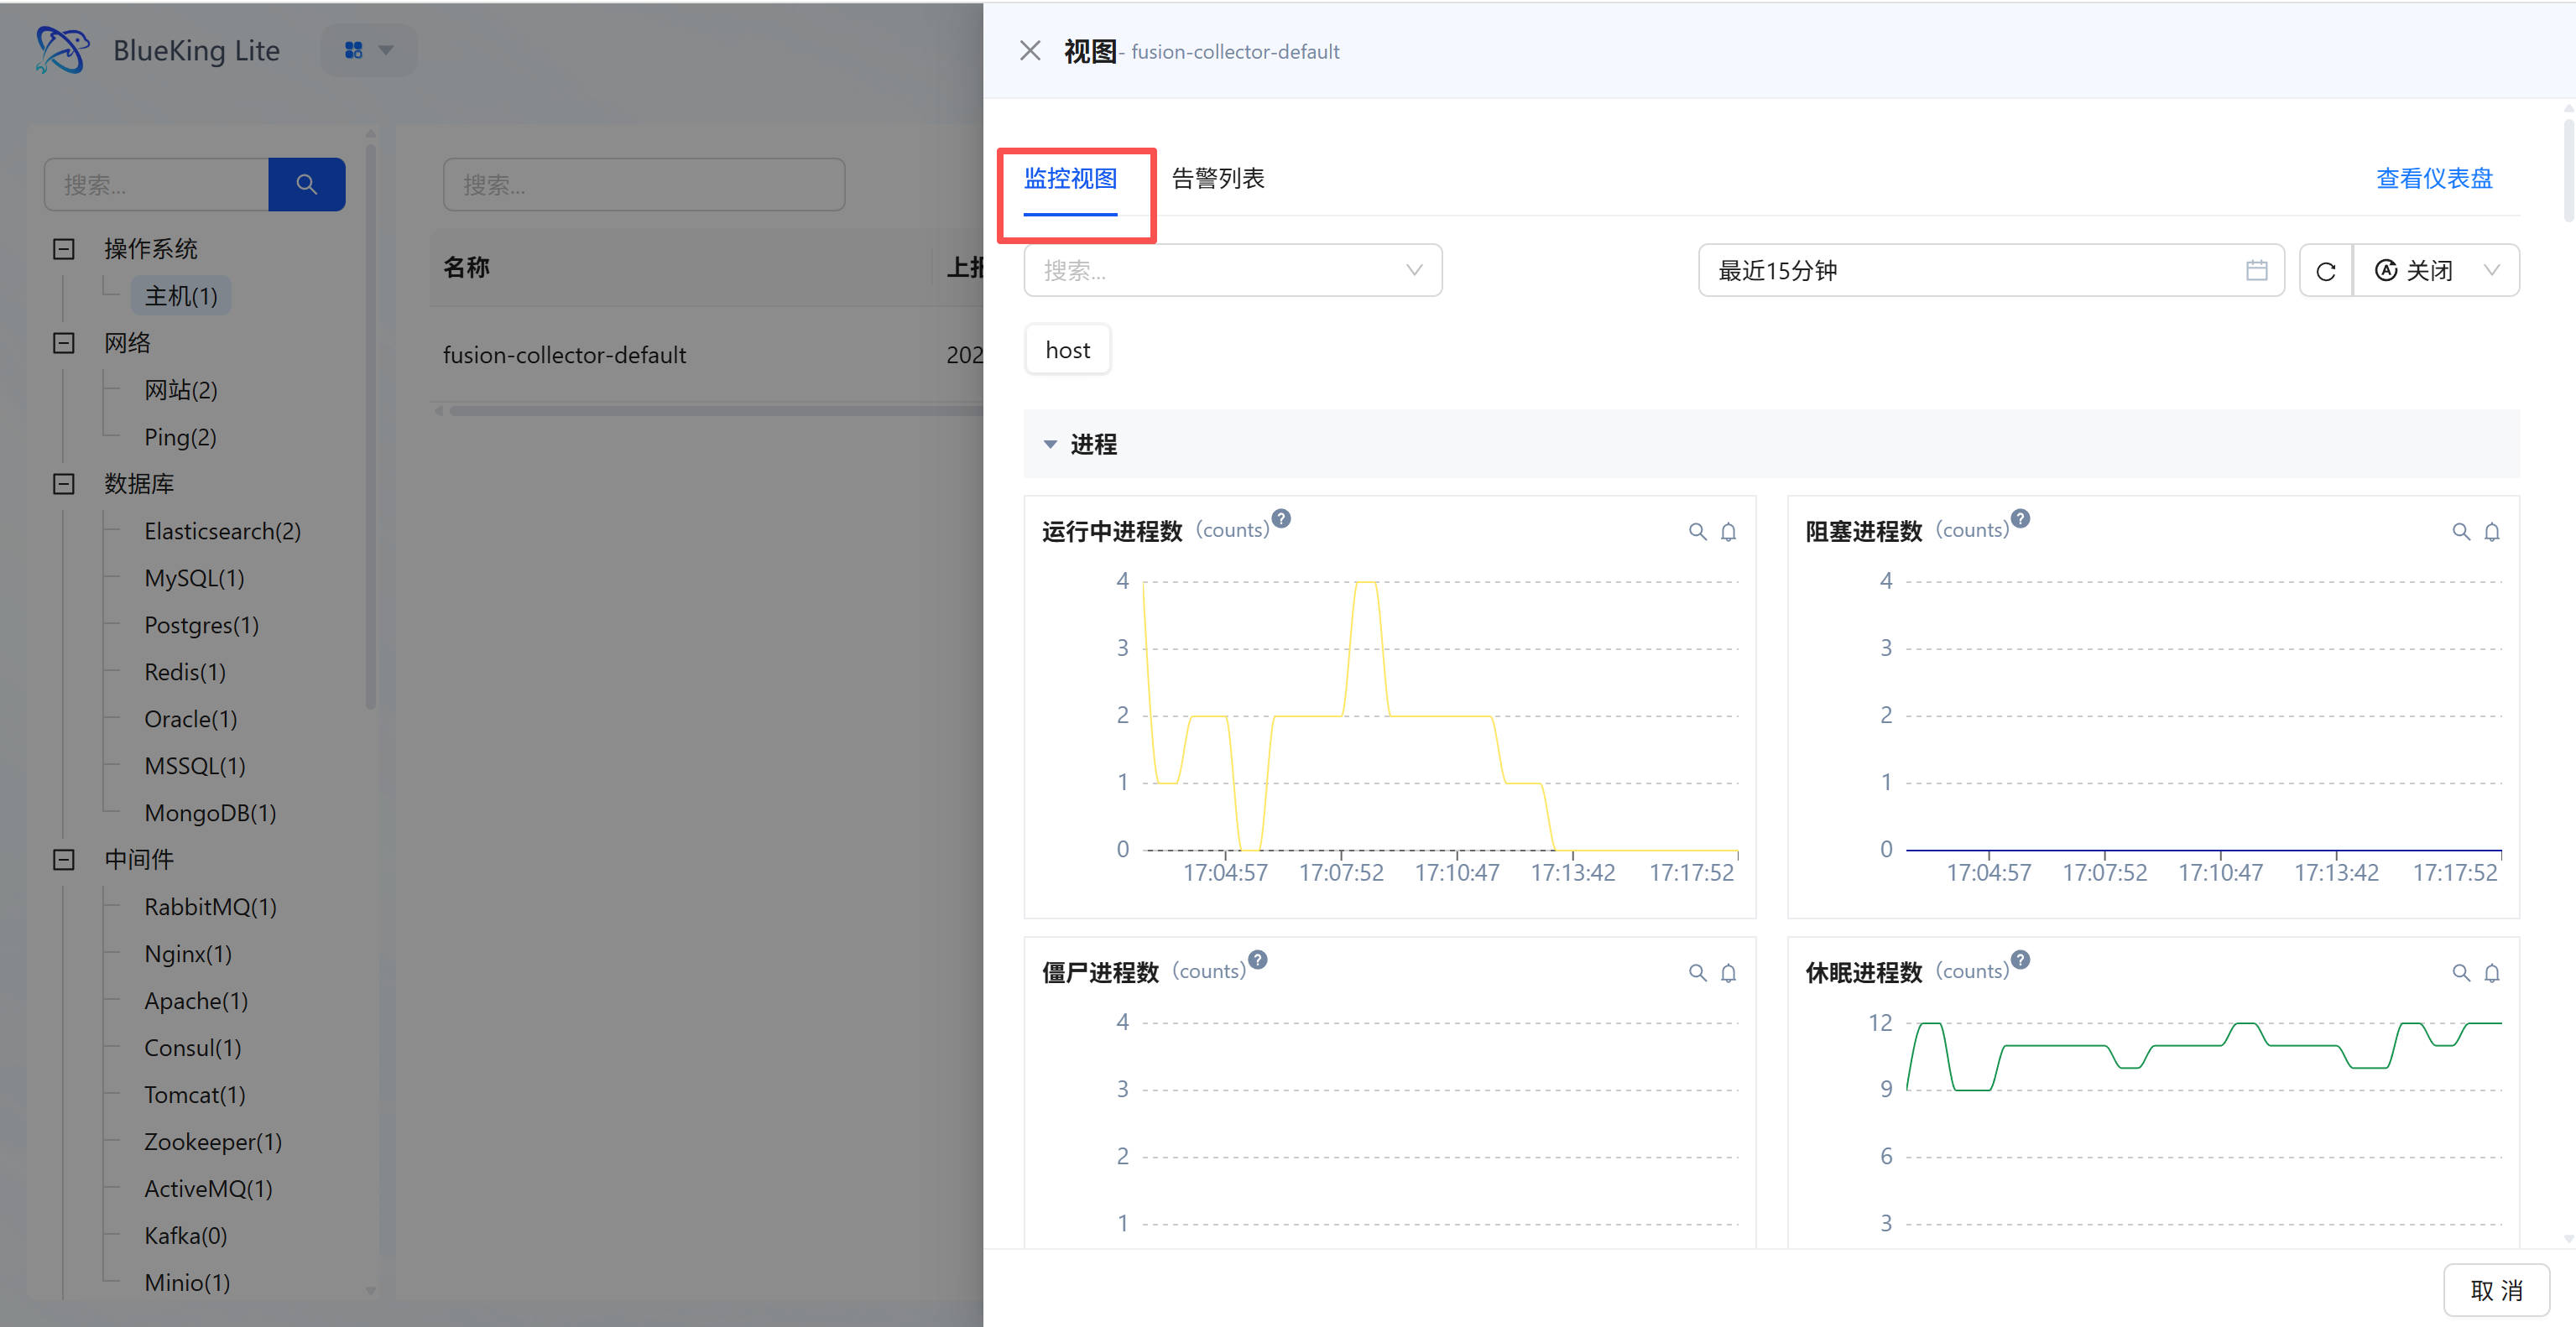
- Monitor View (MonitorView) Tab: Displays detailed metrics for the instance, presenting core performance indicator time trends via line charts;
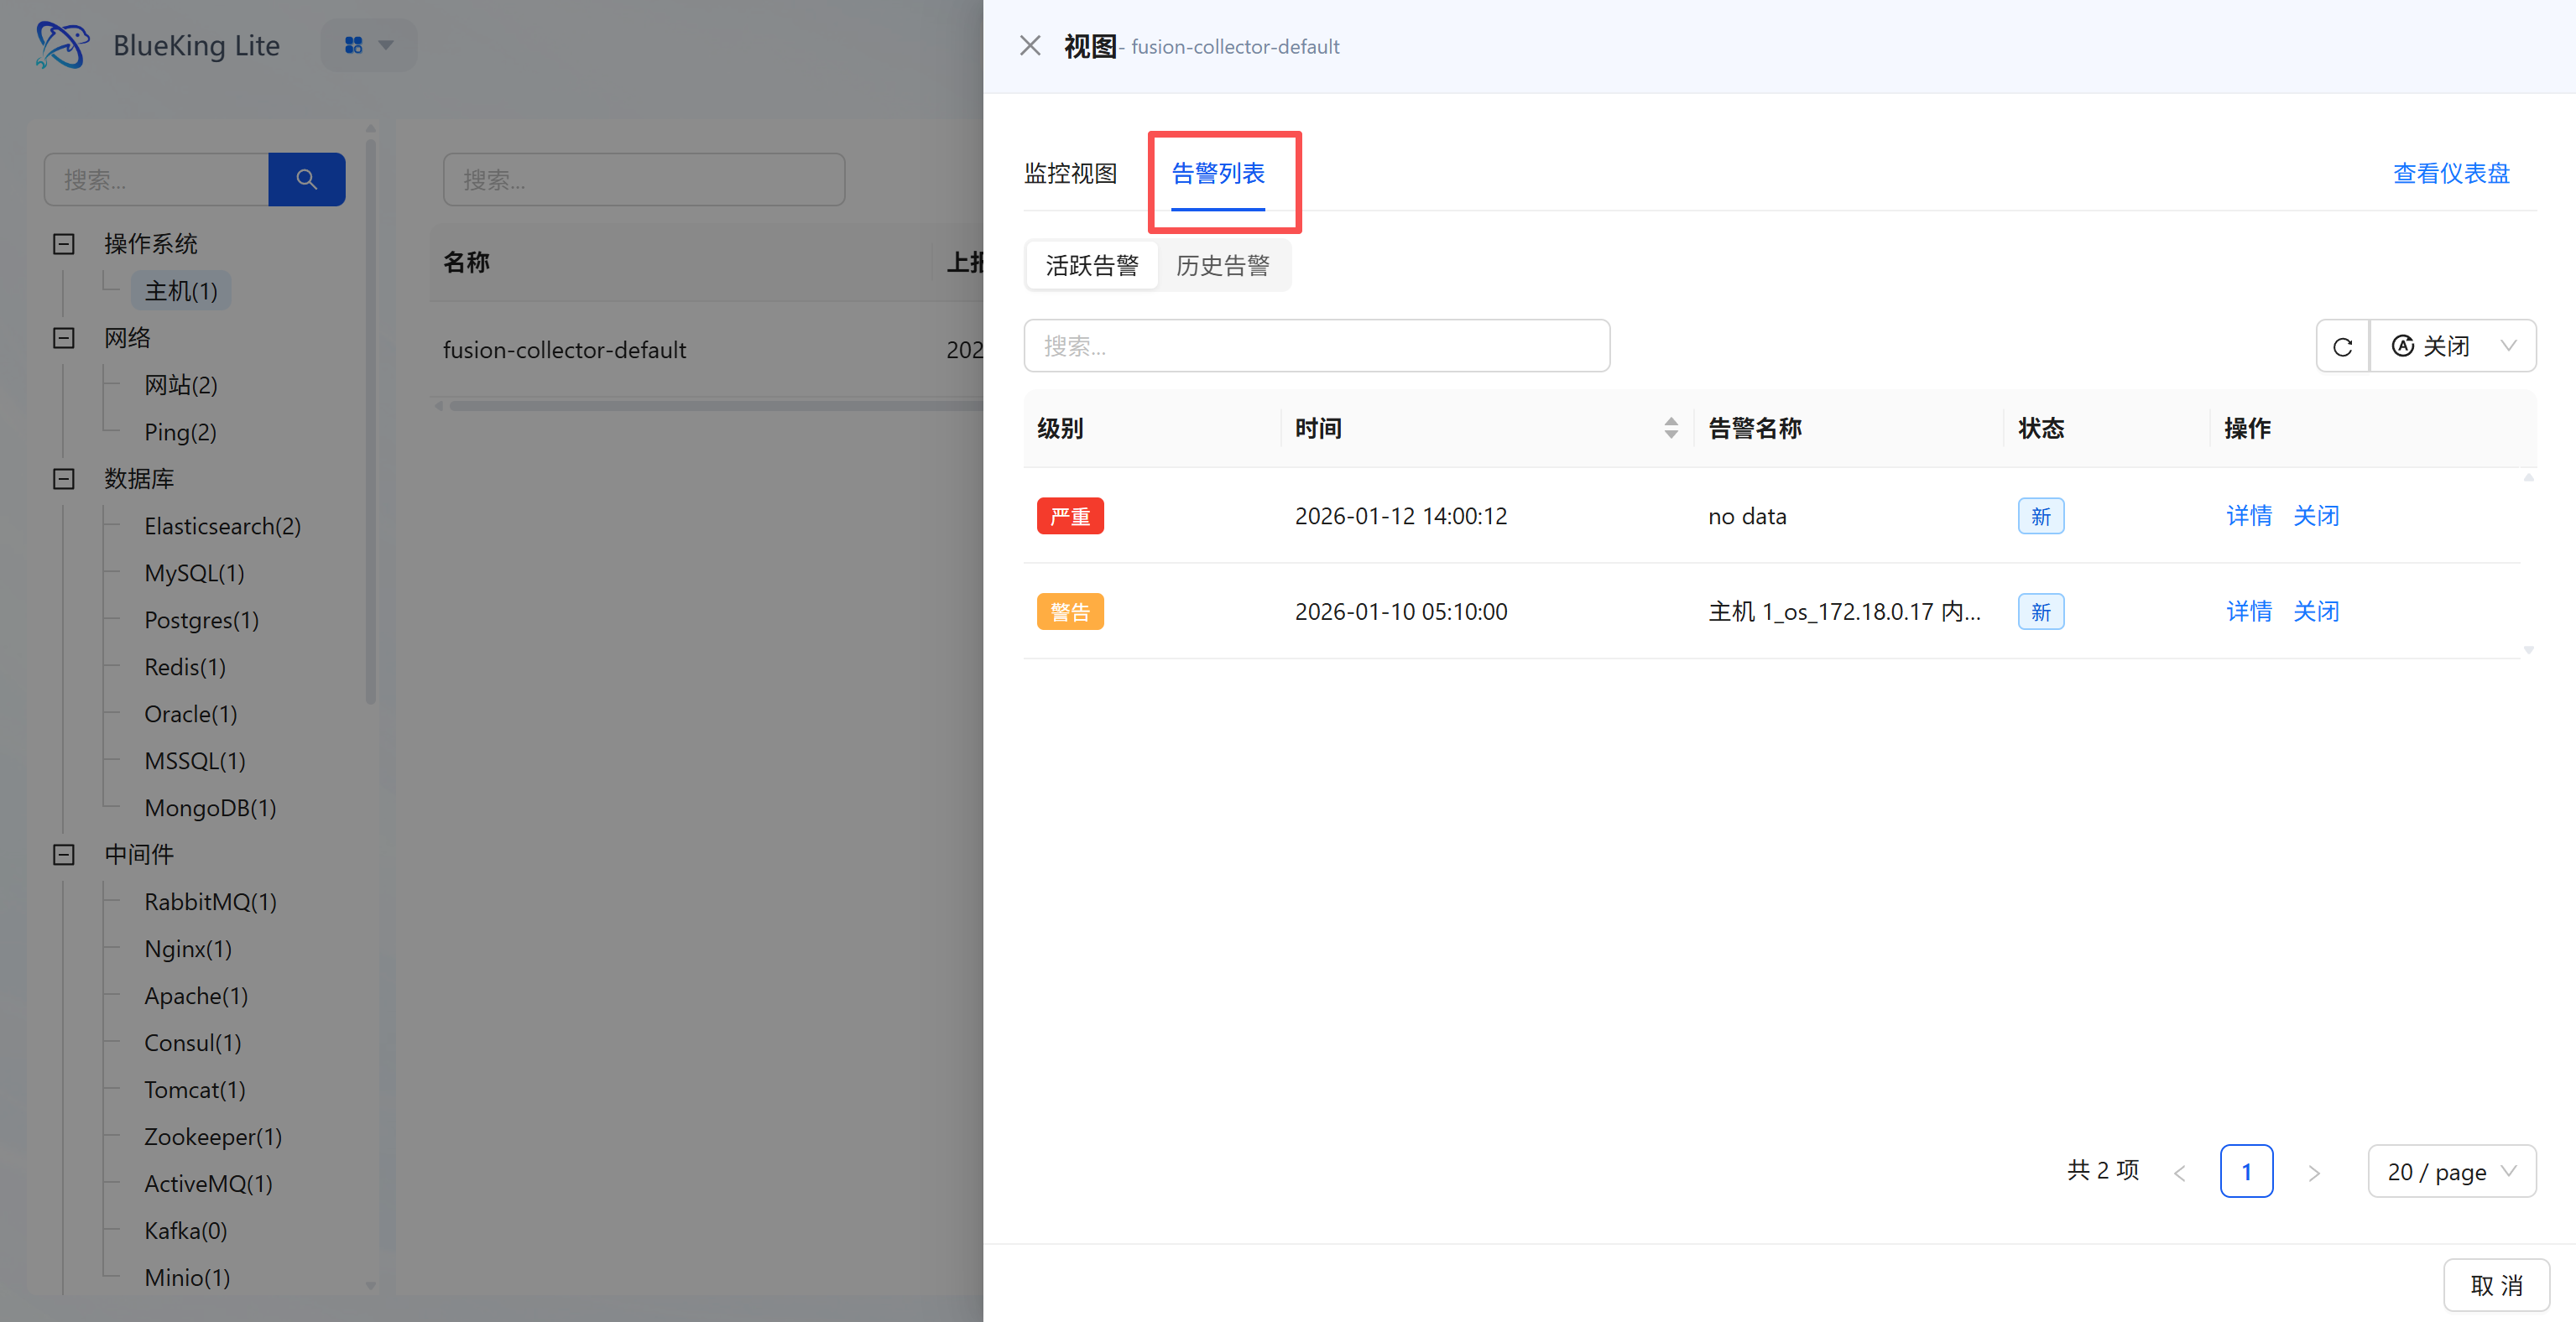
- Alert List (MonitorAlarm) Tab: Correlates alert records for the instance, supporting viewing of related active/historical alerts with alert "Level, Time, Name, Status" and providing operations.
- Detail Entry: The upper-right corner of the modal provides a "View Dashboard (Detail Page)" entry point.
1.3 Instance Detail Page (Detail Main Route)
A full metric panoramic view for a single resource (currently the detail main route independent page only exposes Metrics display; related alerts have been shifted left into the Instance View Modal for management).
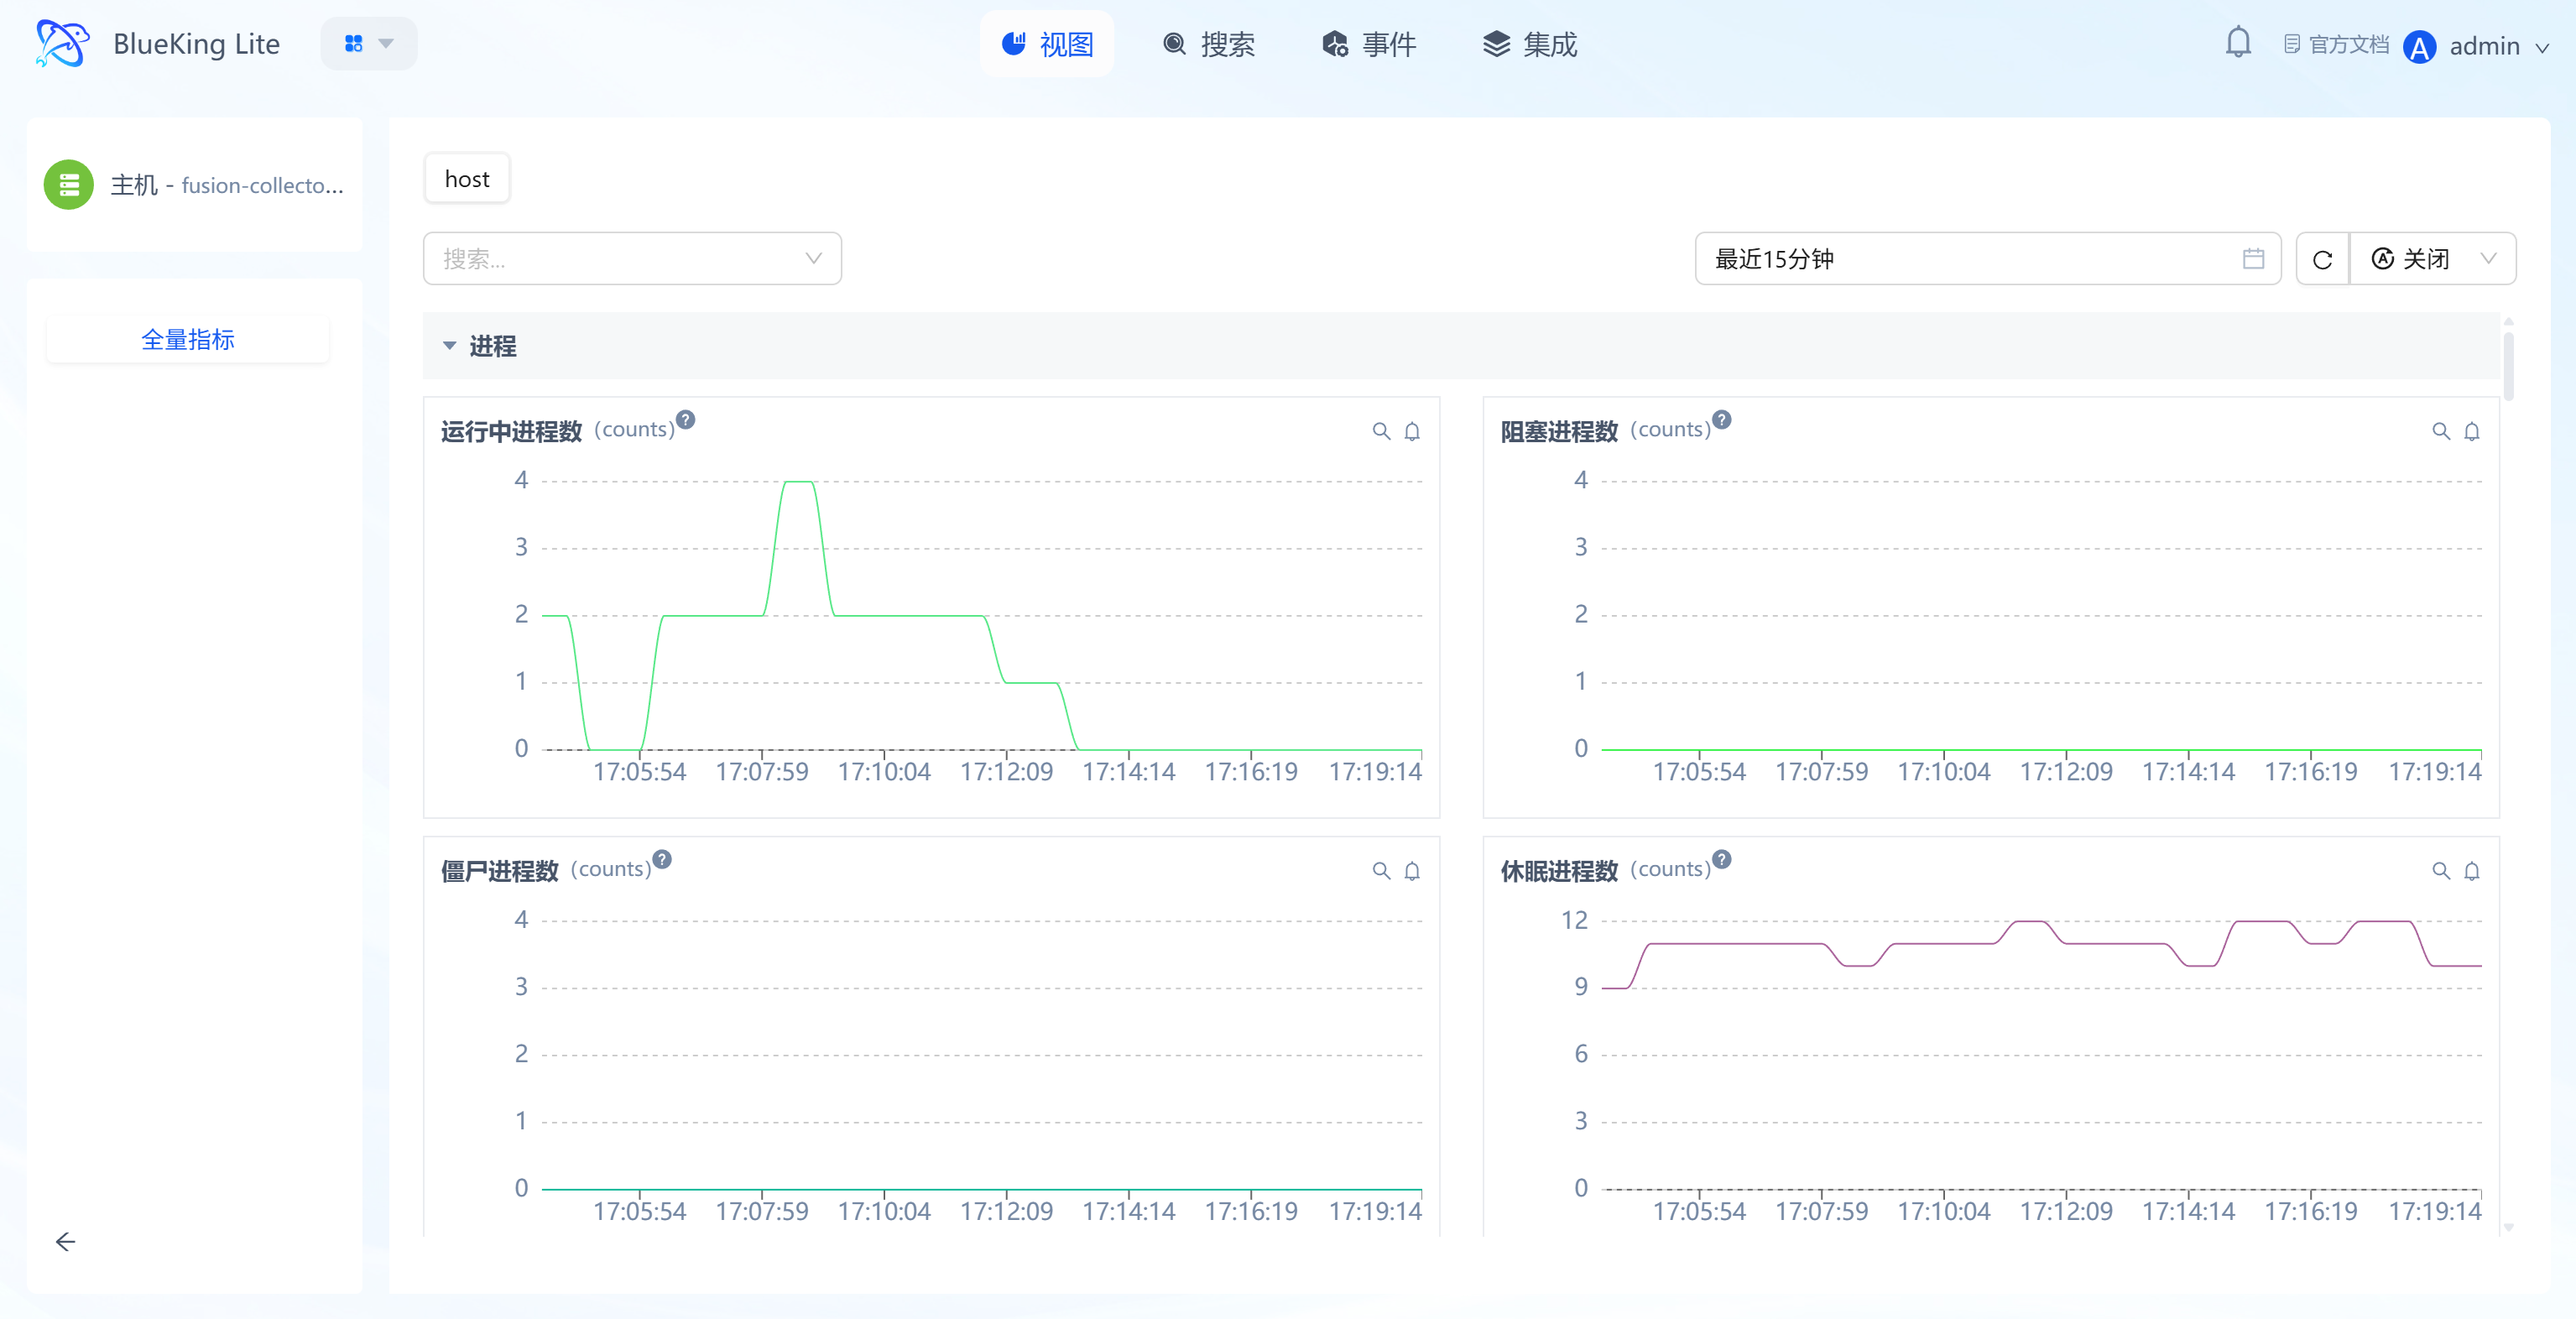
Core Capabilities
- Full Metric Categorized Display: Metrics are categorized by dimensions such as "Process, Disk IO, Memory" in collapsible sections; expanding reveals all monitoring metrics within that category;
- Multi-Chart Visualization: Each metric is presented as a time-trend line chart, supporting mouse hover to view "specific time, metric value, associated device (e.g., device name for Disk IO)";
- Flexible Time Range Selection: Supports selecting "Last 15 minutes / Custom time period" for quick lookback across different metric data periods;
- Metric Action Entry Points: Each chart provides "Search, Favorite" quick actions for subsequent rapid access to metrics of interest;
- Effective Plugin Filtering: The Metrics tab only displays collection templates actually onboarded for the instance. Active collection plugins show if configured (status may be offline); passive/API plugins appear only if they have recent data reports, avoiding empty metric groups without data.
1.4 Collection Interruption Interval Highlighting
When displaying long time ranges (e.g., hourly display of 30-day data), with short collection intervals (e.g., 1 minute), brief gaps in data reporting within a single display point (e.g., 5 minutes) may appear "connected" in downsampled line charts and go unnoticed. The platform detects collection interruptions via backend analysis and returns them as metadata, with the frontend rendering low-opacity colored backgrounds on corresponding x-axis ranges in line charts to guide users to narrow time ranges for further investigation.
Core Capabilities
- Collection Interval-Driven Detection: Breakpoint identification uses the instance's actual collection interval as the baseline (continuous unreported data exceeding
2 × collection intervalis identified as a breakpoint), preventing missed reports regardless of downsampling step size; - Interval Background Visualization: Breakpoint intervals render as low-opacity alert-colored backgrounds in line charts, positioned below data lines without obscuring threshold lines or event markers;
- Hover Tooltip Guidance: When hovering over a breakpoint interval, the Tooltip prompts "Collection interruption exists in this interval; narrow the time range for further investigation," guiding quick drill-down;
- Multi-View Consistency: Generic monitoring views (Recharts) and object dashboards (ECharts) share the same breakpoint metadata contract, maintaining consistent display behavior;
- Optional Enablement: Fine-grained detection is enabled only when monitoring views actively pass collection interval parameters; without them, existing line-connection behavior is preserved for backward compatibility.
2. Search
Search is the platform's ad-hoc analysis and data exploration hub, supporting free-combination queries across all metrics and cross-dimensional real-time aggregation. It meets the needs for deep drill-down and correlation analysis in non-predefined scenarios, providing multi-perspective data analysis support for operations personnel conducting evidence mining and fault boundary determination.
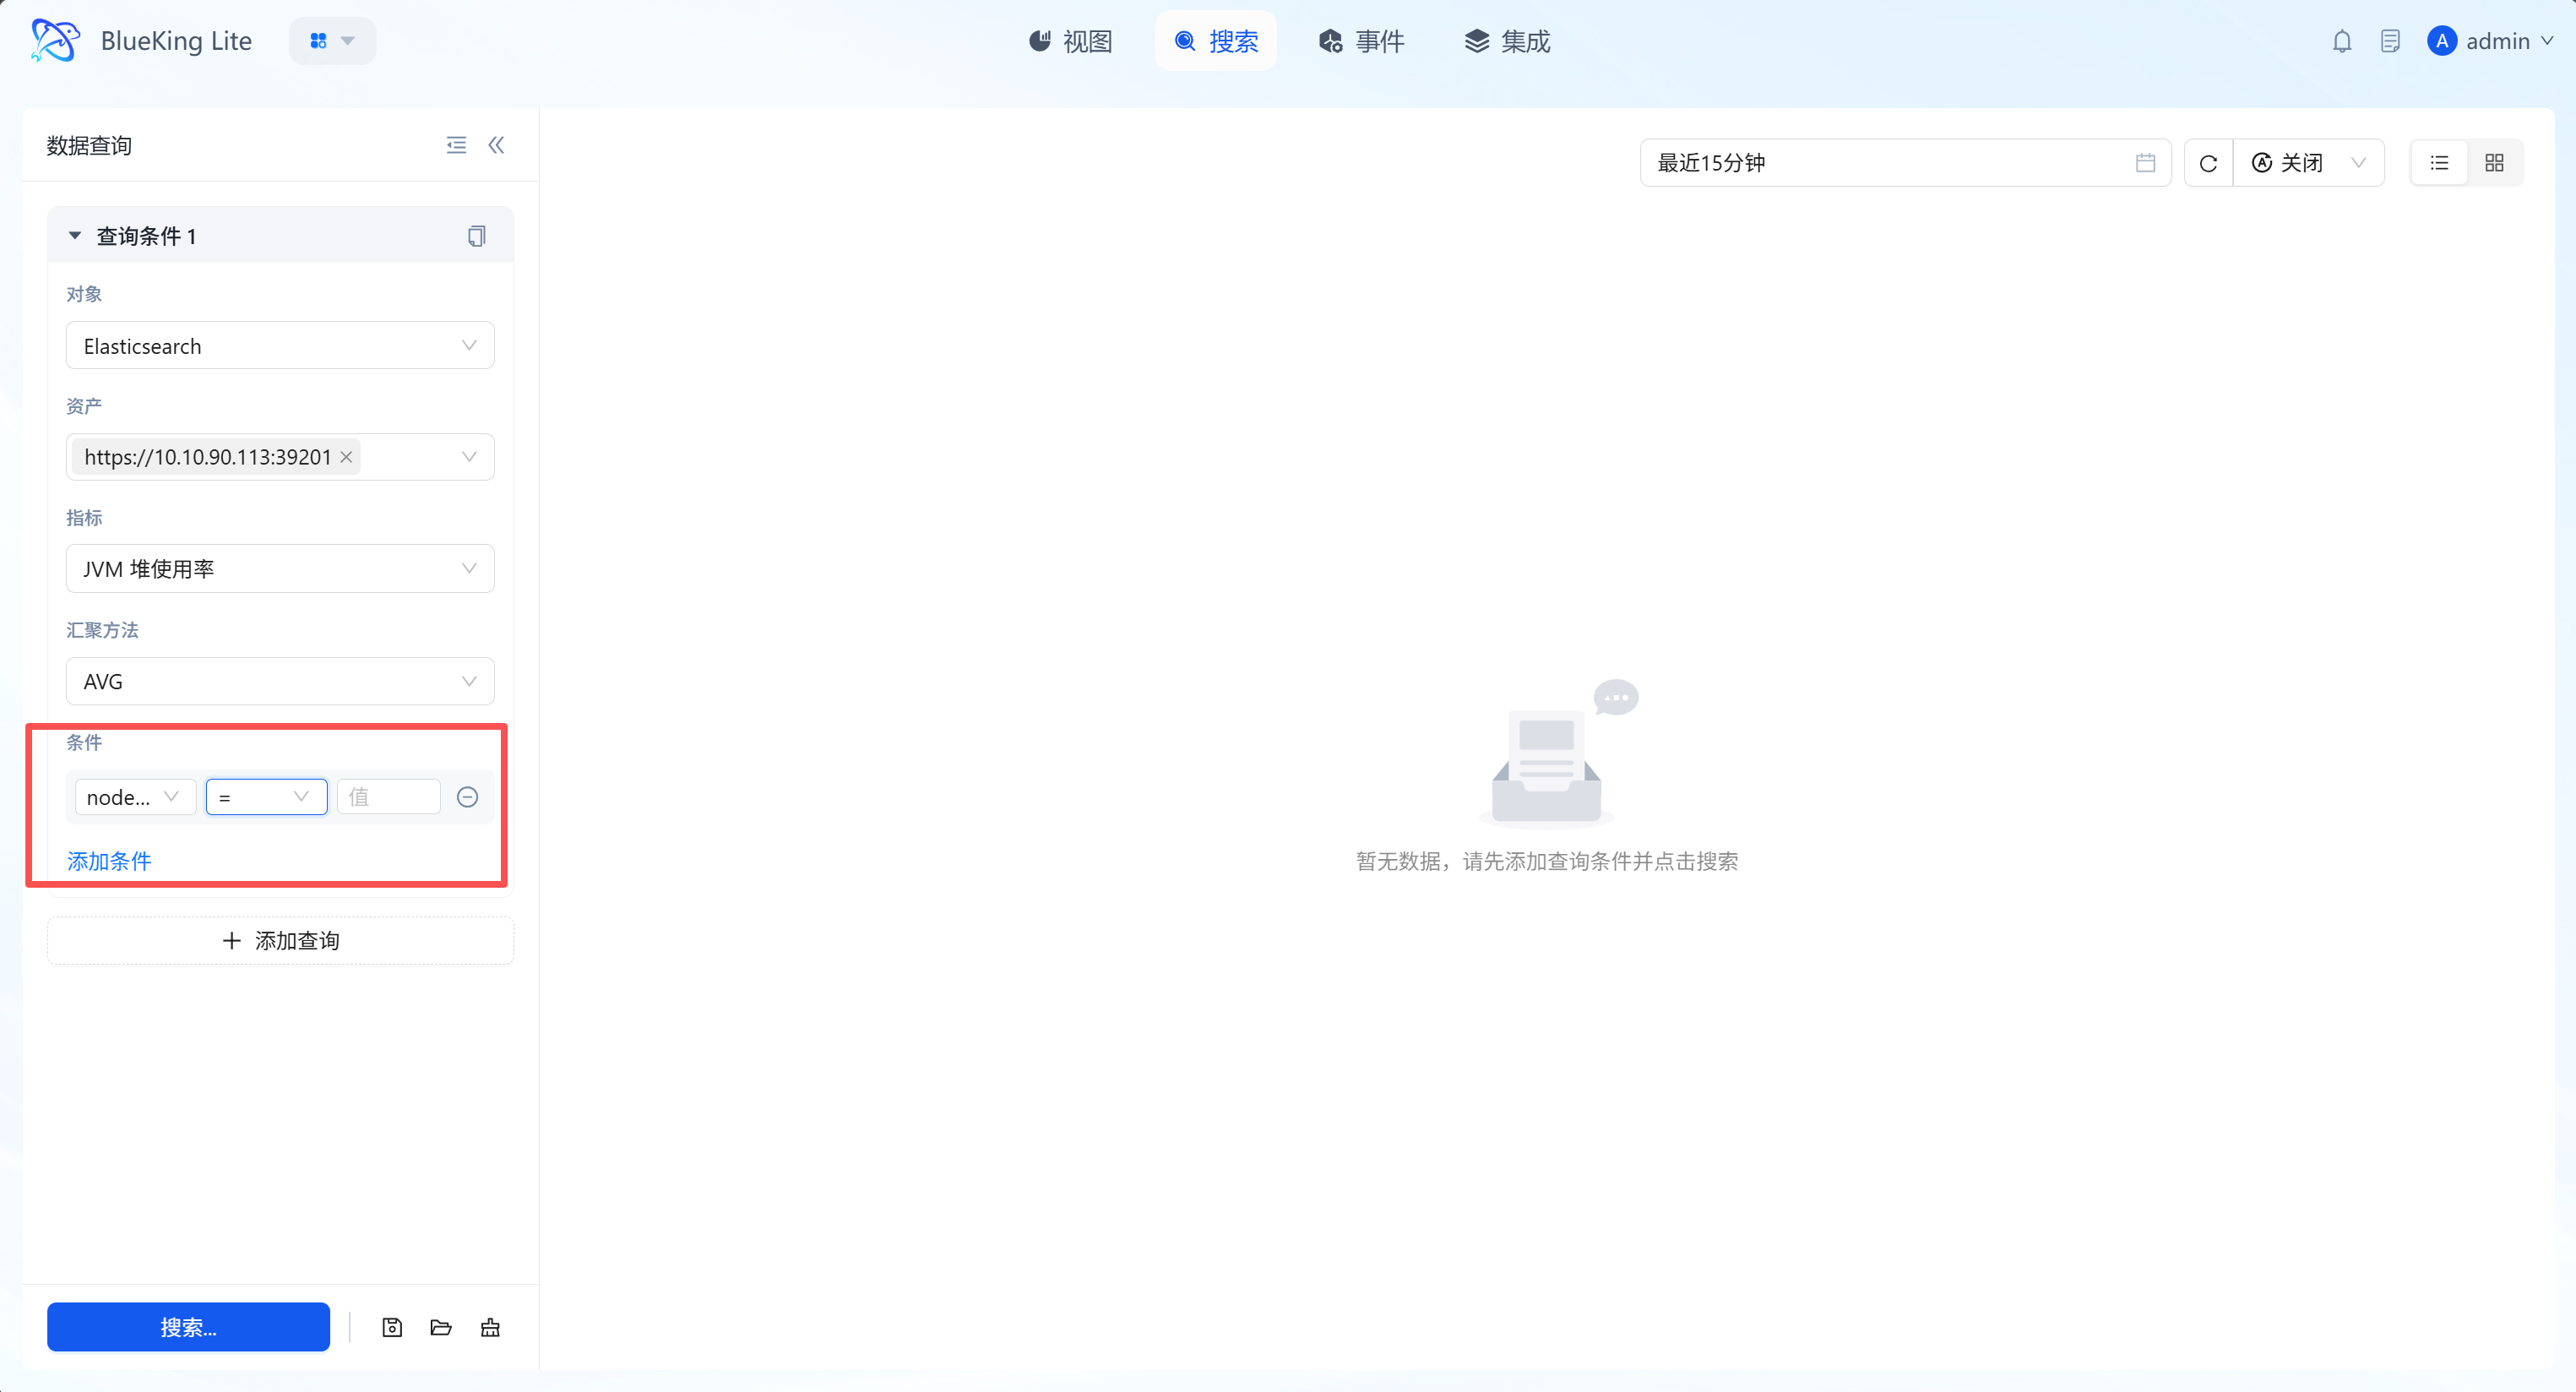
2.1 Structured Query Building
Through the left-side "Data Query" panel, users can build complex monitoring requests top-down, with the system automatically filtering available options based on context.
Interface Guide:
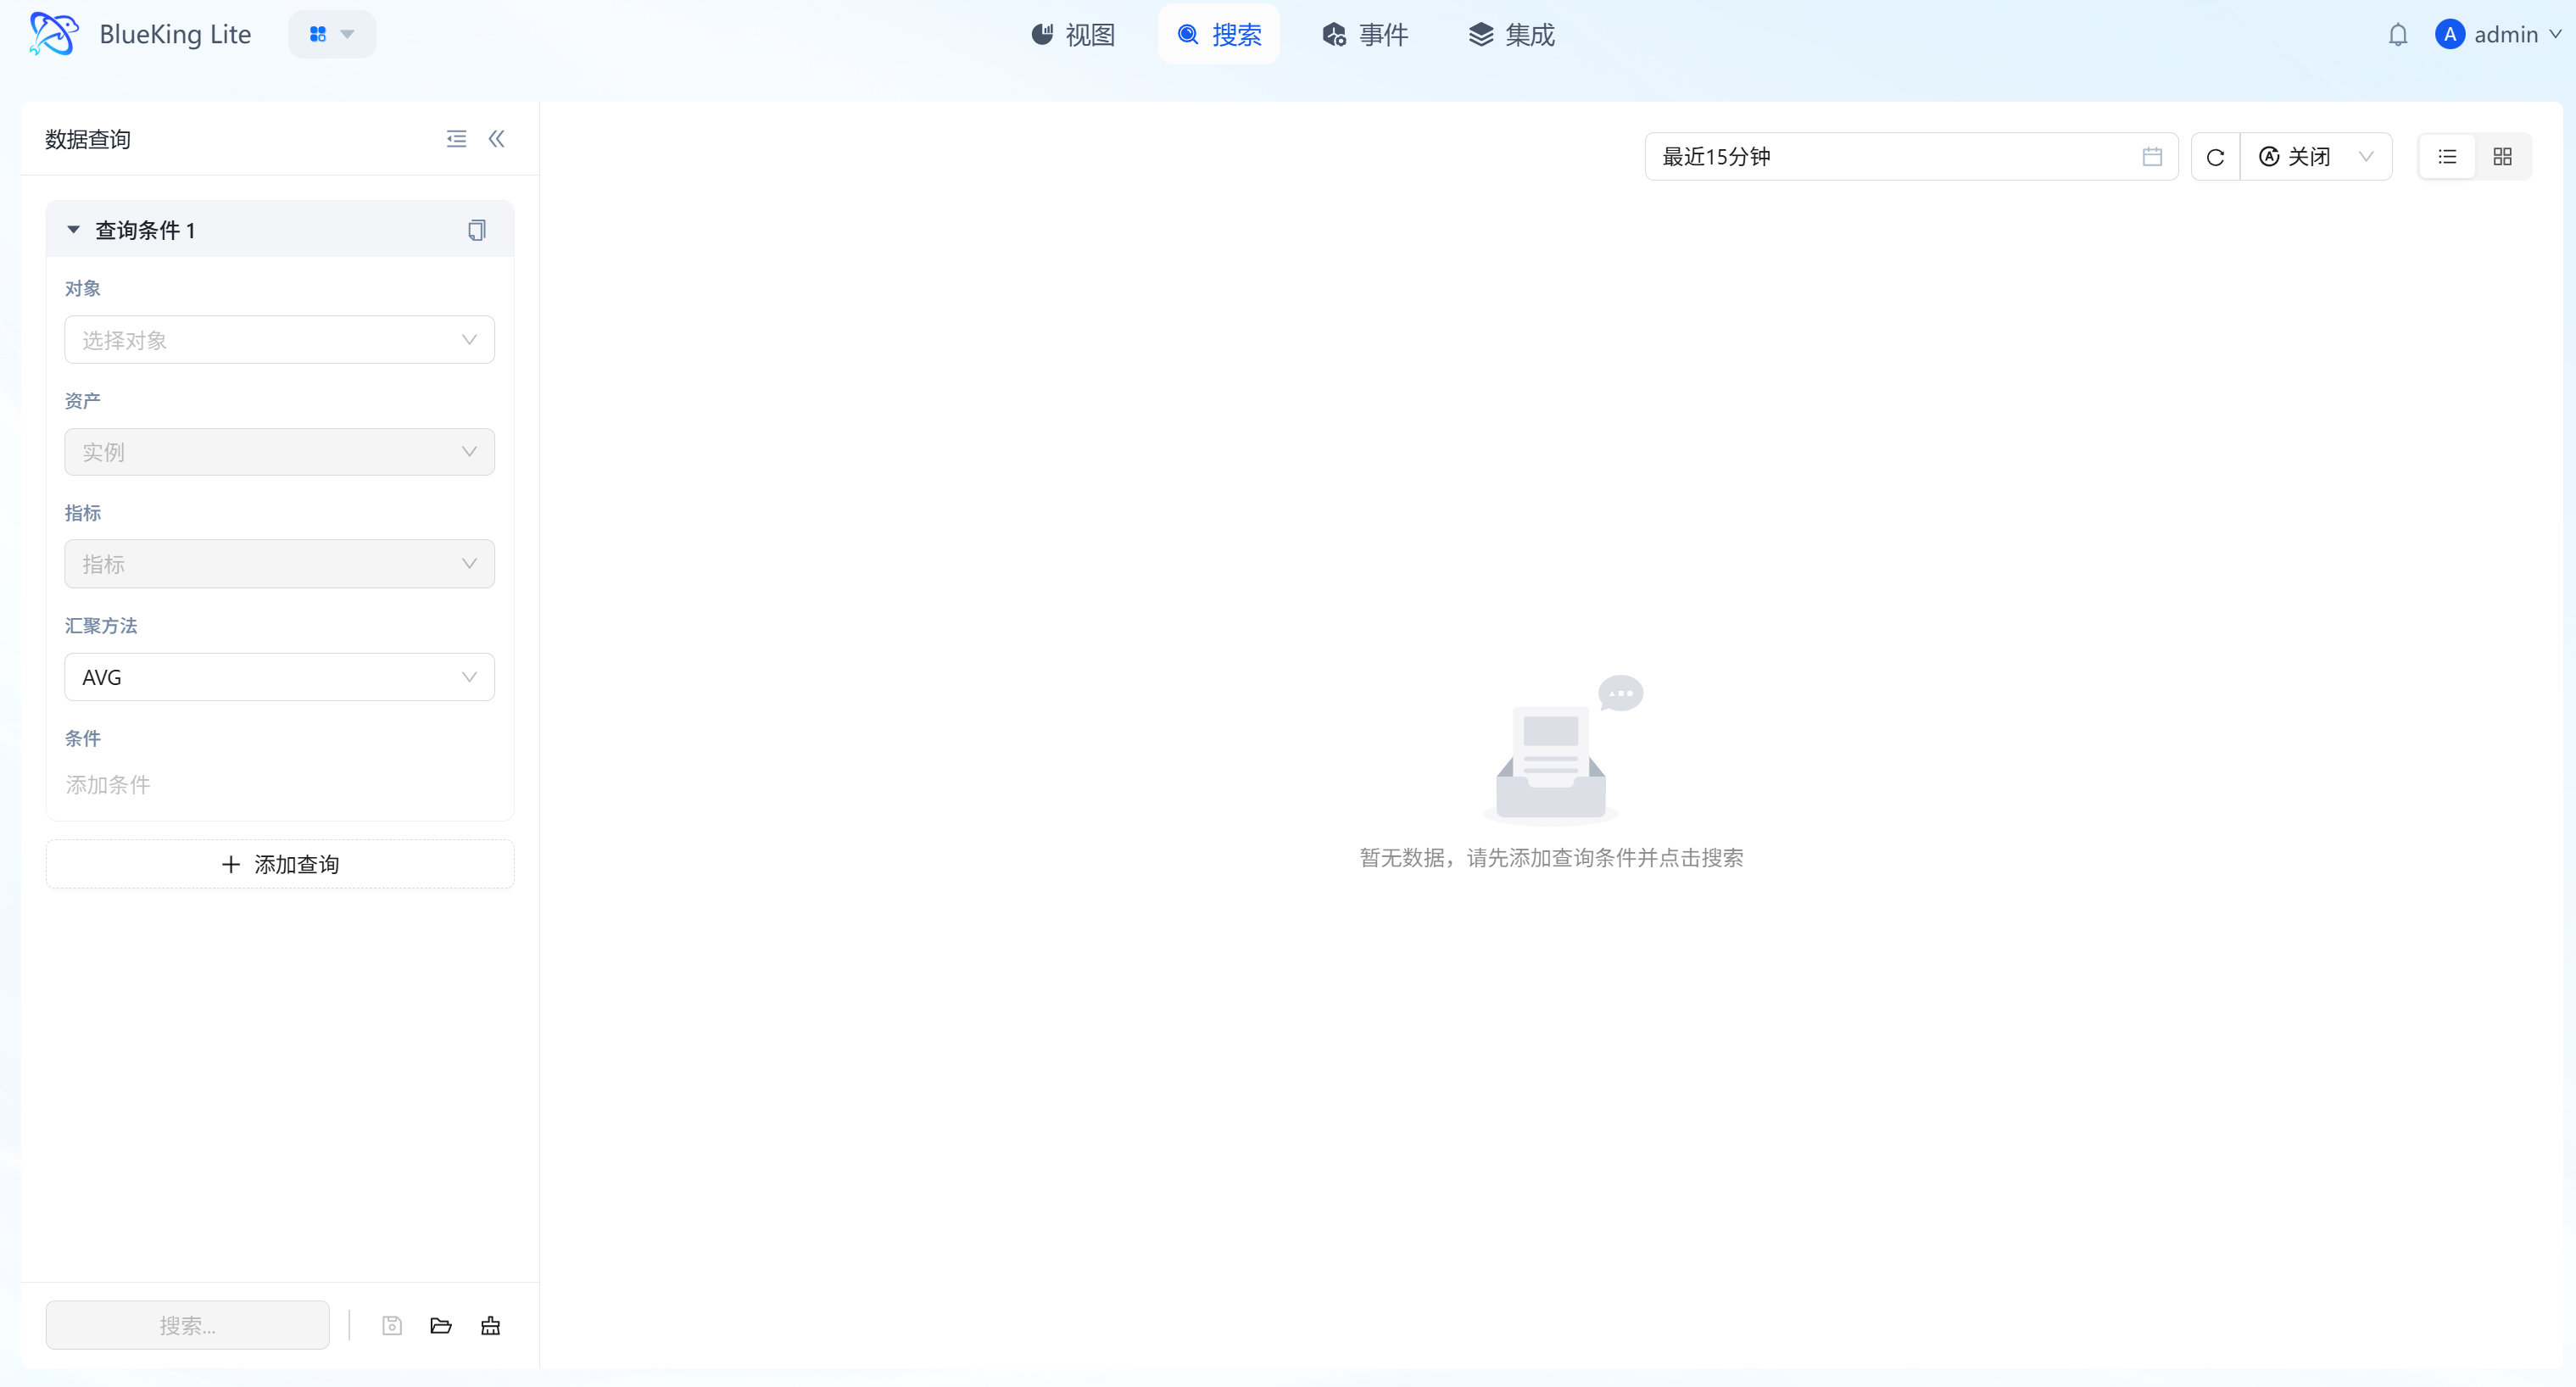
Core Capabilities
- Plugin-Aware Chained Selection: The query path is "Object → Plugin → Asset → Metric." When the selected object has multiple collection plugins (e.g., "Host" simultaneously has Host, Host Remote, Windows WMI plugins), the page automatically displays a plugin selector to prevent data source confusion from same-named metrics (e.g.,
cpu_usage_total) from different plugins; if an object has only a single plugin, it auto-selects without interrupting workflow; - Metric ID Precise Addressing: New query state uses the metric's database ID (not the metric name) as identity, completely eliminating data confusion from multi-plugin same-named metrics; previously saved queries and old links still load automatically through compatible parsing;
- Real-Time Aggregation Computation: Supports mathematical aggregation of data within selected periods including AVG (Average), MAX (Maximum), MIN (Minimum), SUM (Sum), meeting different scenarios from resource load analysis to business volume statistics.
- Query Configuration Reuse: Supports one-click query condition copying for quickly building comparison views of similar metrics.
2.2 Dimension Filtering and Precise Cleansing
Building upon basic queries, the "Conditions" function enables fine-grained filtering on metric-associated labels (Labels/Tags) to eliminate data noise. It also supports multi-group condition (AND condition) intersection combinations for higher-precision matching.
Interface Guide:
Core Capabilities
- Fine-Grained Data Slicing: Filter by metric attributes (such as K8s
pod_nameor hostdevice) to observe only the performance of specific subsets. - Logical Operator Support: Provides standard three-part configuration of "Dimension Key, Operator (
=,!=,in,not in, etc.), Dimension Value." - Multi-Condition Joint Query: Supports adding multiple filter AND conditions, achieving precise "dehydration" and pinpointing of massive monitoring data through flexible matching logic.
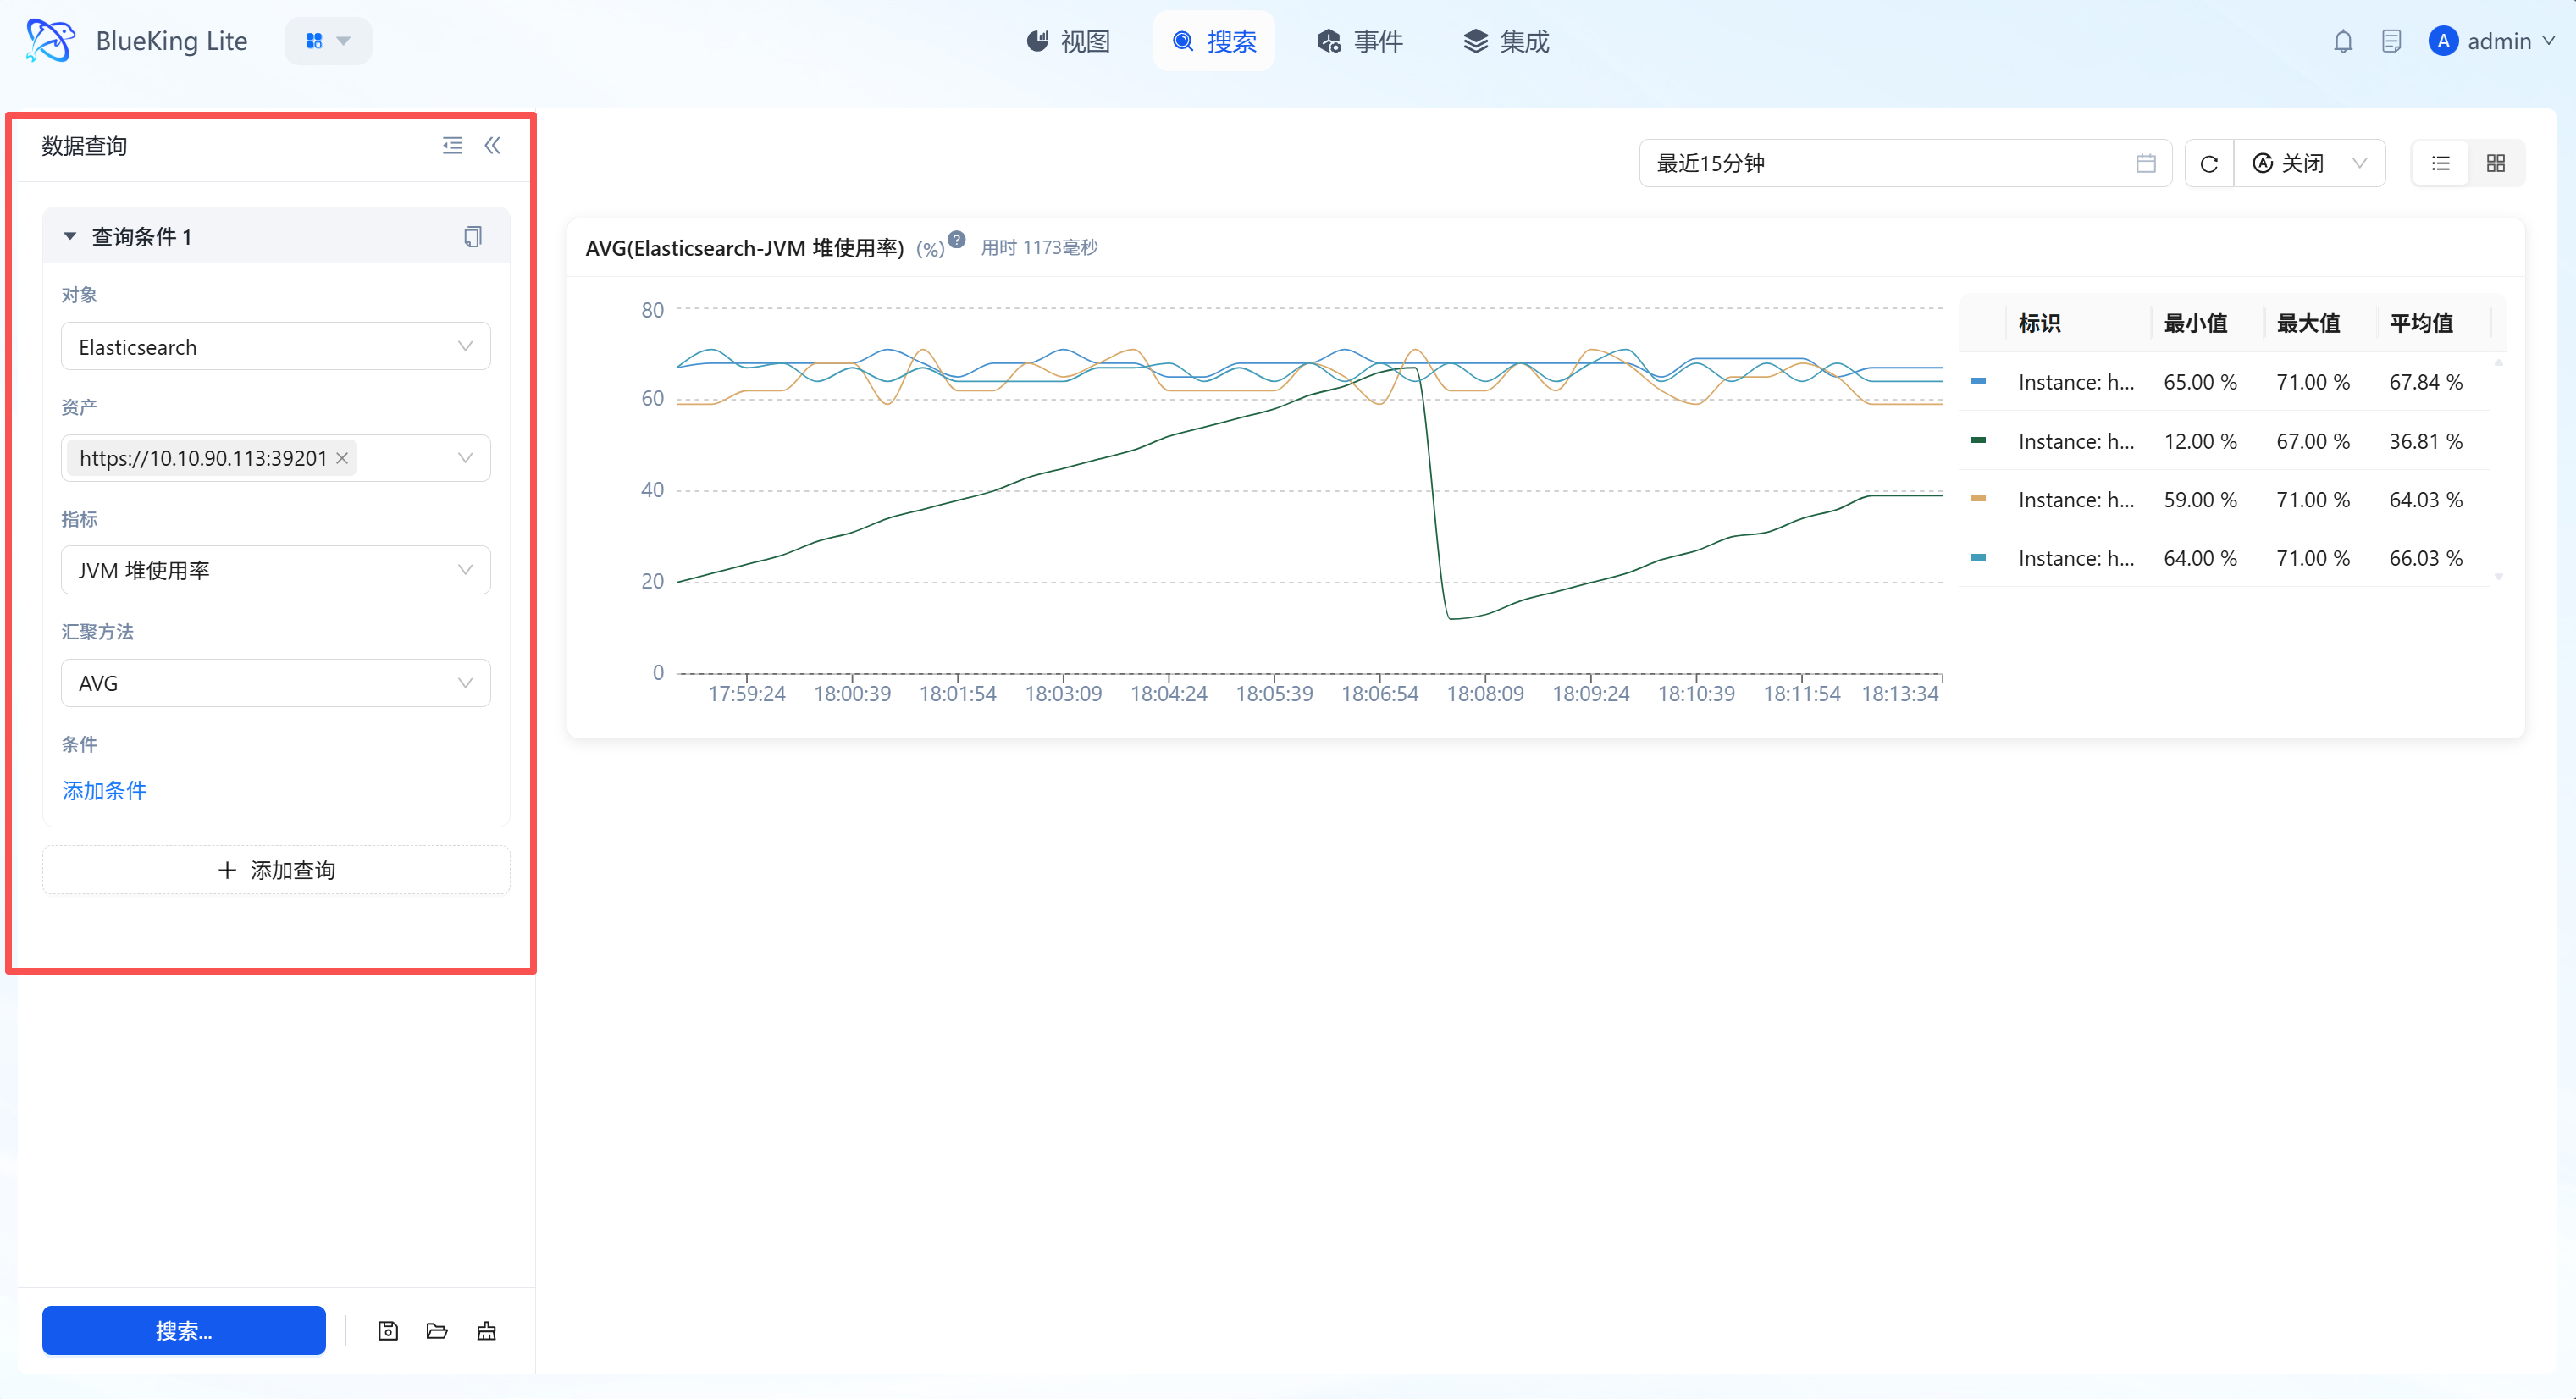
2.3 Intelligent Visualization and Dimension Tables
The system automatically renders high-precision time-series line charts (trend charts) based on query results, accompanied by real-time statistical summary data (dimension tables).
Interface Guide:
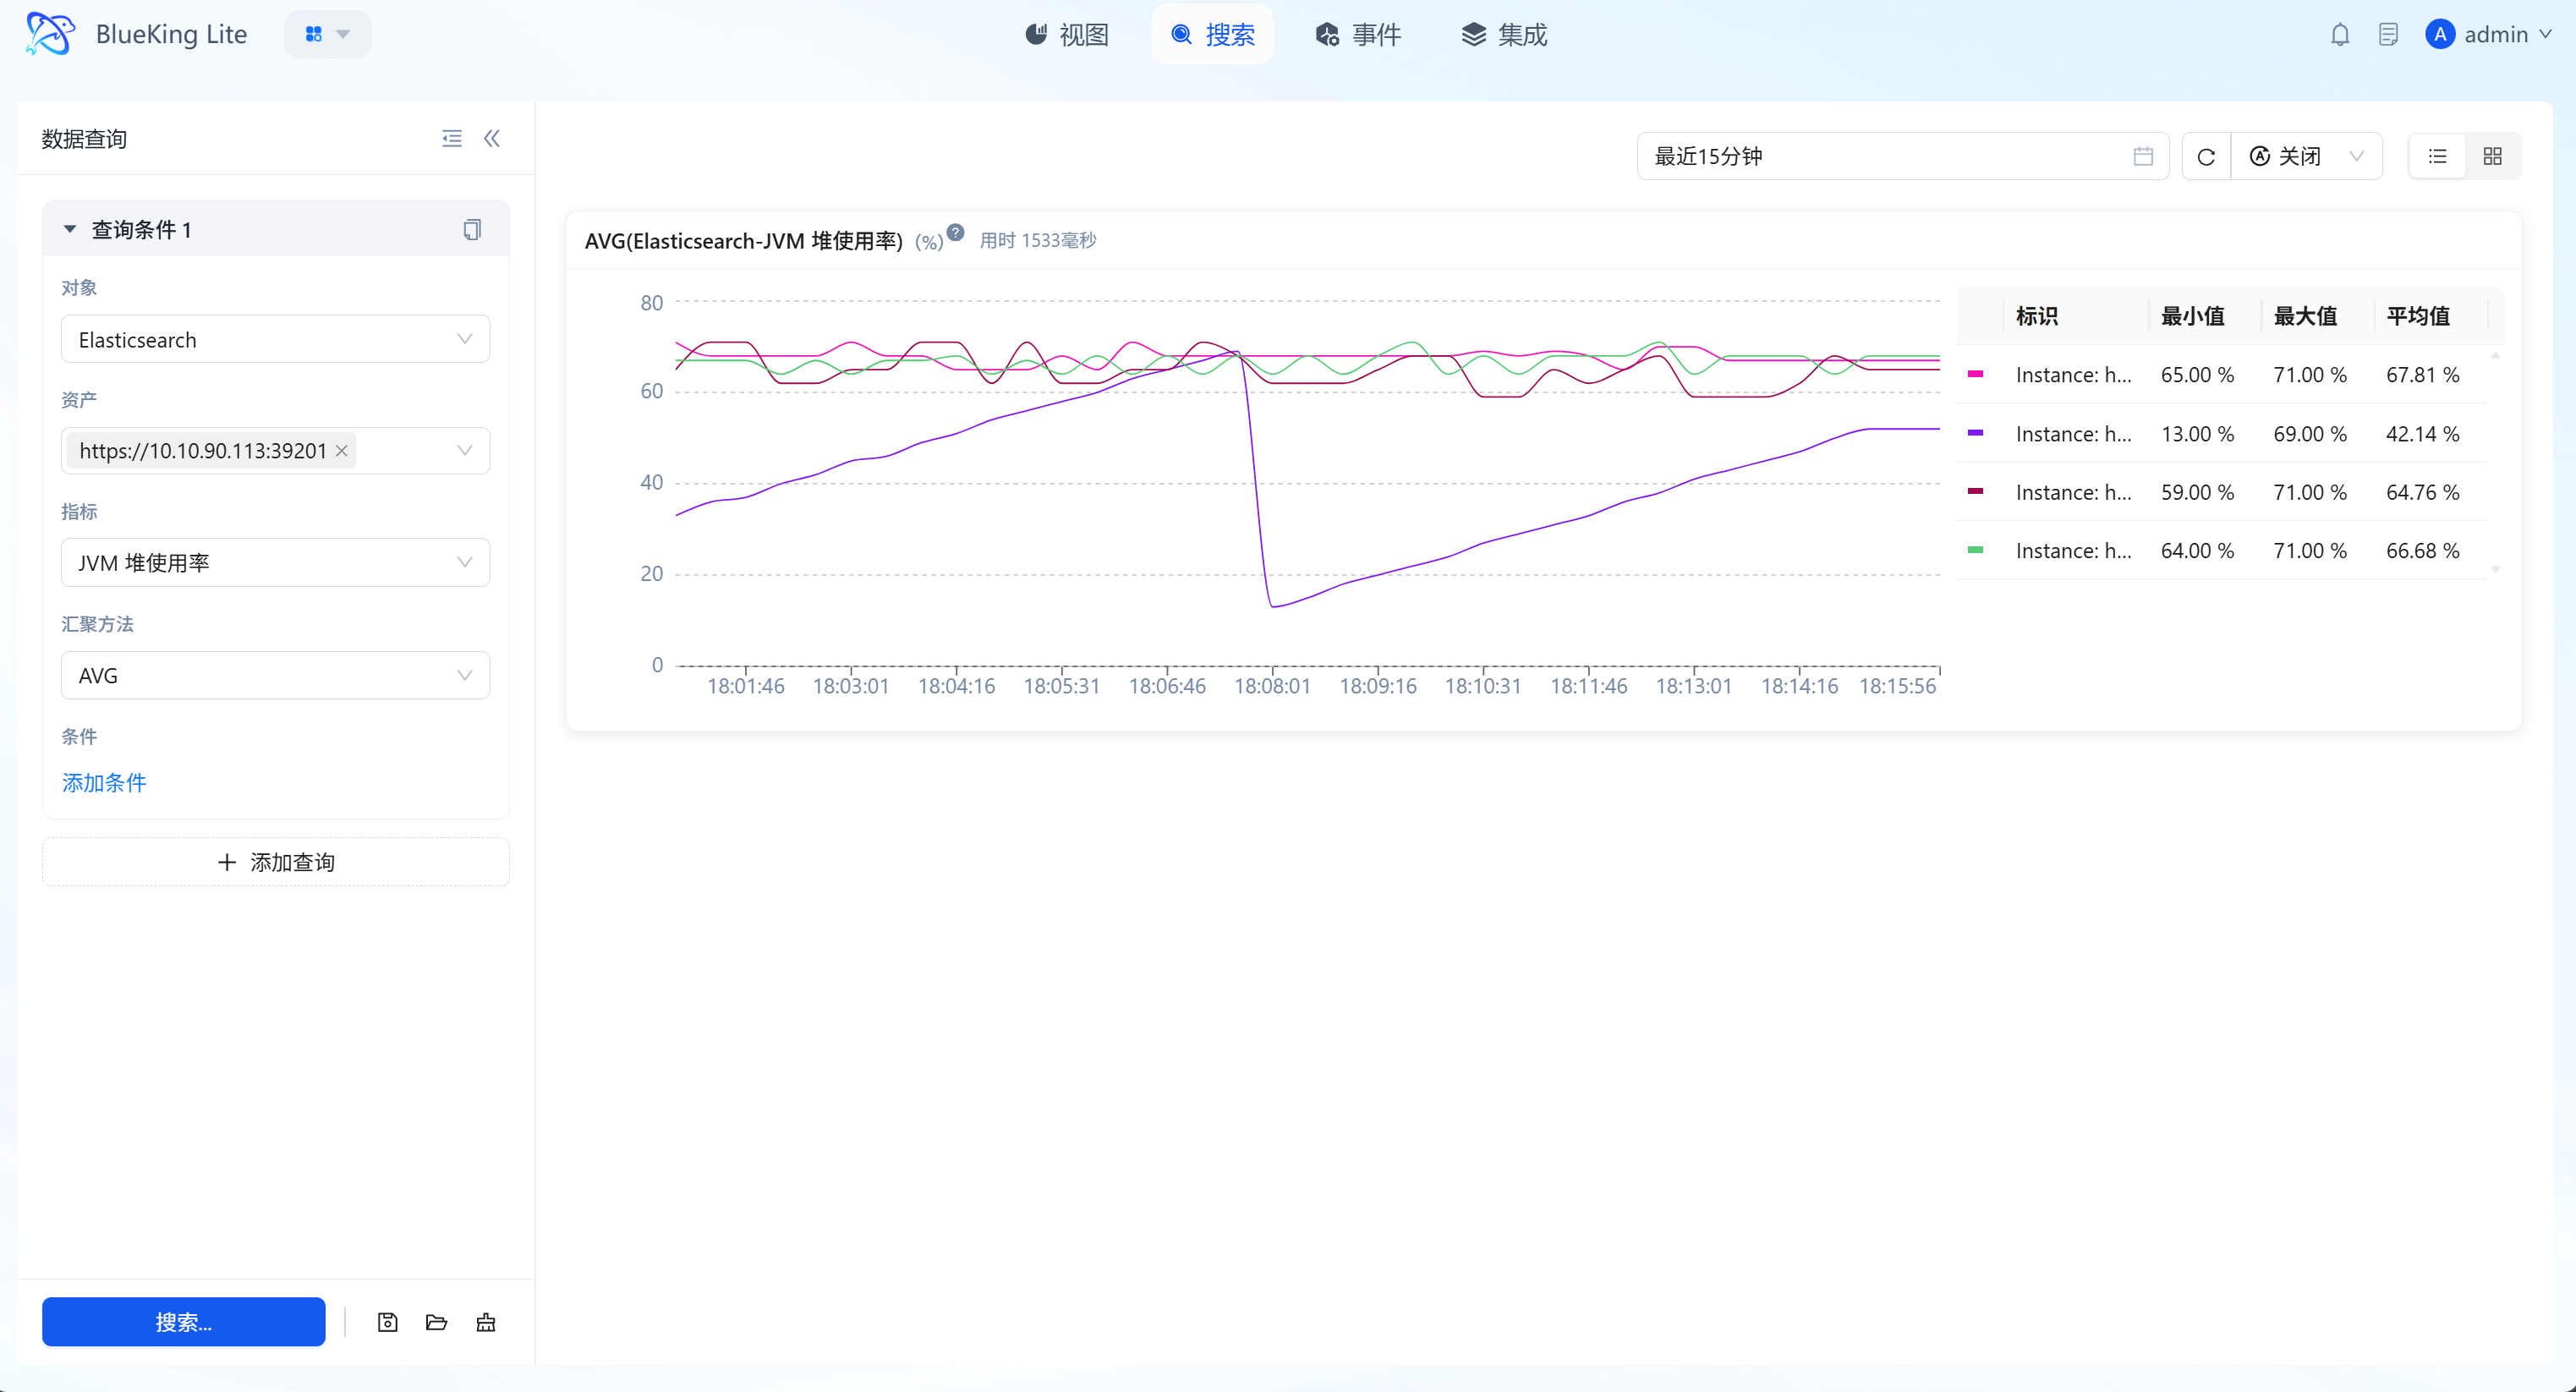
Core Capabilities
- Multi-Instance Curves on Screen: Supports displaying metric fluctuations of multiple instances (e.g., CPU of multiple hosts) simultaneously in one trend chart, facilitating outlier identification.
- Dimension Table Statistics: Below or beside the chart, real-time calculations of "Maximum, Minimum, Average" across different dimensions within the current time window quantify resource operating ranges.
- Interactive Probe: Mouse hover triggers a data probe for viewing precise readings at specific time points.
2.4 Multiple Query Groups and Management (Save/Load)
Supports parallel multiple query tasks, flexible dashboard layouts, and named query bookmark management for analyzing correlations between different metrics or solidifying daily high-priority exploration patterns.
Interface Guide:
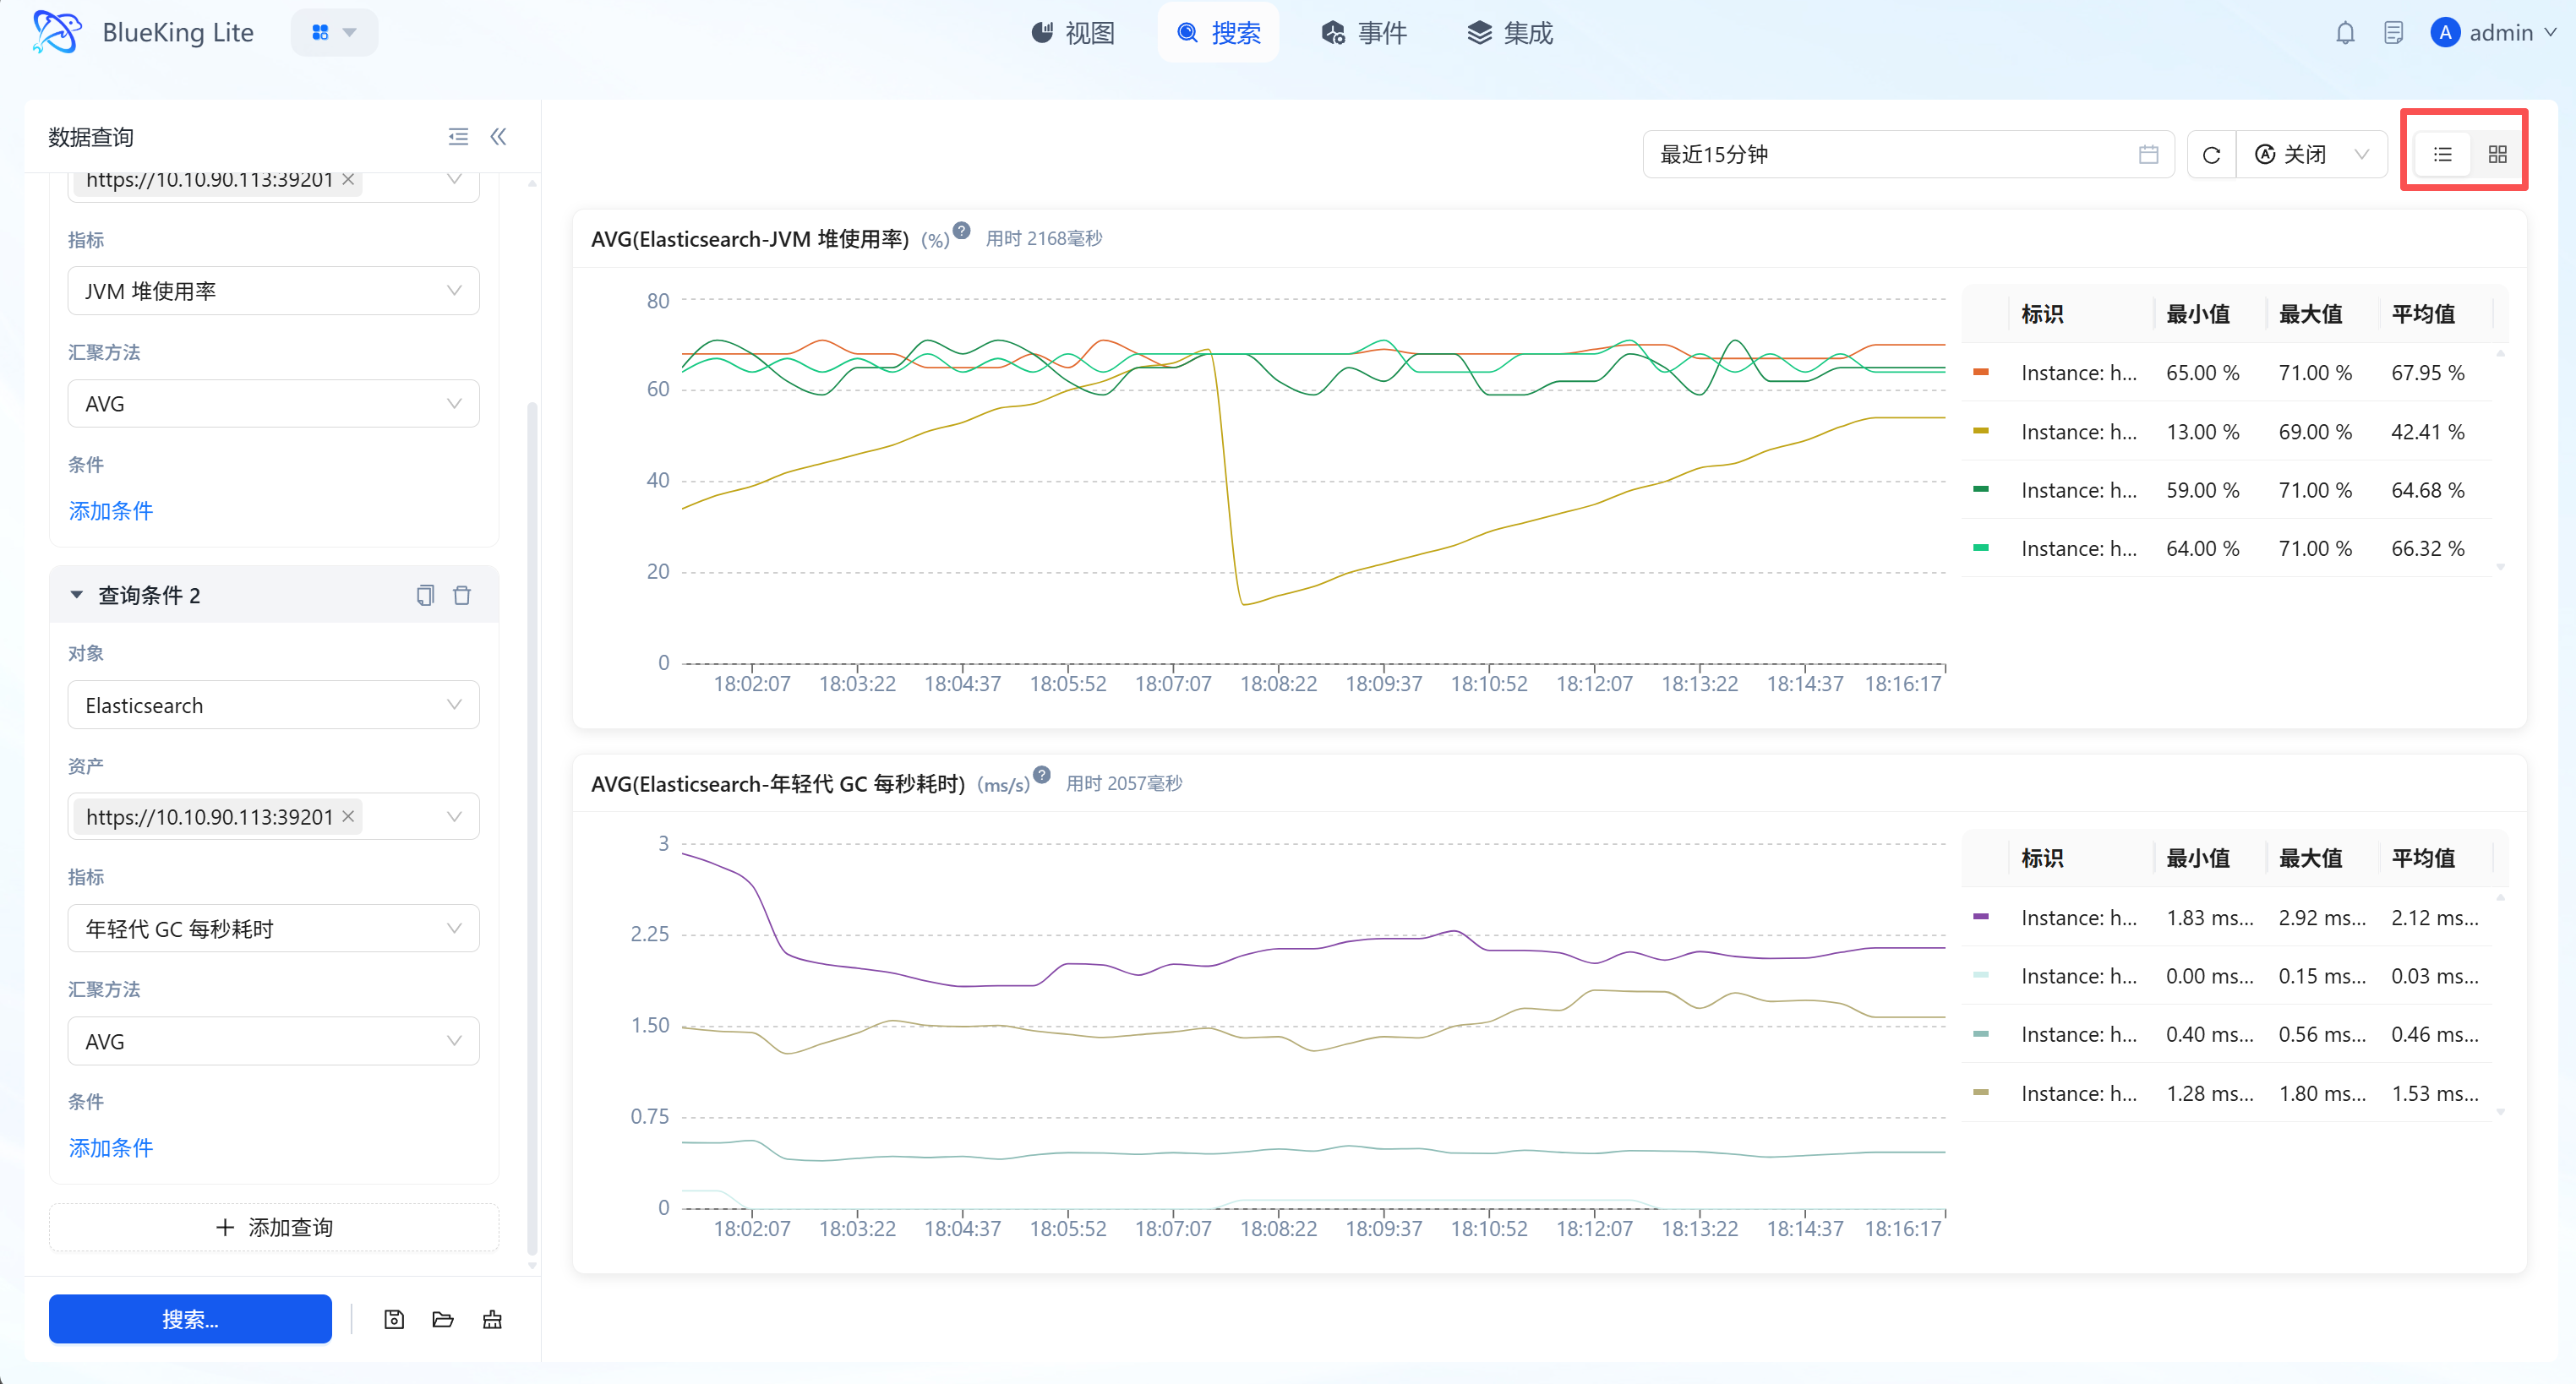
Core Capabilities
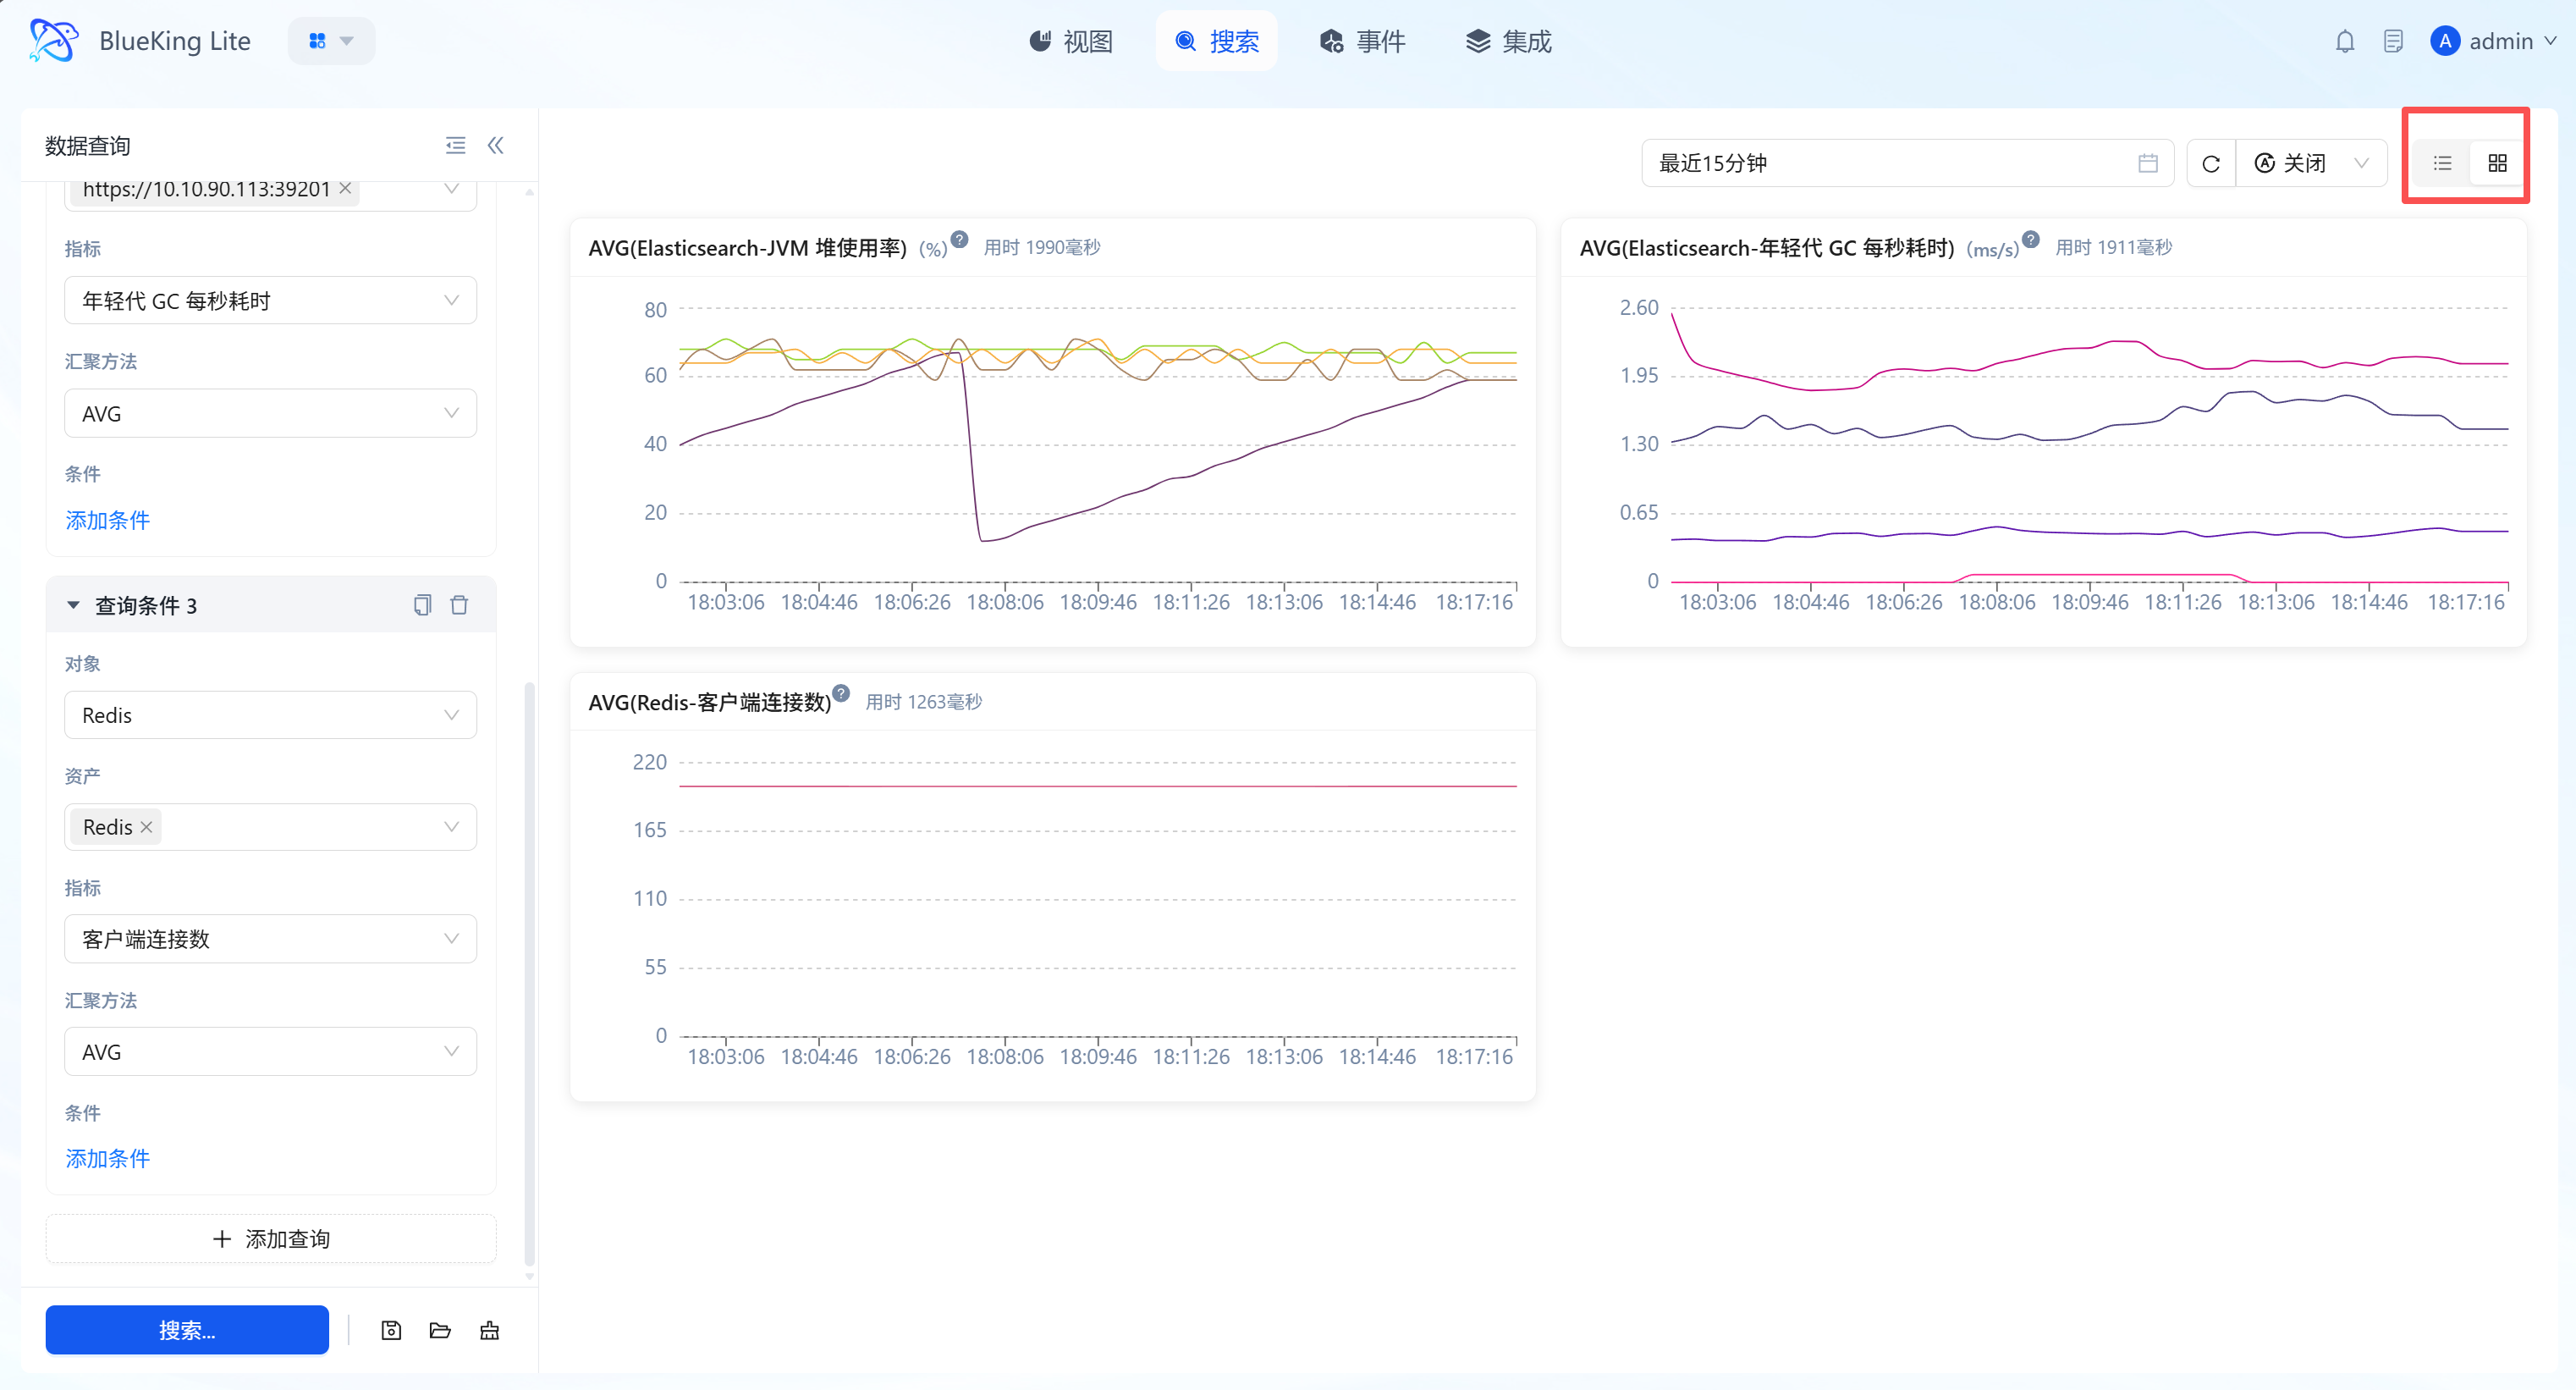
- Multiple Query Groups (Parallel Tasks): Click "+ Add Query" to create multiple independent query cards, enabling cross-resource, cross-metric same-axis/split-axis analysis.
- Named Query Save/Load: Allows saving configured multi-dimensional complex query conditions by organization scope(s), supporting quick subsequent loading and reuse within current permission scope to improve daily reuse efficiency.
- Layered Layout Switching:
- List Mode: Vertical arrangement, suitable for deep analysis of long-period waveforms for a single metric.
- Tiled Grid Mode: Matrix arrangement, suitable for monitoring full-chain core metrics within limited screen space.
- Global Time Linkage: Supports unified time period selection, one-click refreshing all charts to ensure baseline synchronization.
3. Event
Events are the platform's core module for full-lifecycle alert management, integrating "Alert, Policy, Template" sub-tabs to achieve the closed-loop operations flow from "anomaly monitoring - alert handling - rule configuration - template reuse," serving as the unified operations entry point for handling monitoring anomalies.
3.1 Event Page
Core Positioning
The Event page is the centralized operations carrier for the full alert lifecycle, with three sub-tabs at the top for function switching:
- Alert Tab: Manage current unhandled/handled alert records (corresponding to section 3.2);
- Policy Tab: Create/edit alert detection rules (corresponding to section 3.3);
- Template Tab: Reuse pre-configured alert rule templates (corresponding to section 3.4); No page navigation required — you can complete the core operations of "viewing alerts, configuring rules, using templates" to improve operational efficiency.
3.2 Alert Management (Event Page "Alert" Tab)
Under the "Alert" sub-tab, monitoring anomalies can be managed in two categories: "Active Alerts" and "Historical Alerts."
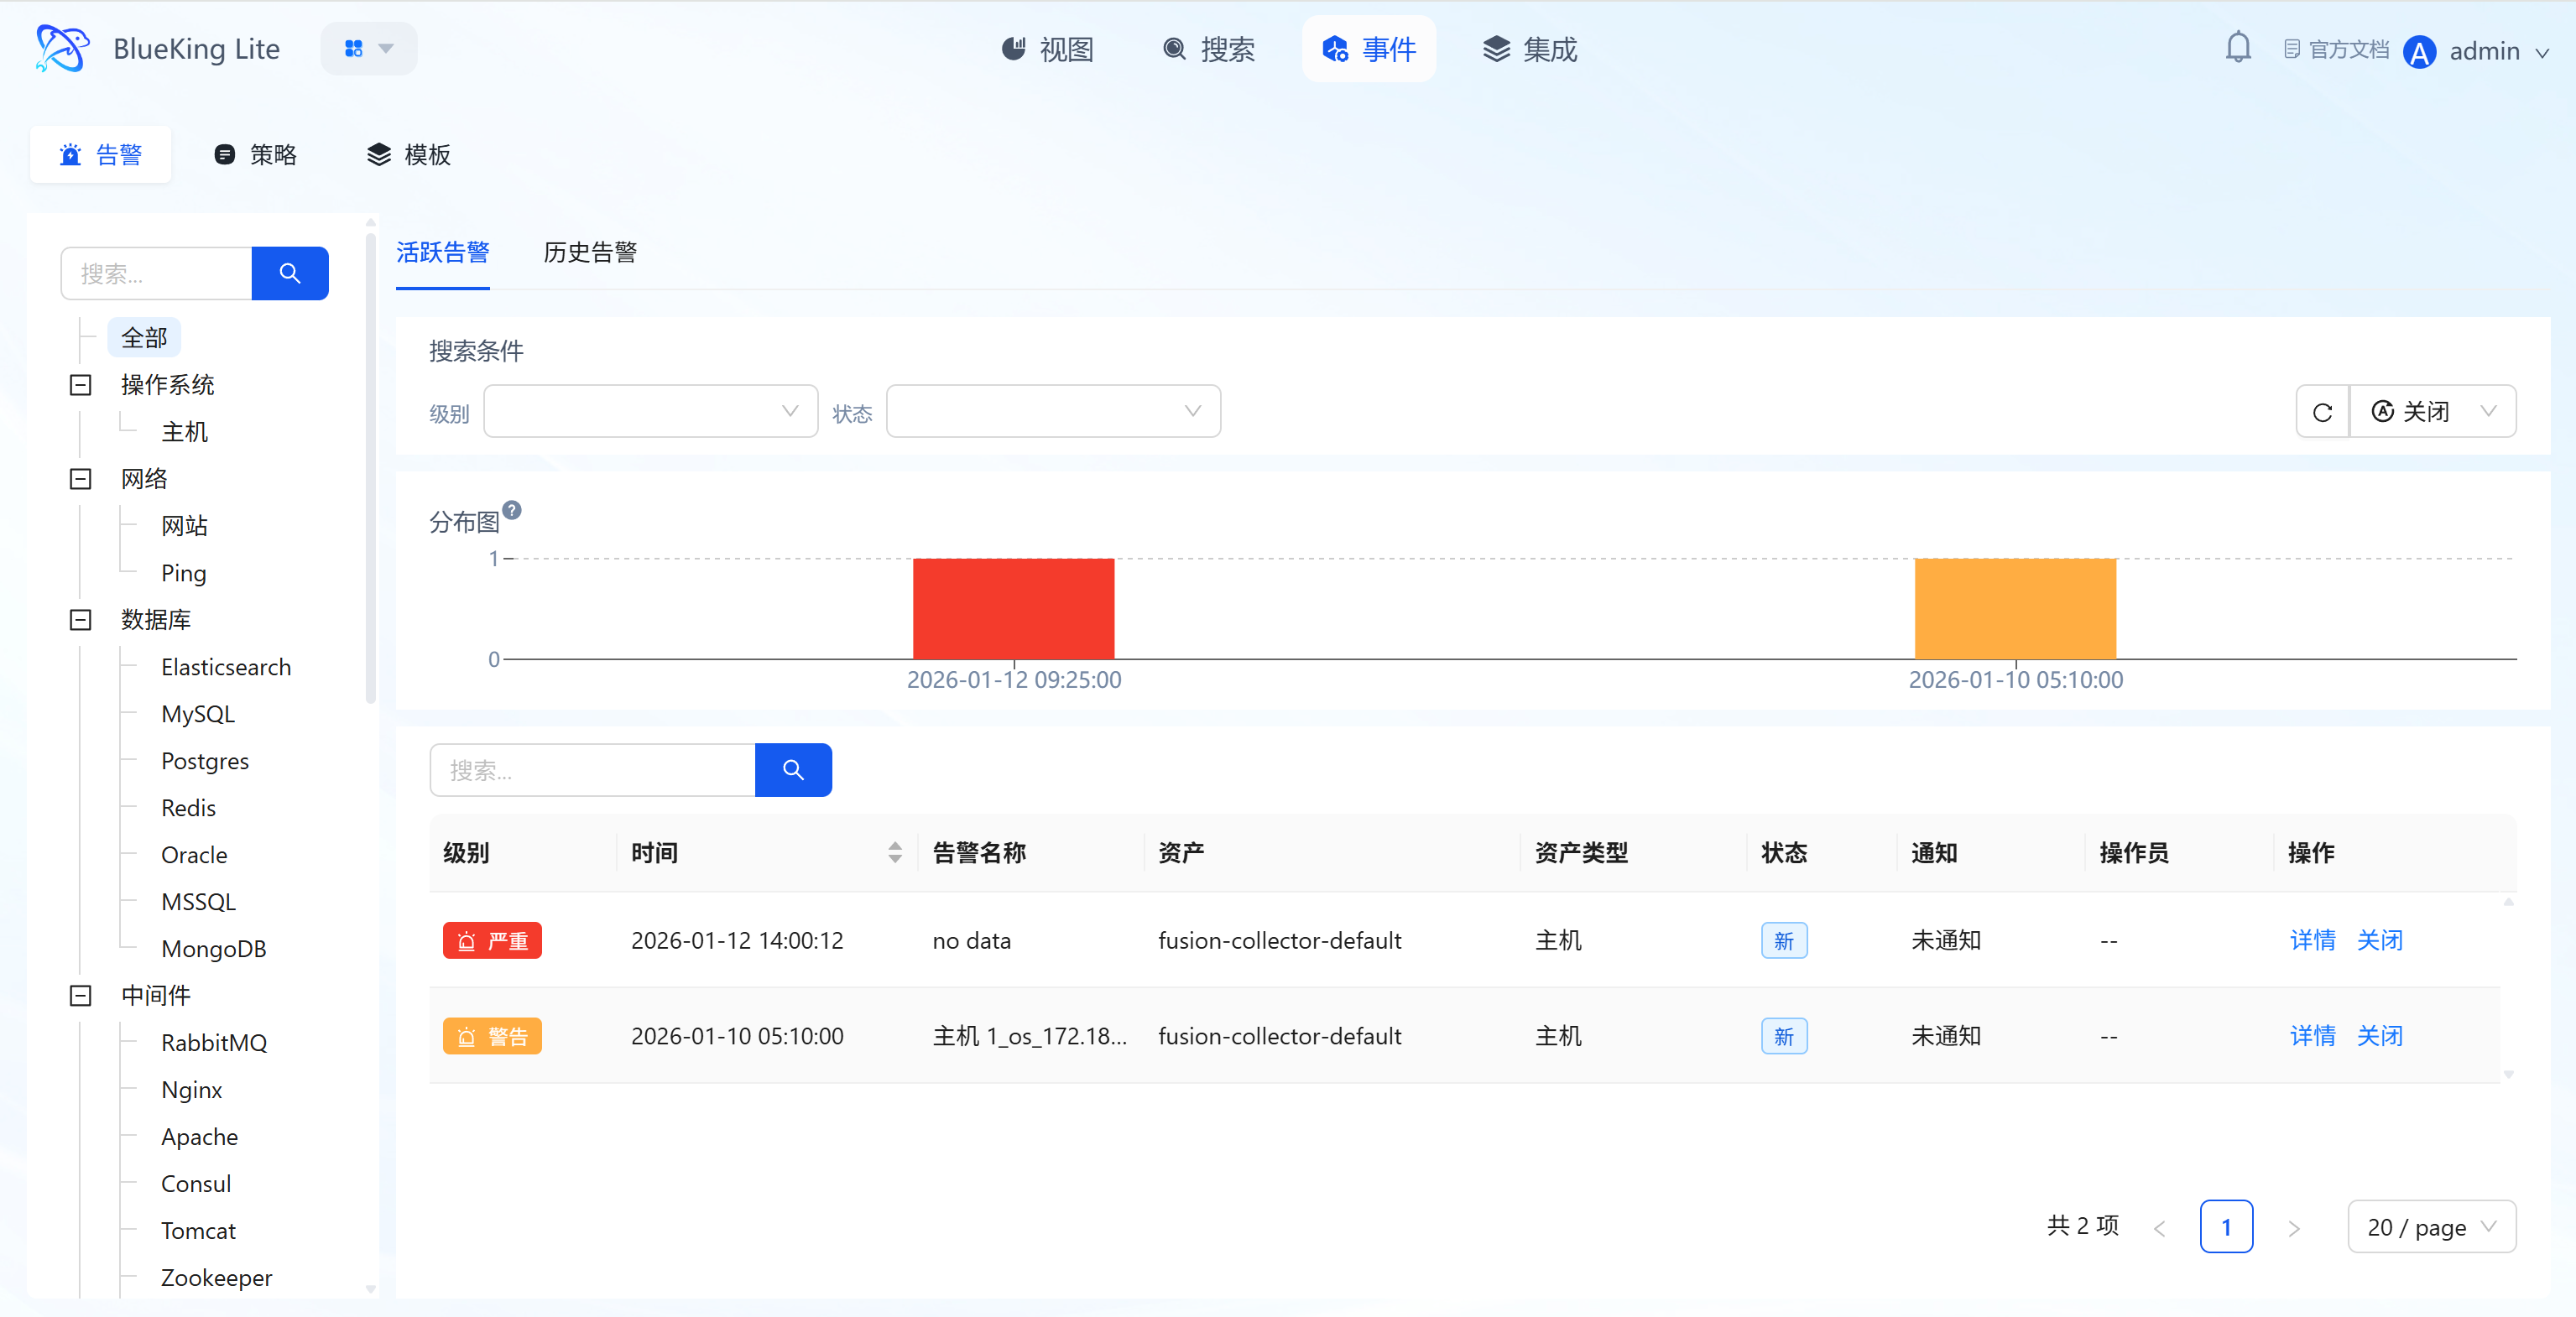
3.2.1 Active Alert Management
Maintain real-time awareness of currently unhandled anomaly alerts, quickly locating and handling high-risk events. When a related alert policy is "disabled," the system will automatically close alerts triggered by that policy that are still active, preventing alert accumulation.
Core Capabilities
- Multi-Dimensional Filtering: Supports filtering active alerts by "Monitoring Object Tree, Alert Level, Status, and Keywords," facilitating quick narrowing of investigation scope;
- Alert Distribution Visualization: Displays alert time density through histograms for intuitive identification of "alert storm" periods;
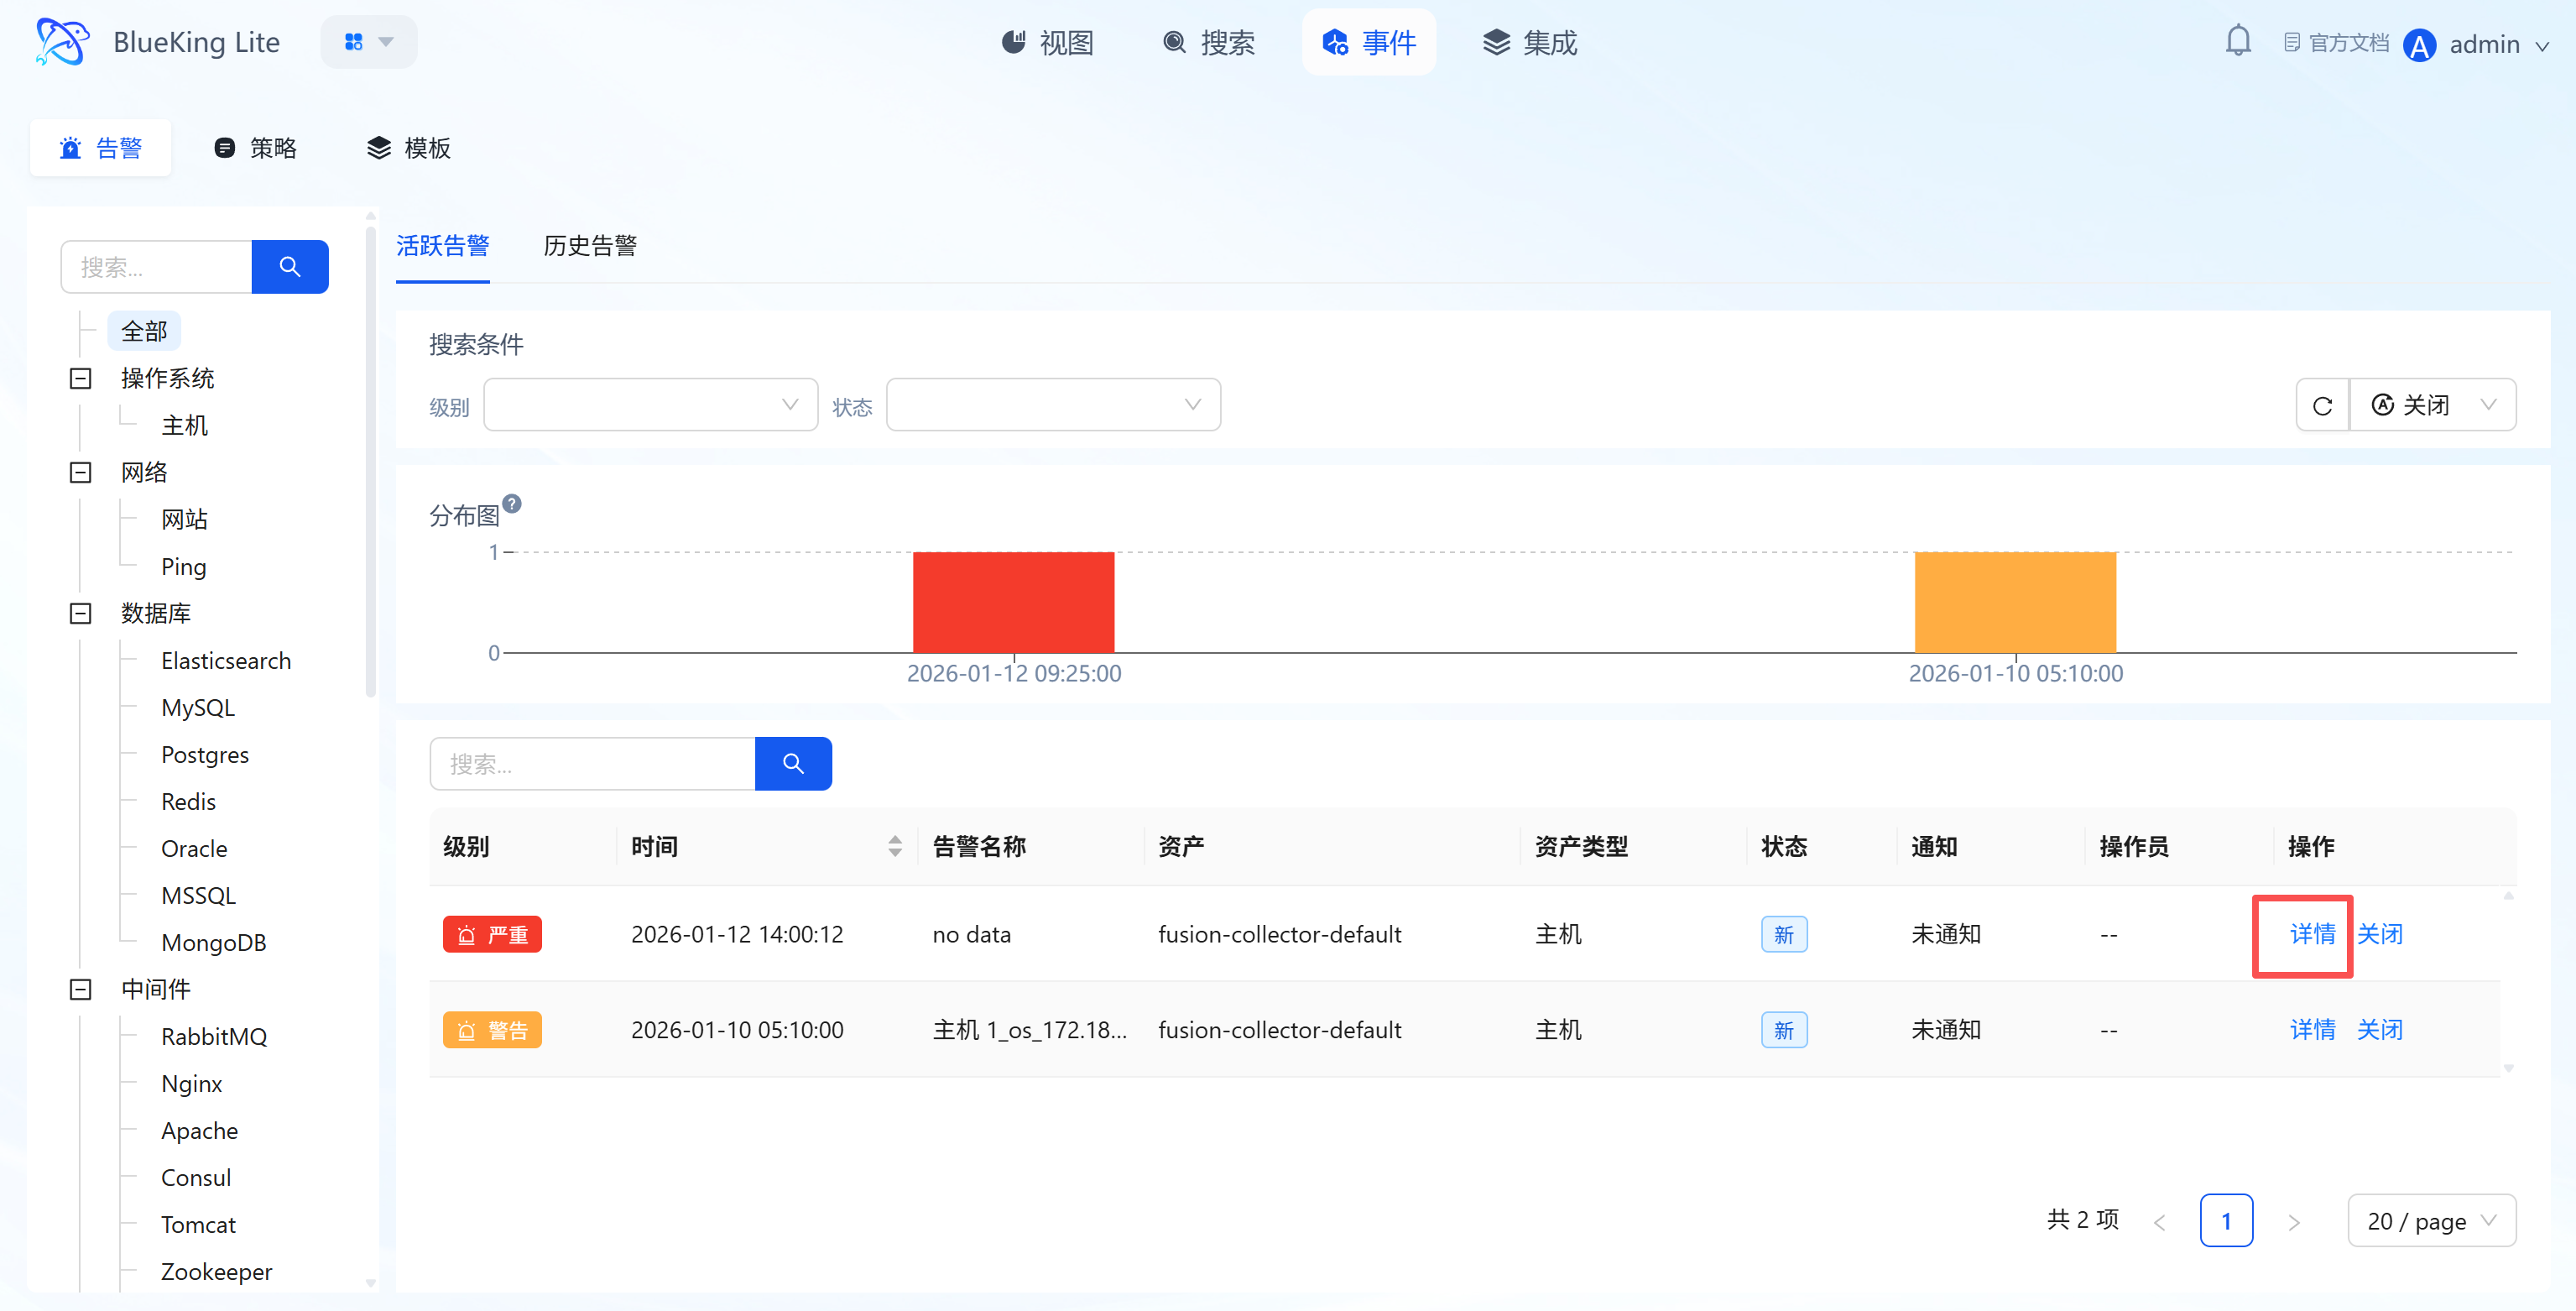
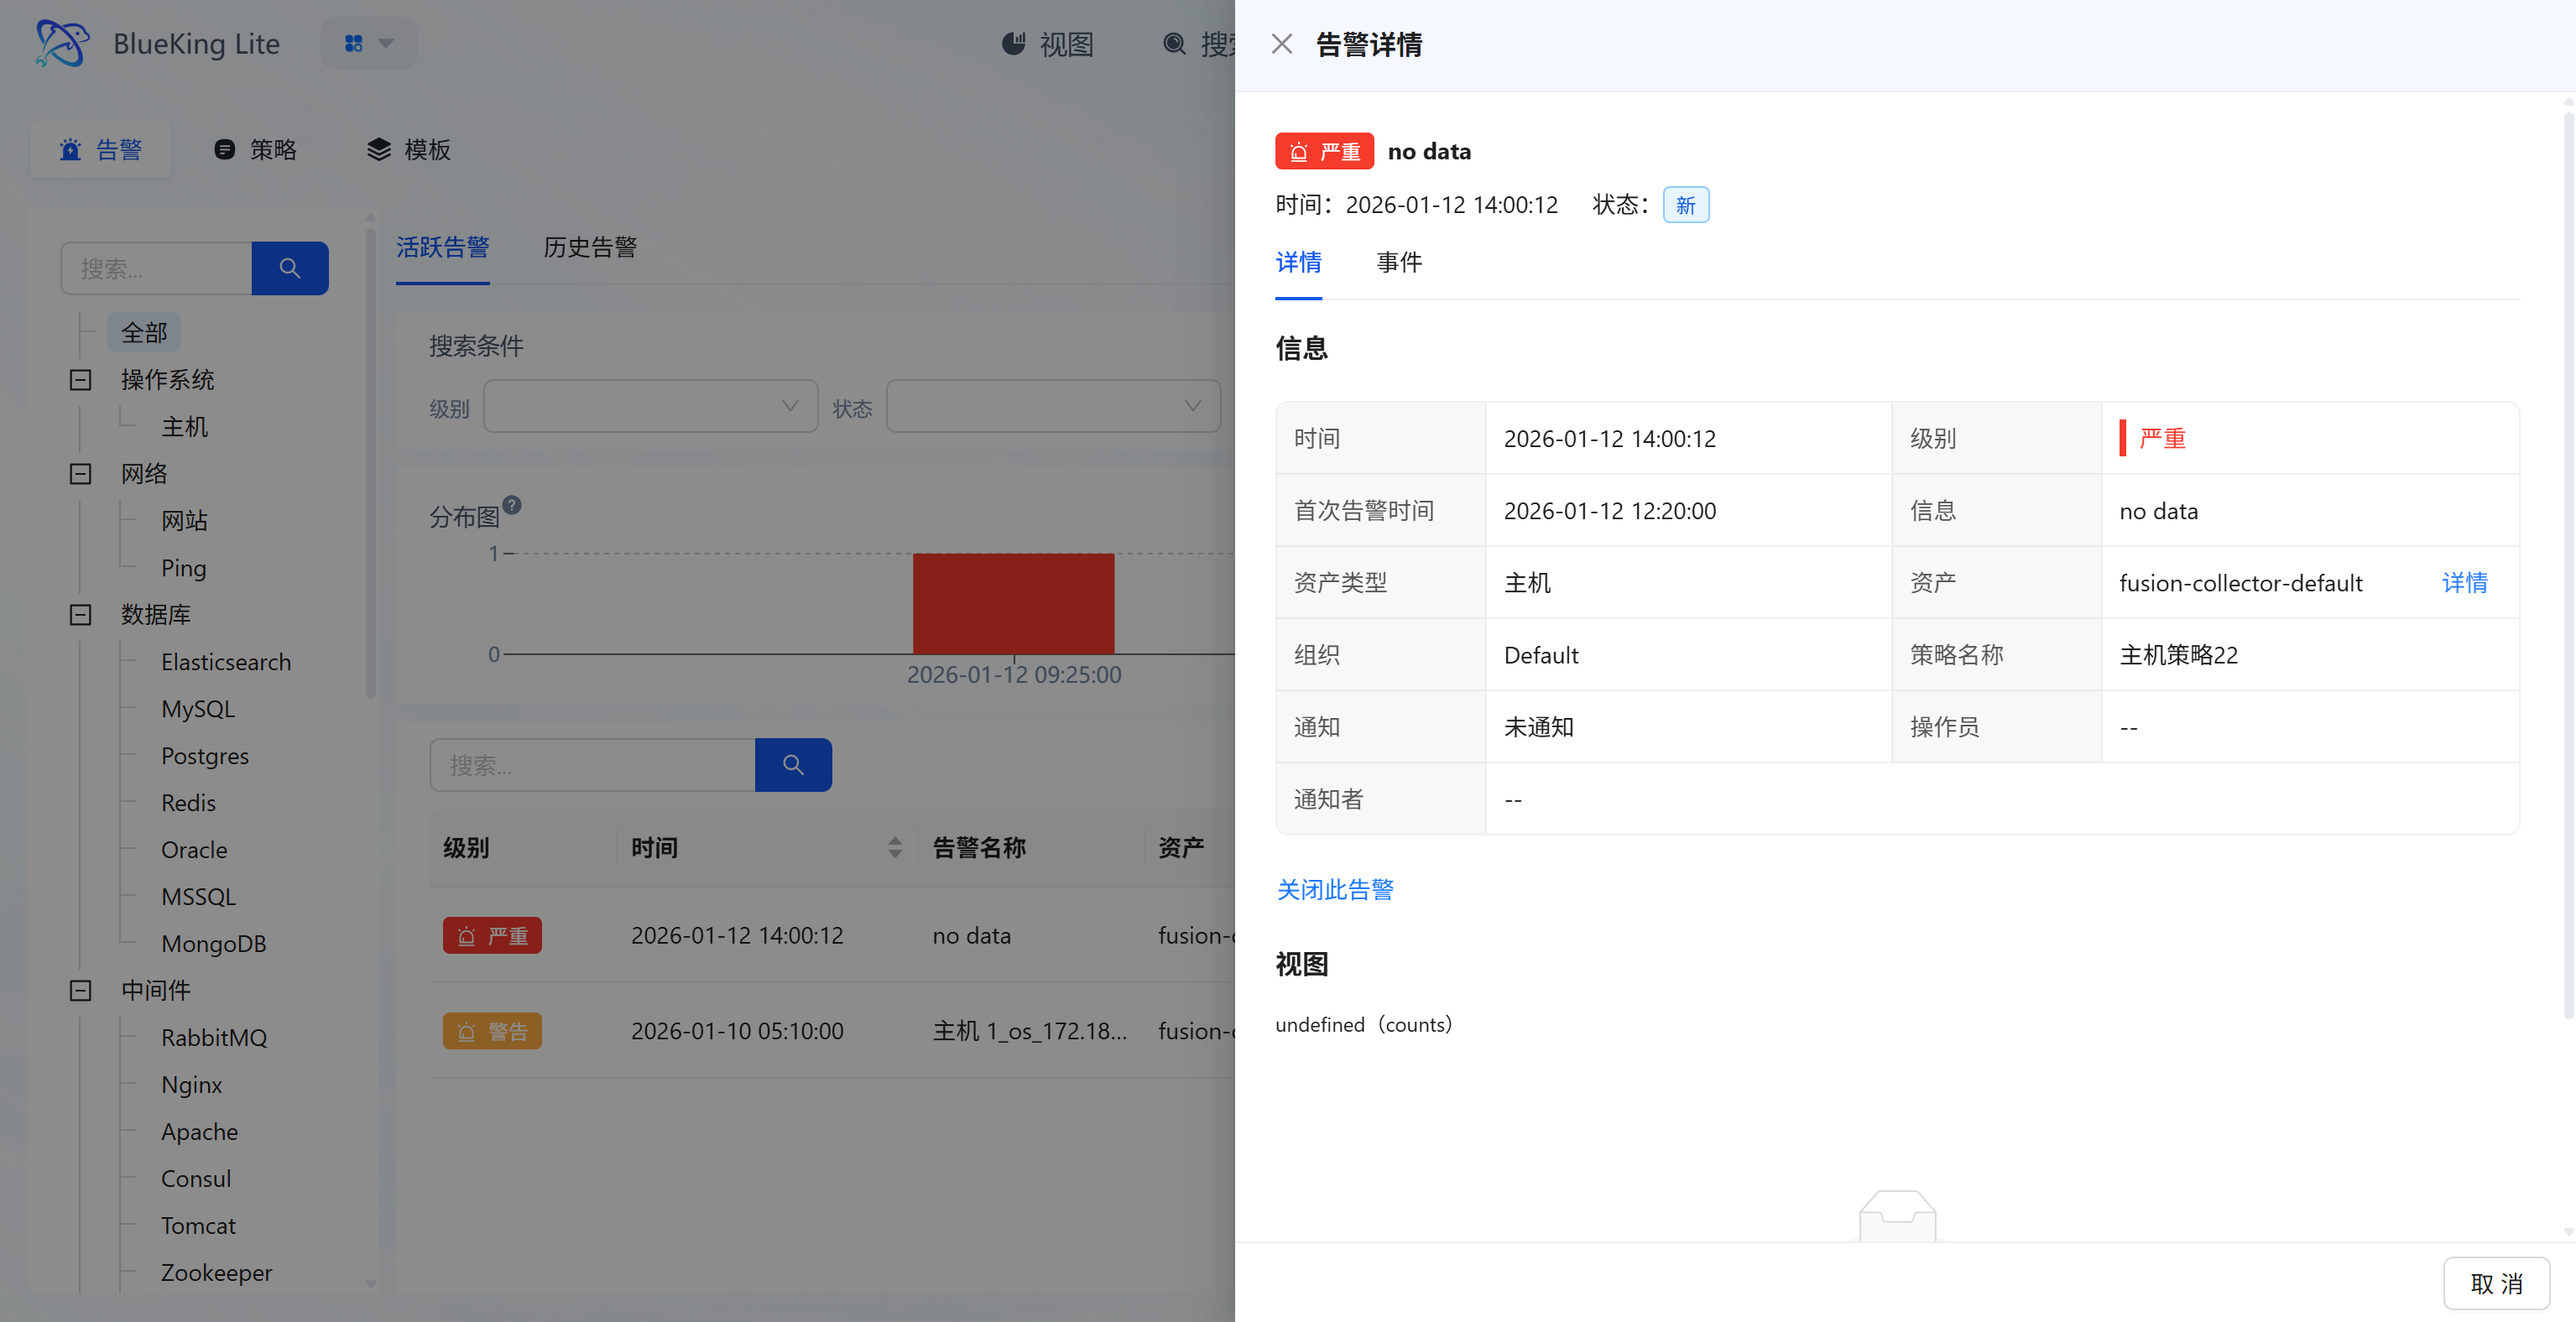
- Alert Handling and Details: List displays alert "Level, Time, Associated Asset, Status"; clicking "Details" shows full alert information (including first alert time, policy name, notification channel source, etc.); clicking "Close" marks the alert as handled;
- Policy Configuration Change Auto-Convergence: When alert policy undergoes semantic changes to data source, grouping dimension, query condition, monitoring object, or collection type, the system automatically closes old active threshold alerts under that policy and records the change reason in operation logs (e.g.,
policy_scope_changed,policy_group_by_changed, etc.), preventing long-running false-positive alerts caused by policy scope drift. When an alert center channel is configured, the closure event is synced there; without configuration, only local lifecycle convergence occurs without disrupting regular notification channels.
3.2.2 Historical Alert Review
Query handled/auto-recovered historical alerts to assist with fault tracing and SLA analysis.
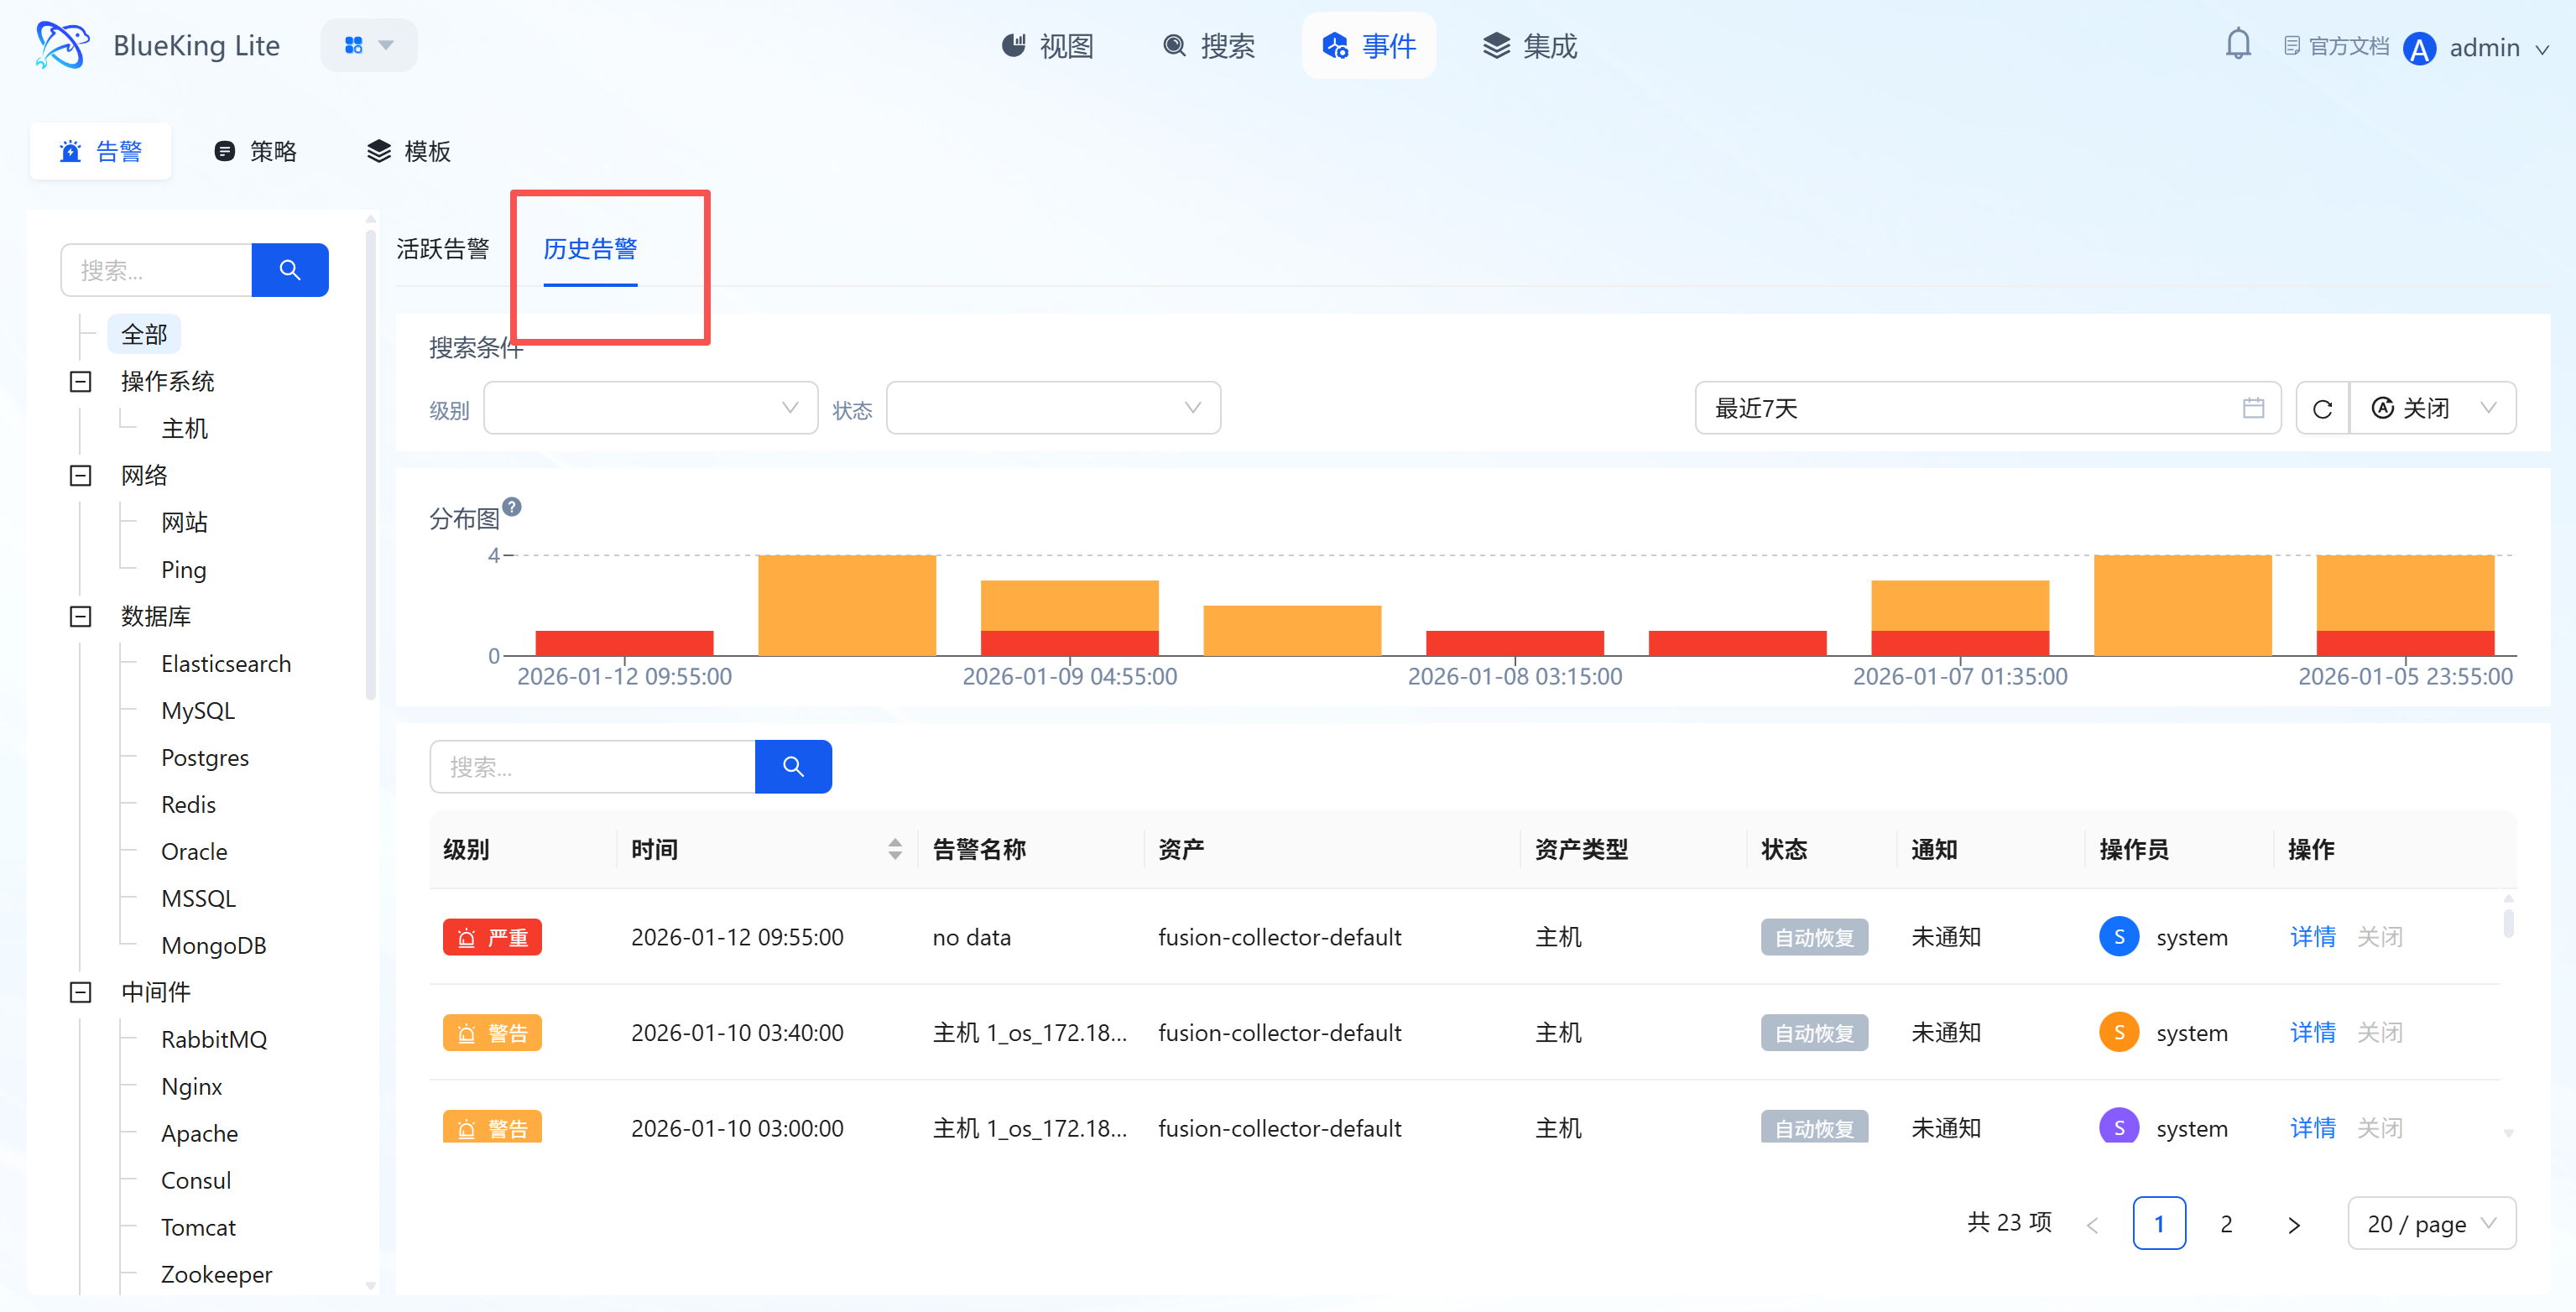
Core Capabilities
- Historical Range Filtering: Supports time-range lookback of historical alerts, combined with "Monitoring Object Tree, Level, Status, and Keywords" for precise anomaly targeting;
- Multi-Status Display: List includes "Auto-Recovery" and "Manually Closed" status alerts, annotated with "Operator, Notification Status" for tracing the handling process;
- Trend Analysis: Histograms display historical alert time distribution, helping identify periodic failures.
3.3 Policy Configuration (Event Page "Policy" Tab)
Under the "Policy" sub-tab, you can manage the lifecycle of alert rules and define precise anomaly detection logic through the "Create Policy" wizard.
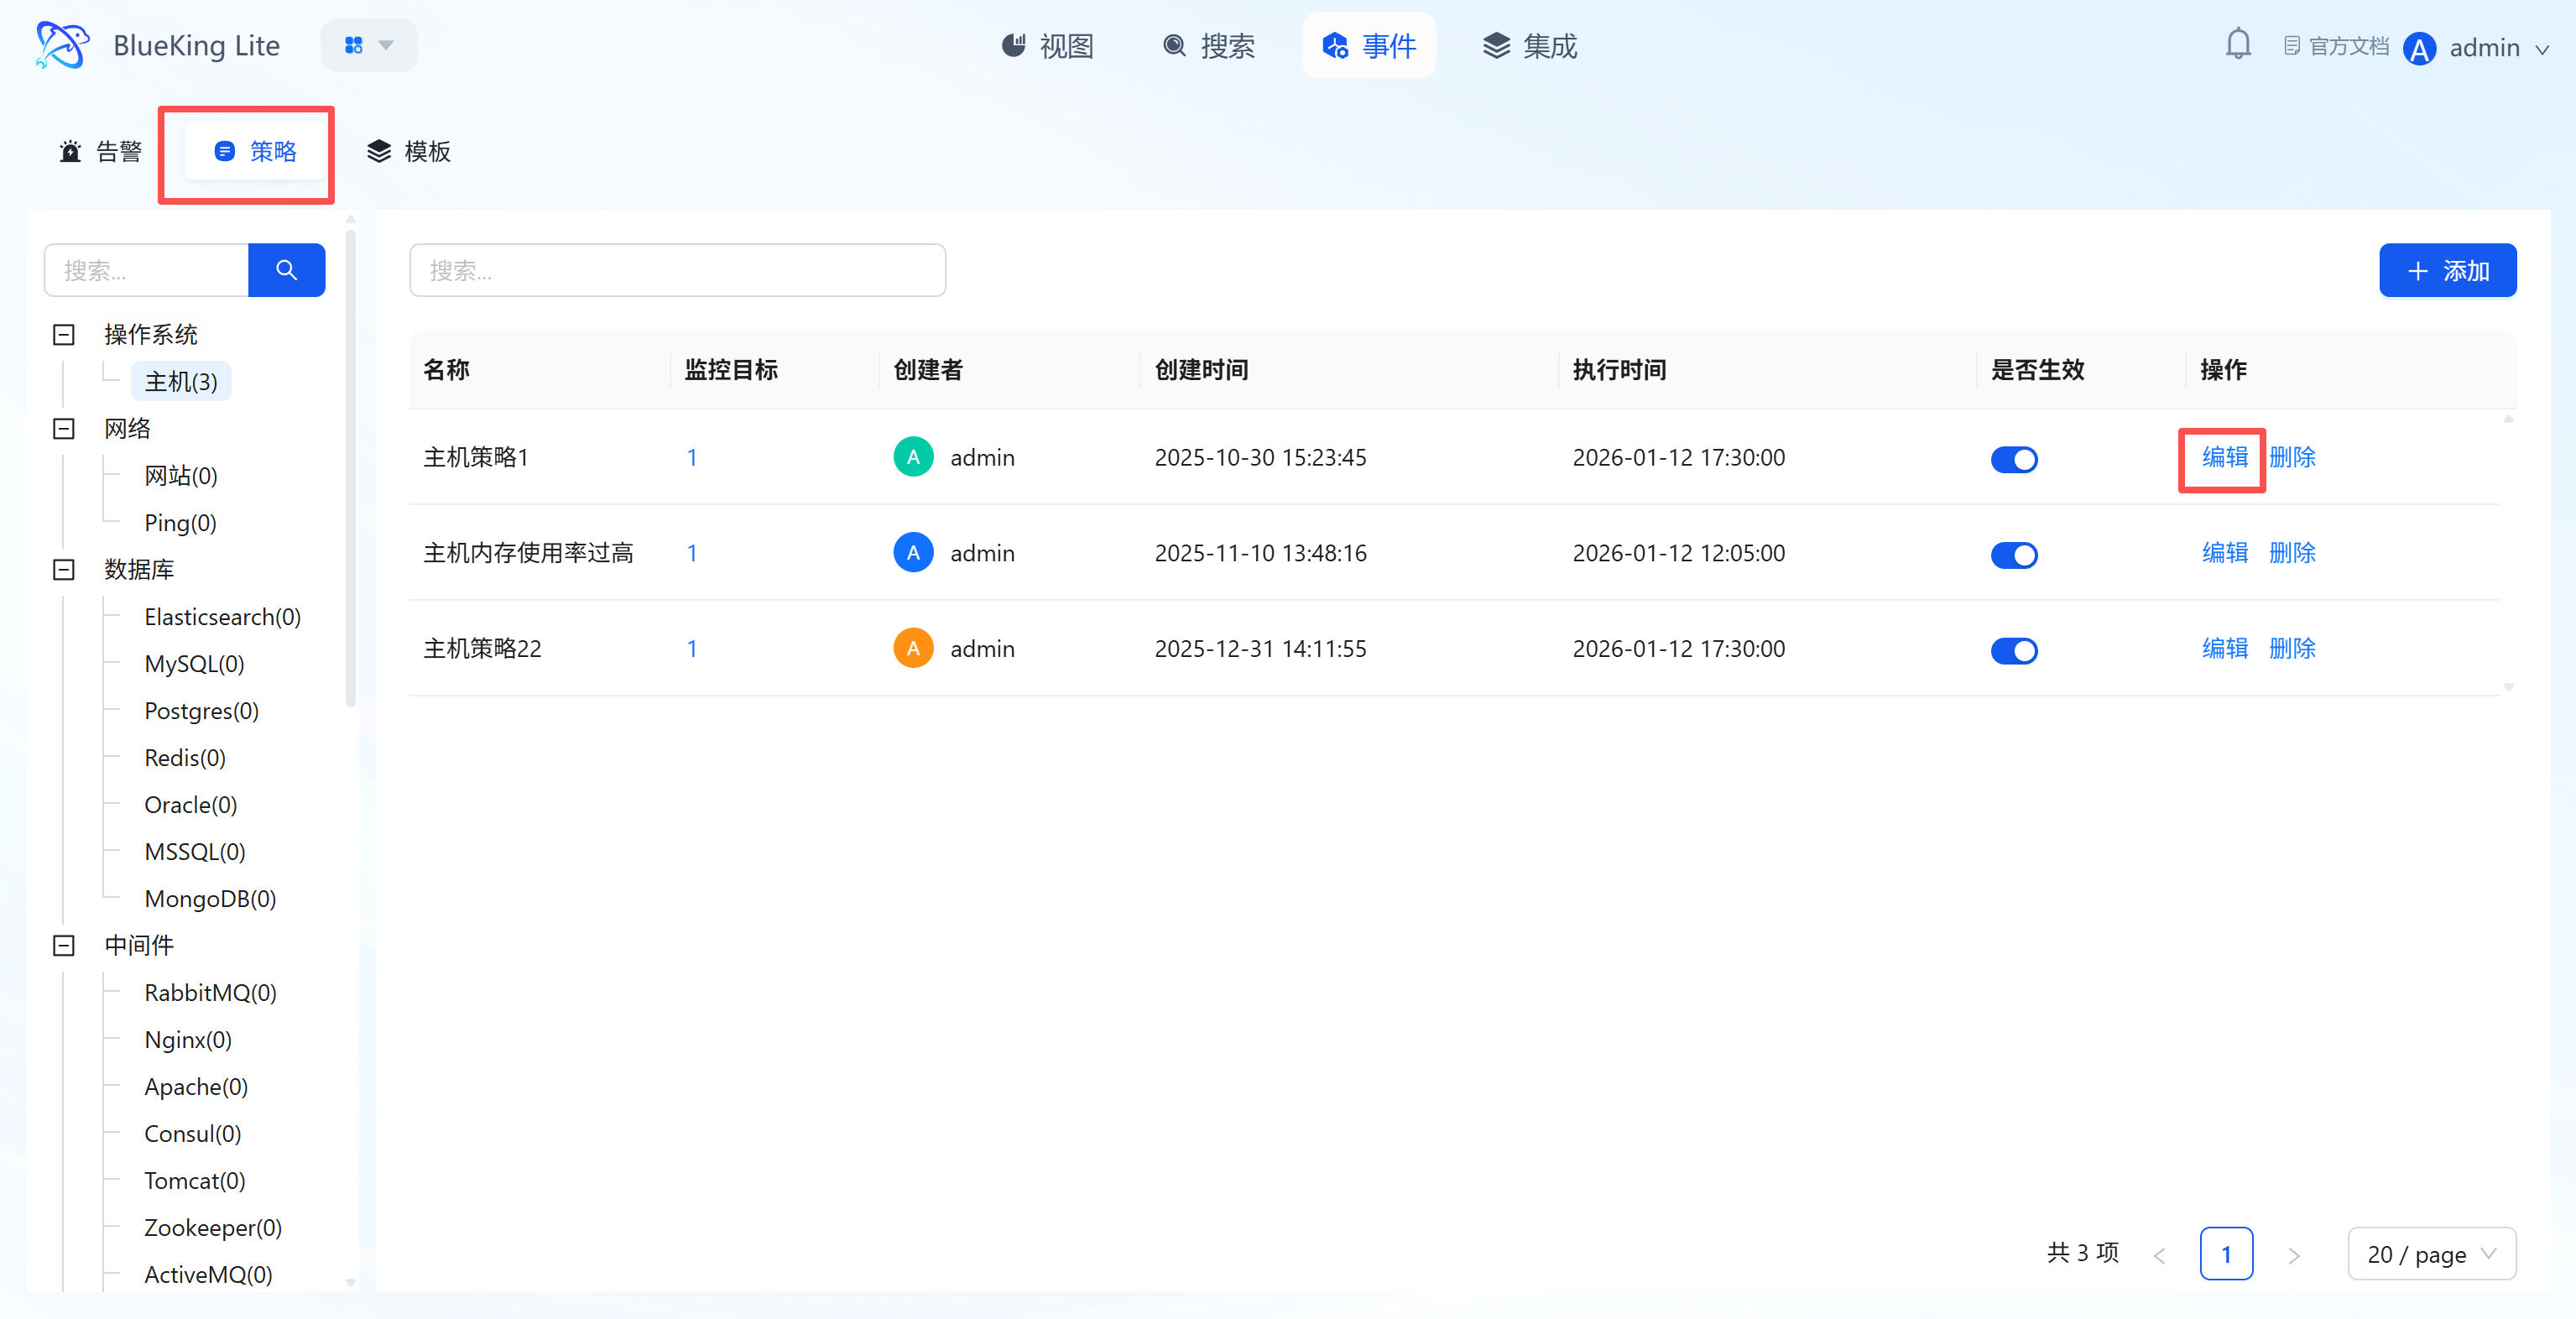
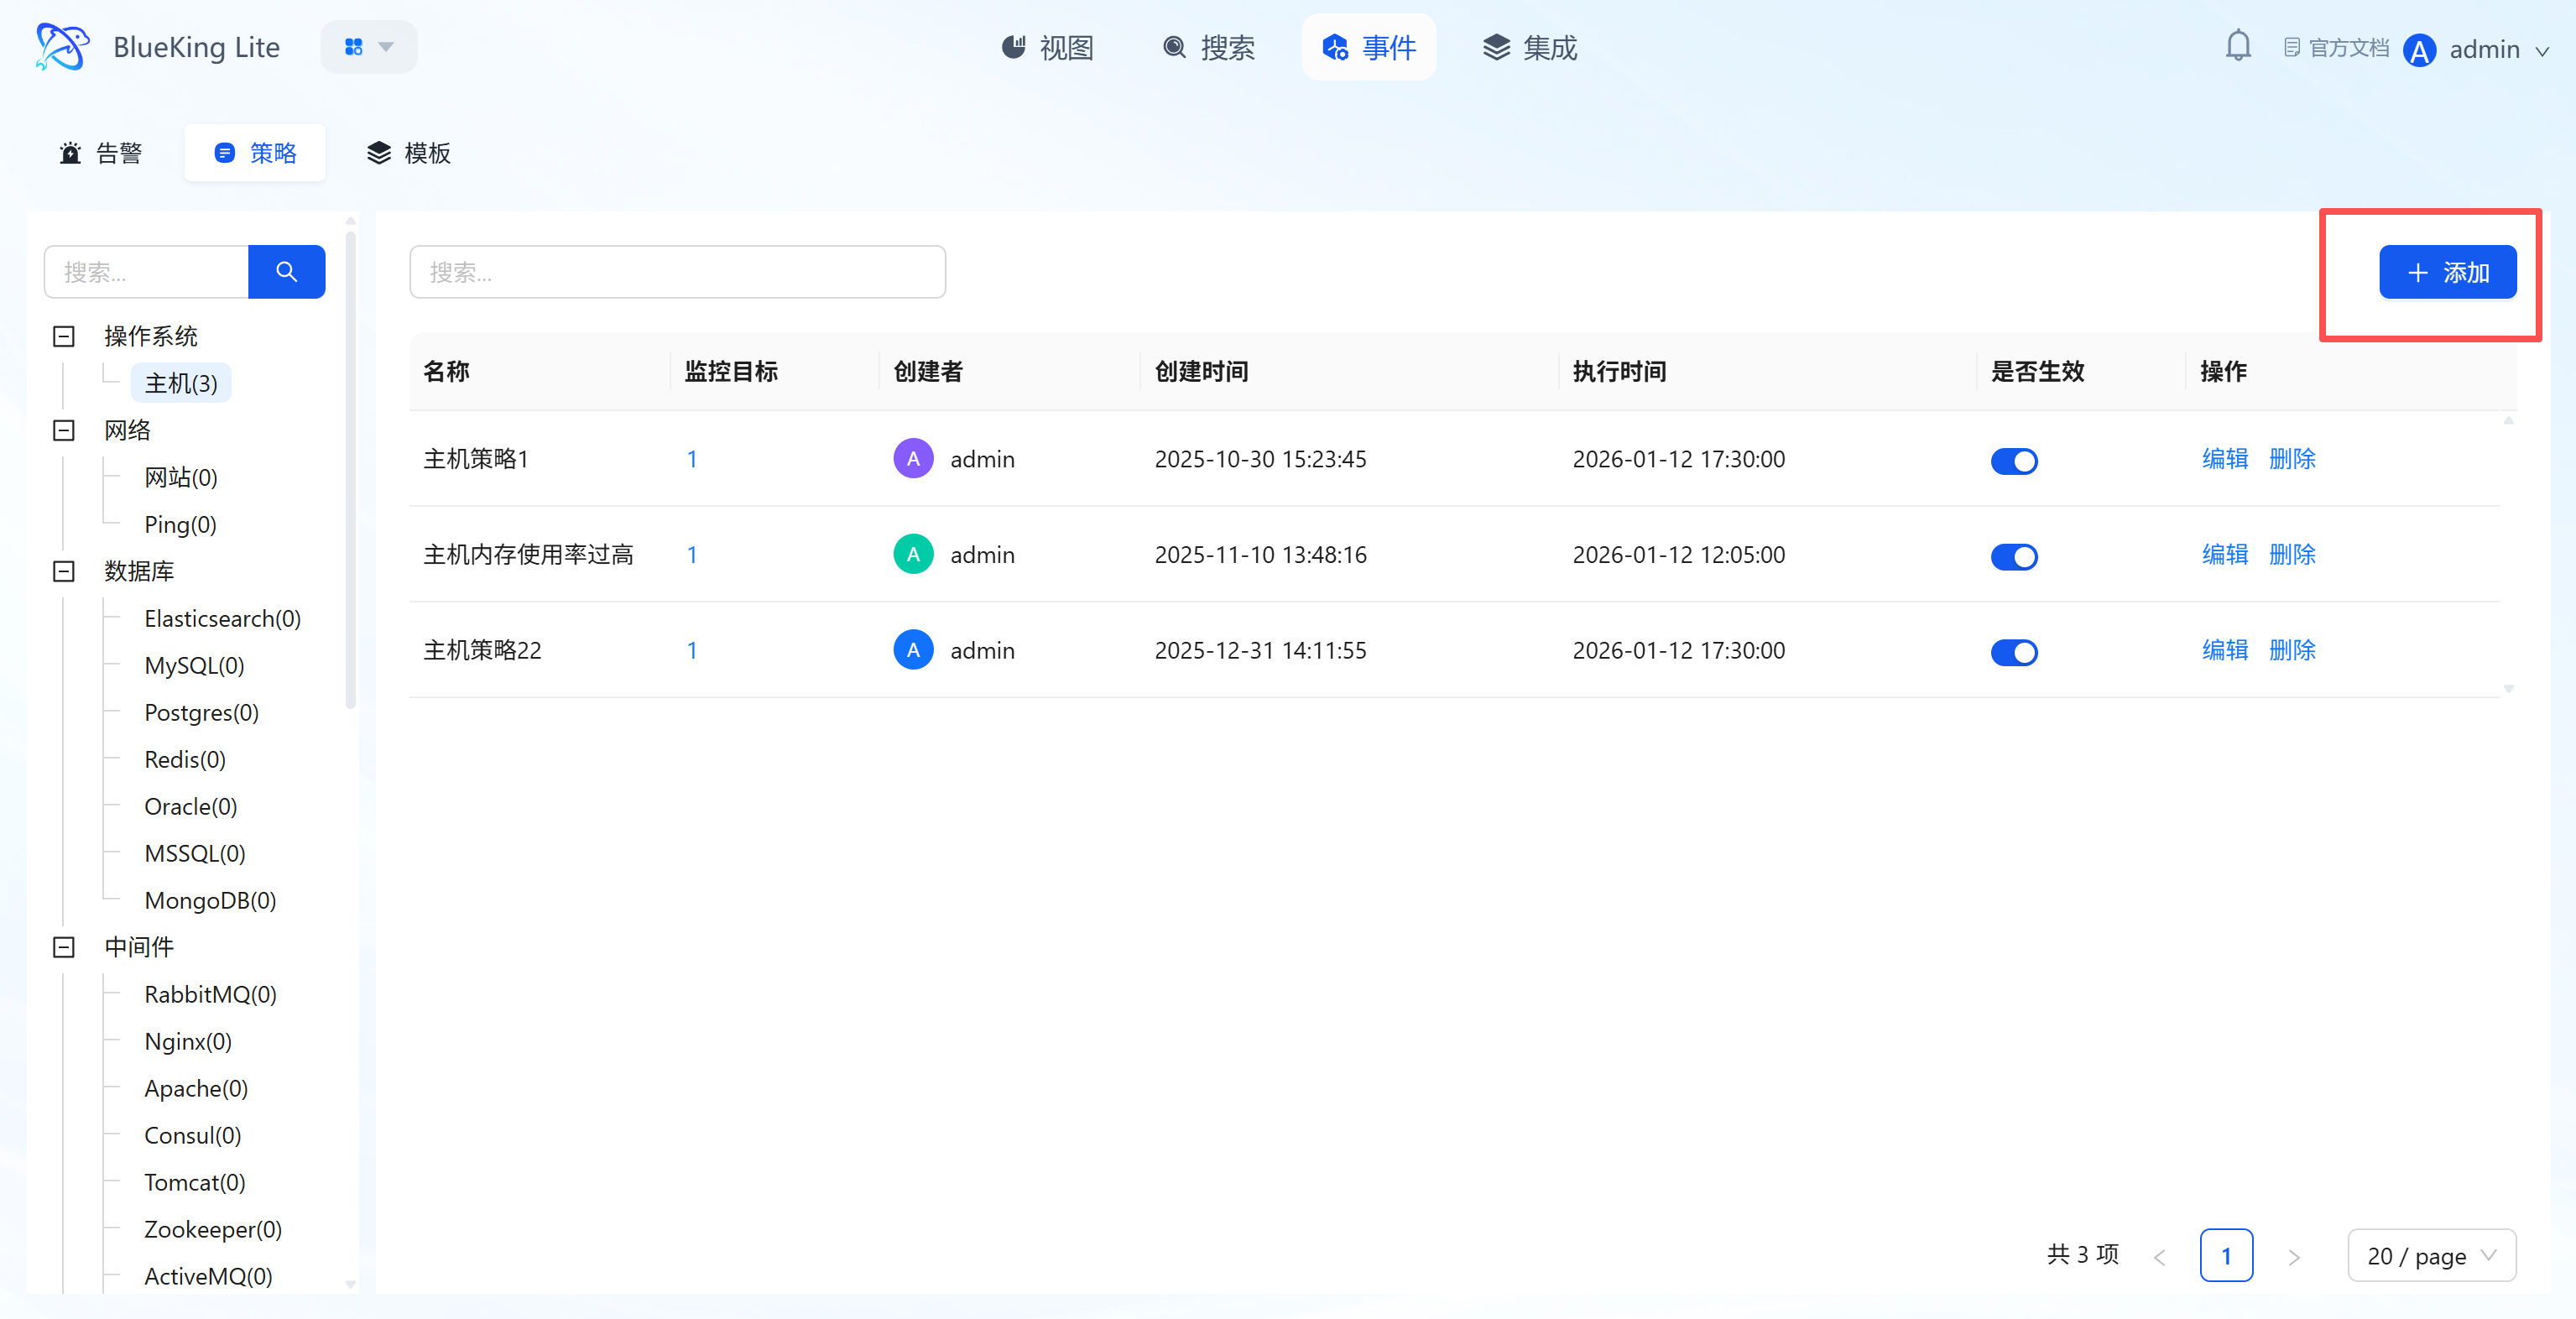
3.3.1 Policy Lifecycle Management
The policy list displays configured rules' "Name, Number of Monitored Targets, Creator, Execution Time, Active Status" and provides:
- "Active Toggle": One-click enable/disable policy;
- "Edit/Delete": Adjust rules or remove invalid configurations;
- "+ Add": Click to enter the Create Policy Wizard and complete new rule configuration in 4 steps.
3.3.2 Step-by-Step Create Policy Wizard
Through a wizard-style form, complete the full-process rule definition from "Basic Information" to "Notification Configuration":
-
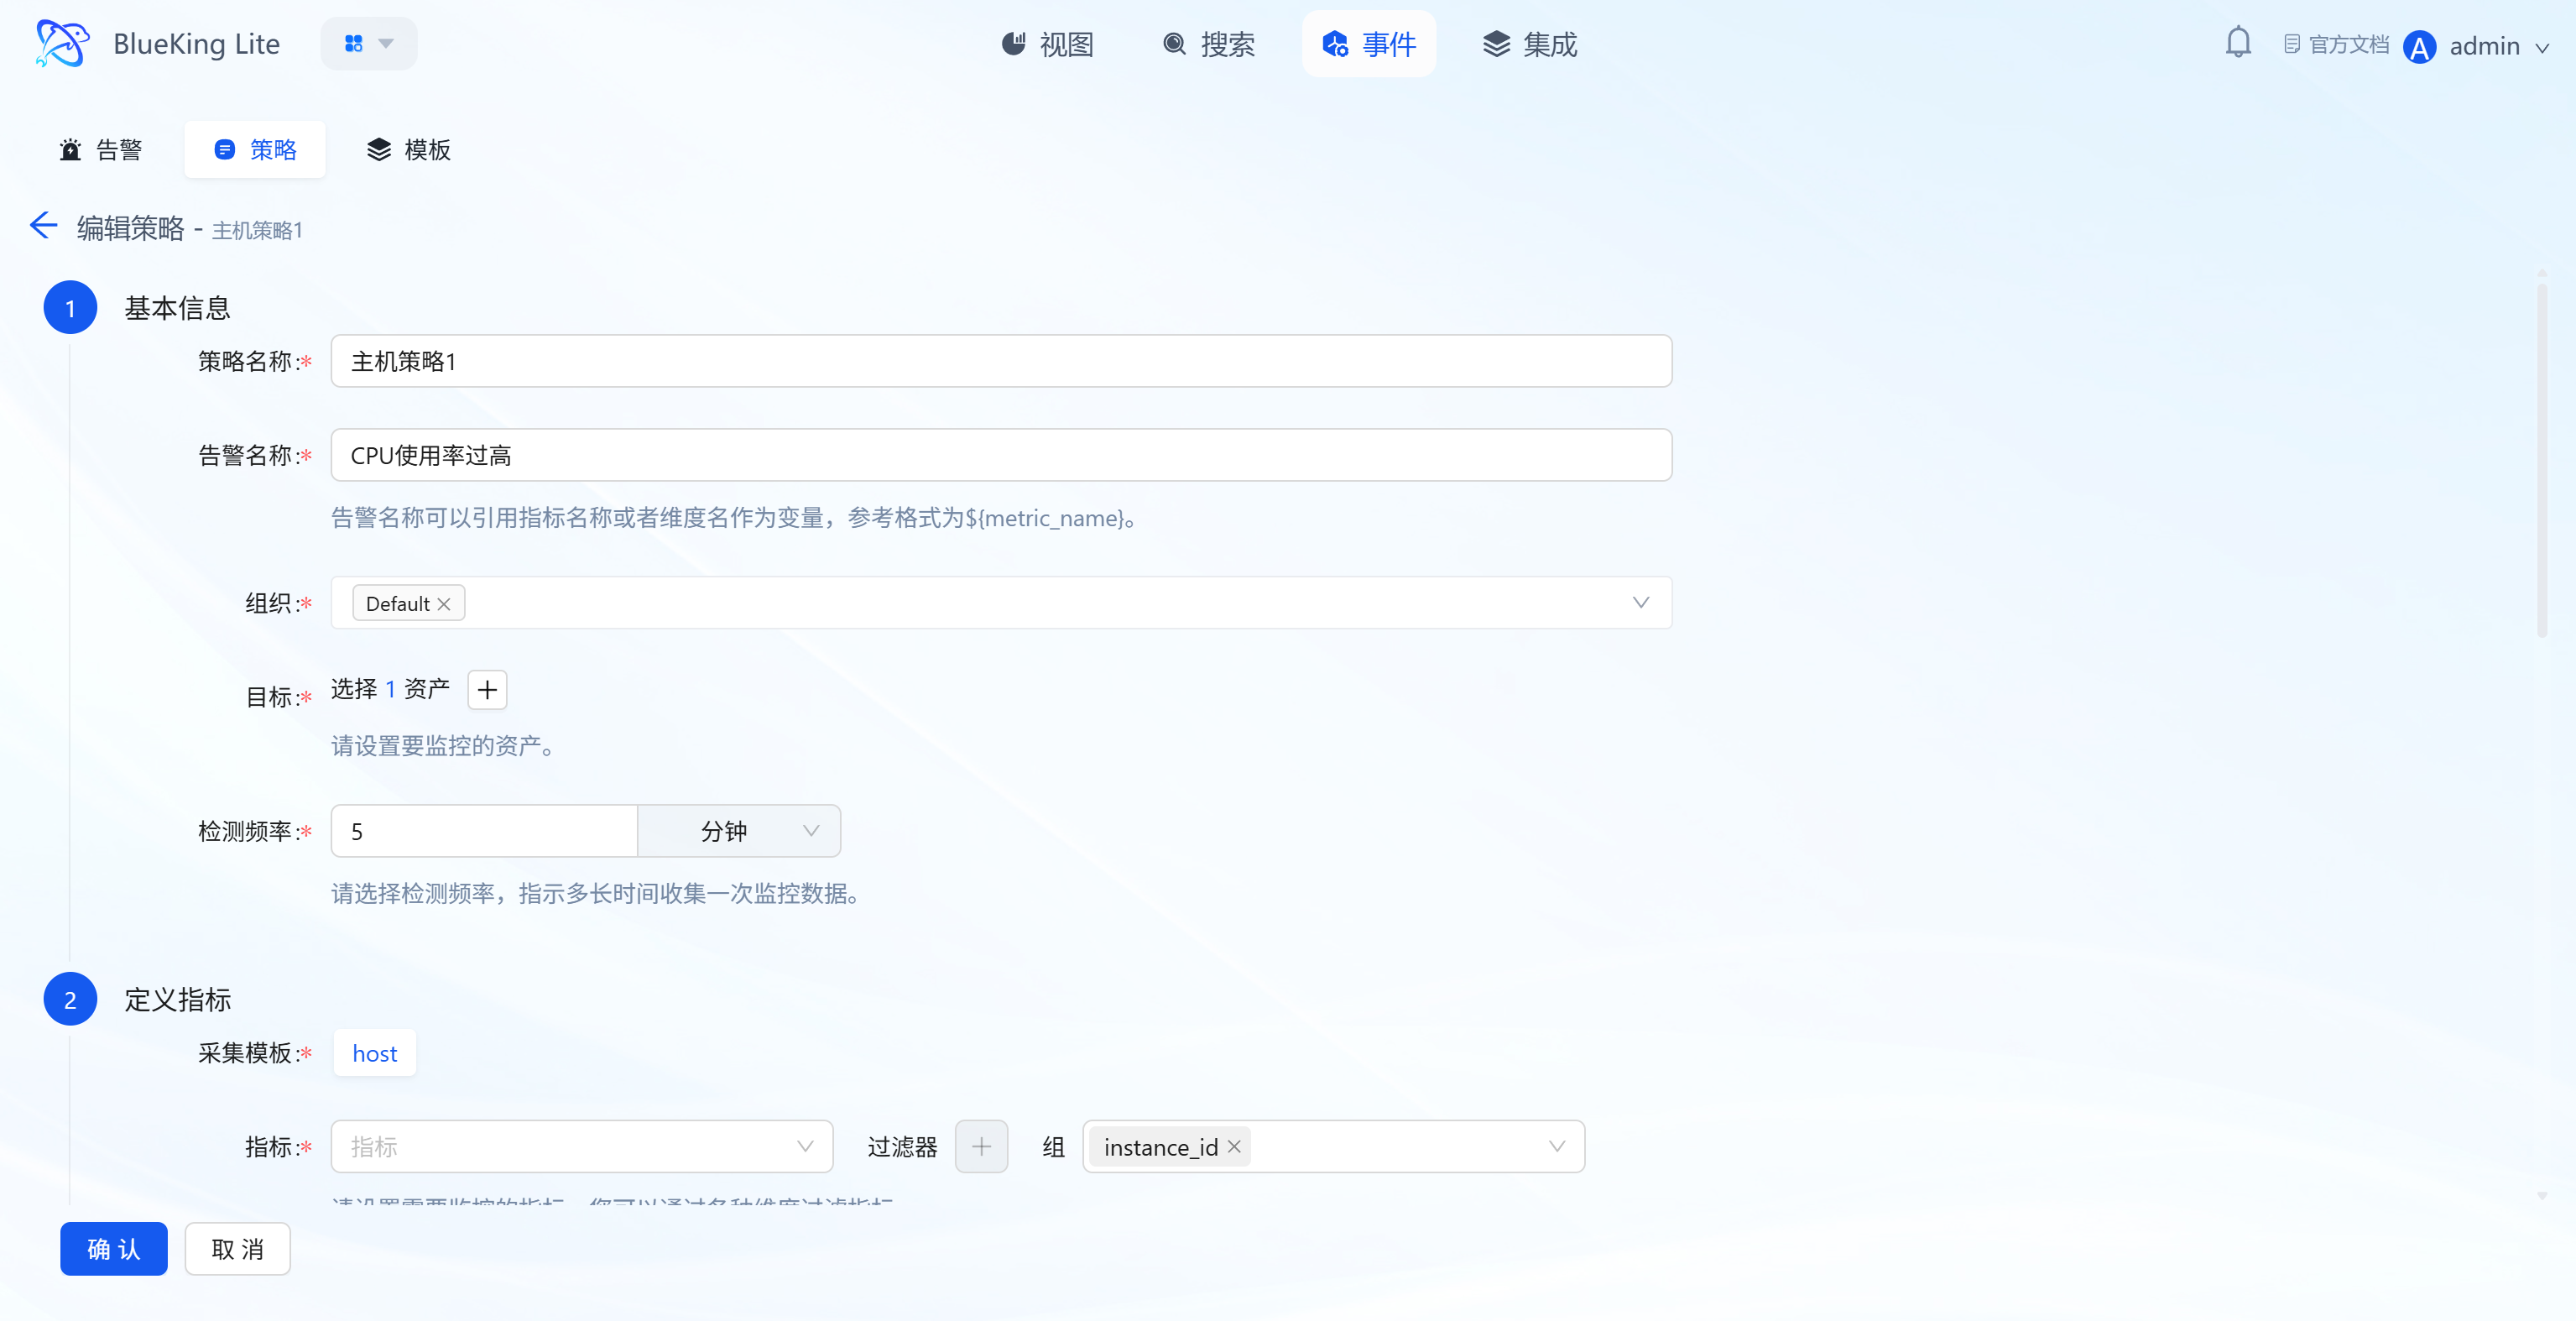
Step 1: Basic Information Configuration
- Policy Name: Enter a rule identifier (e.g., "Host CPU Usage Too High");
- Alert Name: Supports variable references (e.g.,
${monitor_object}${resource_name} Generated ${metric_name} Alert) for dynamic alert names across different instances; - Organization: Select the organization the rule belongs to (default is "Default");
- Target: Click "+" to select assets to monitor (supports multi-select);
- Detection Frequency: Set the metric detection interval (e.g., "every 5 minutes").
-
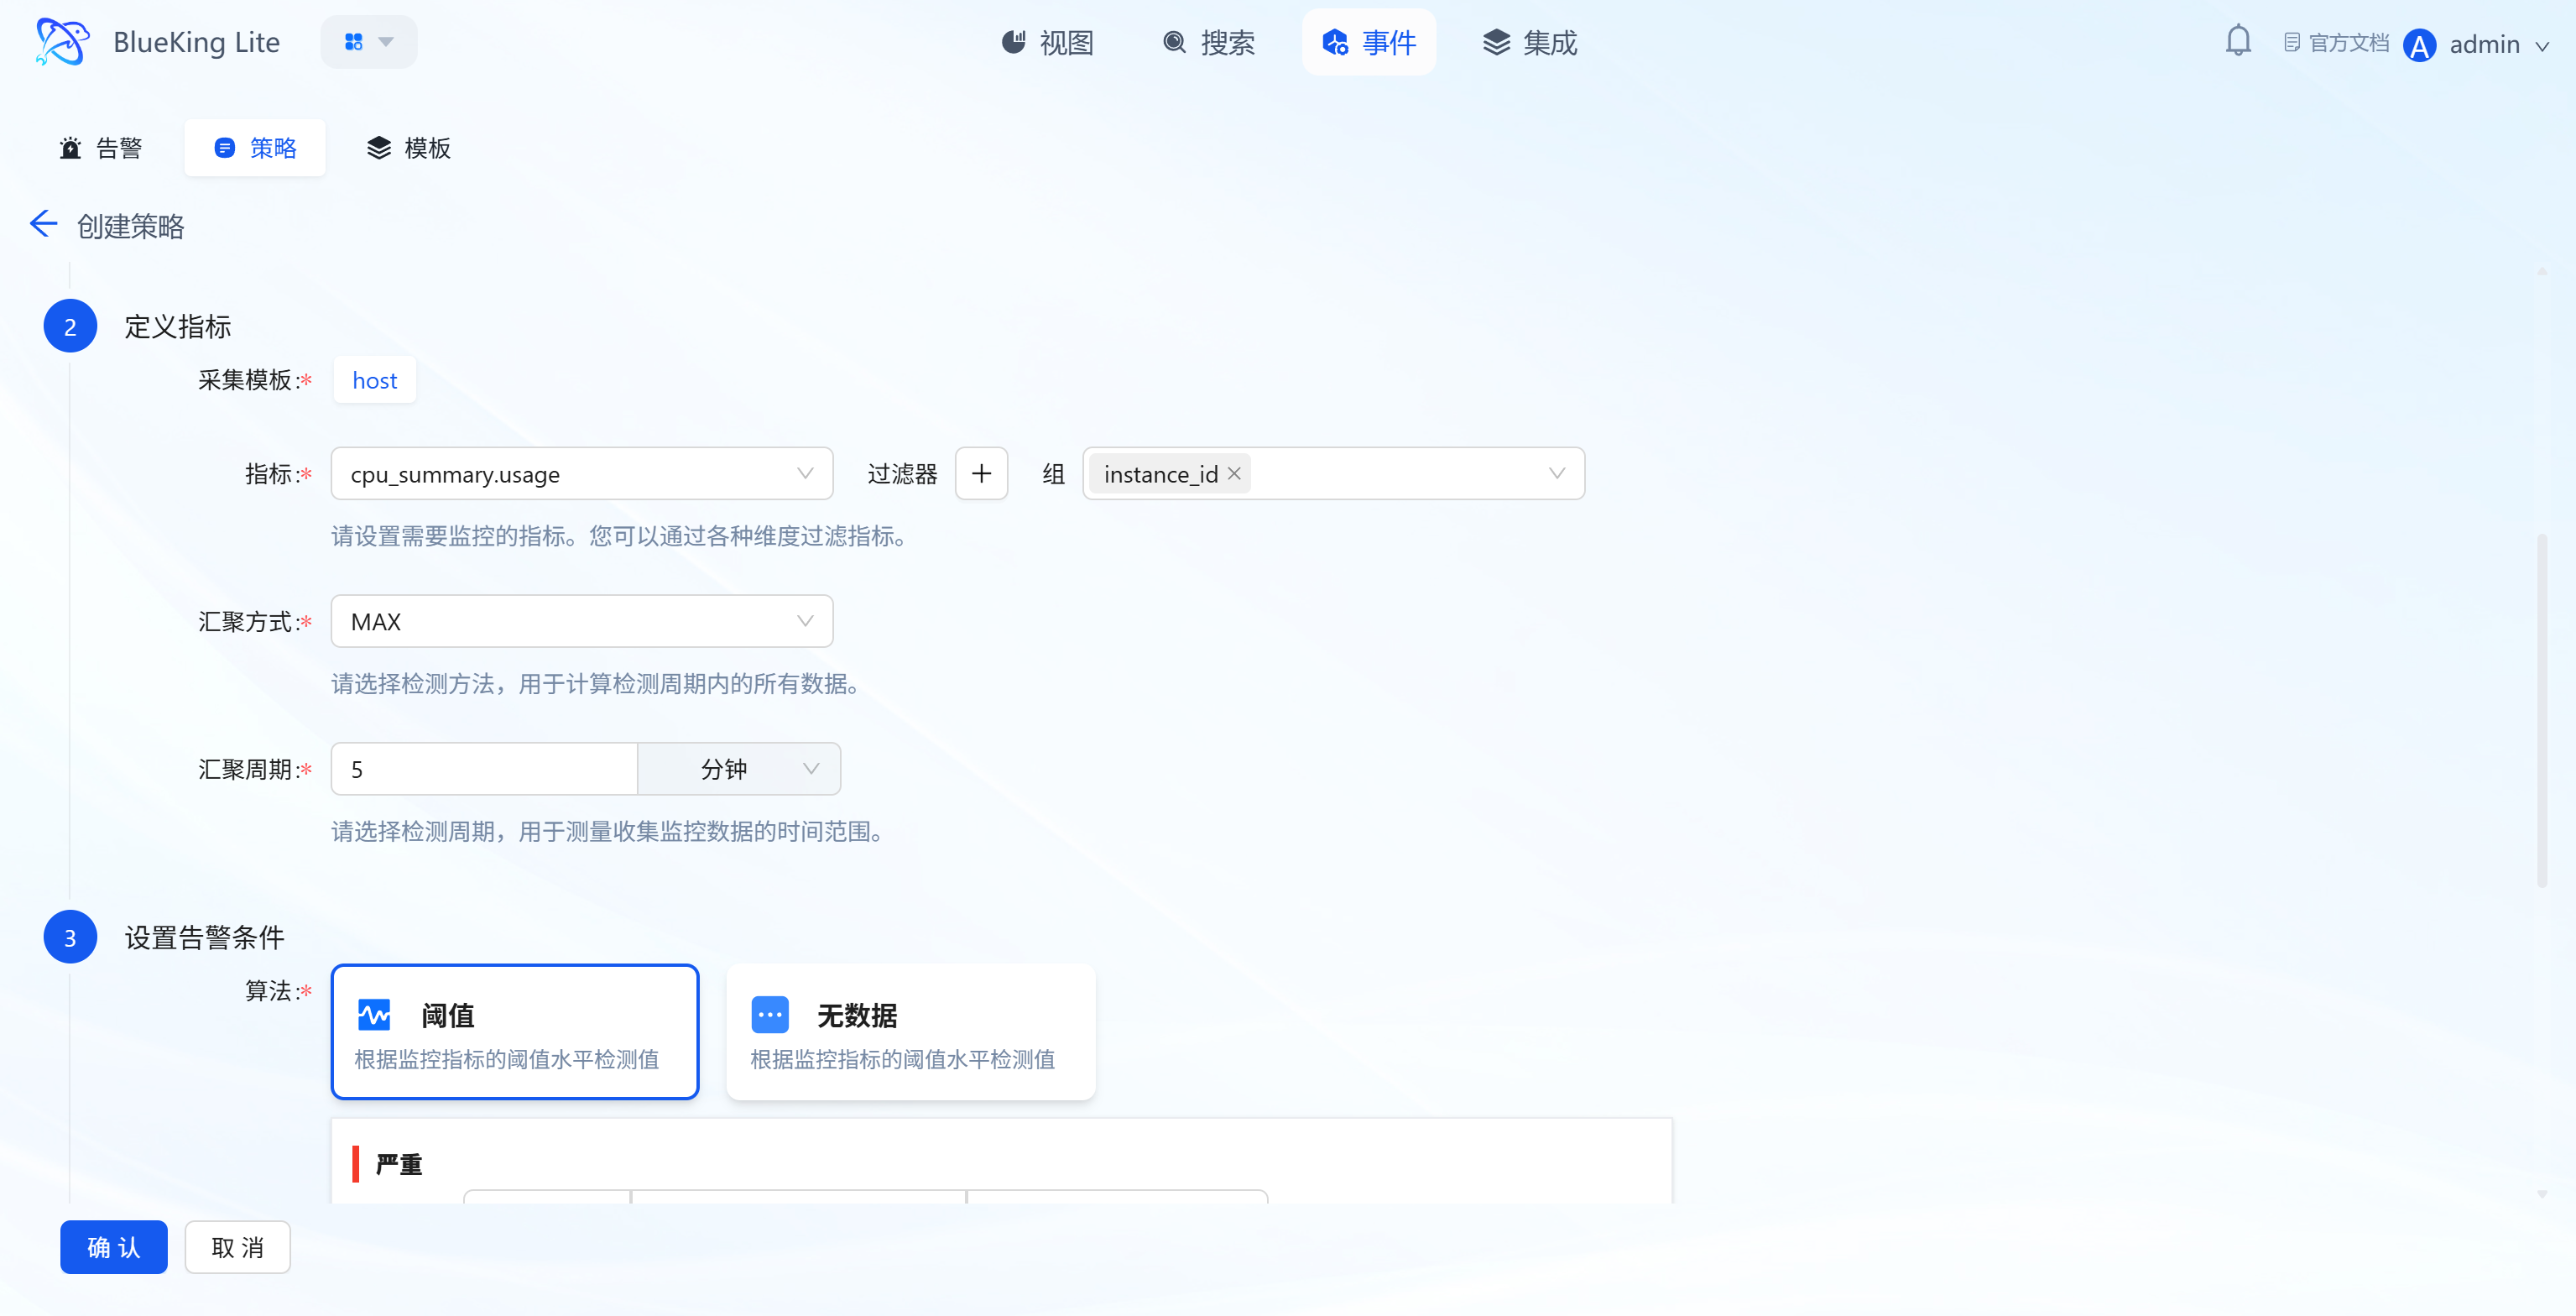
Step 2: Define Metric Rules
- Collection Template: Select the corresponding collection plugin (e.g., "host" for host collection);
- Metric: Select the specific monitoring metric (e.g., "cpu_summary.usage" for CPU usage);
- Filter/Group: Filter/group metric data by dimensions (e.g.,
instance_id); - Aggregation Method: Select the metric calculation method within the detection period (e.g., "MAX" for maximum value);
- Aggregation Period: Set the time range for metric data aggregation (e.g., "5 minutes").
-
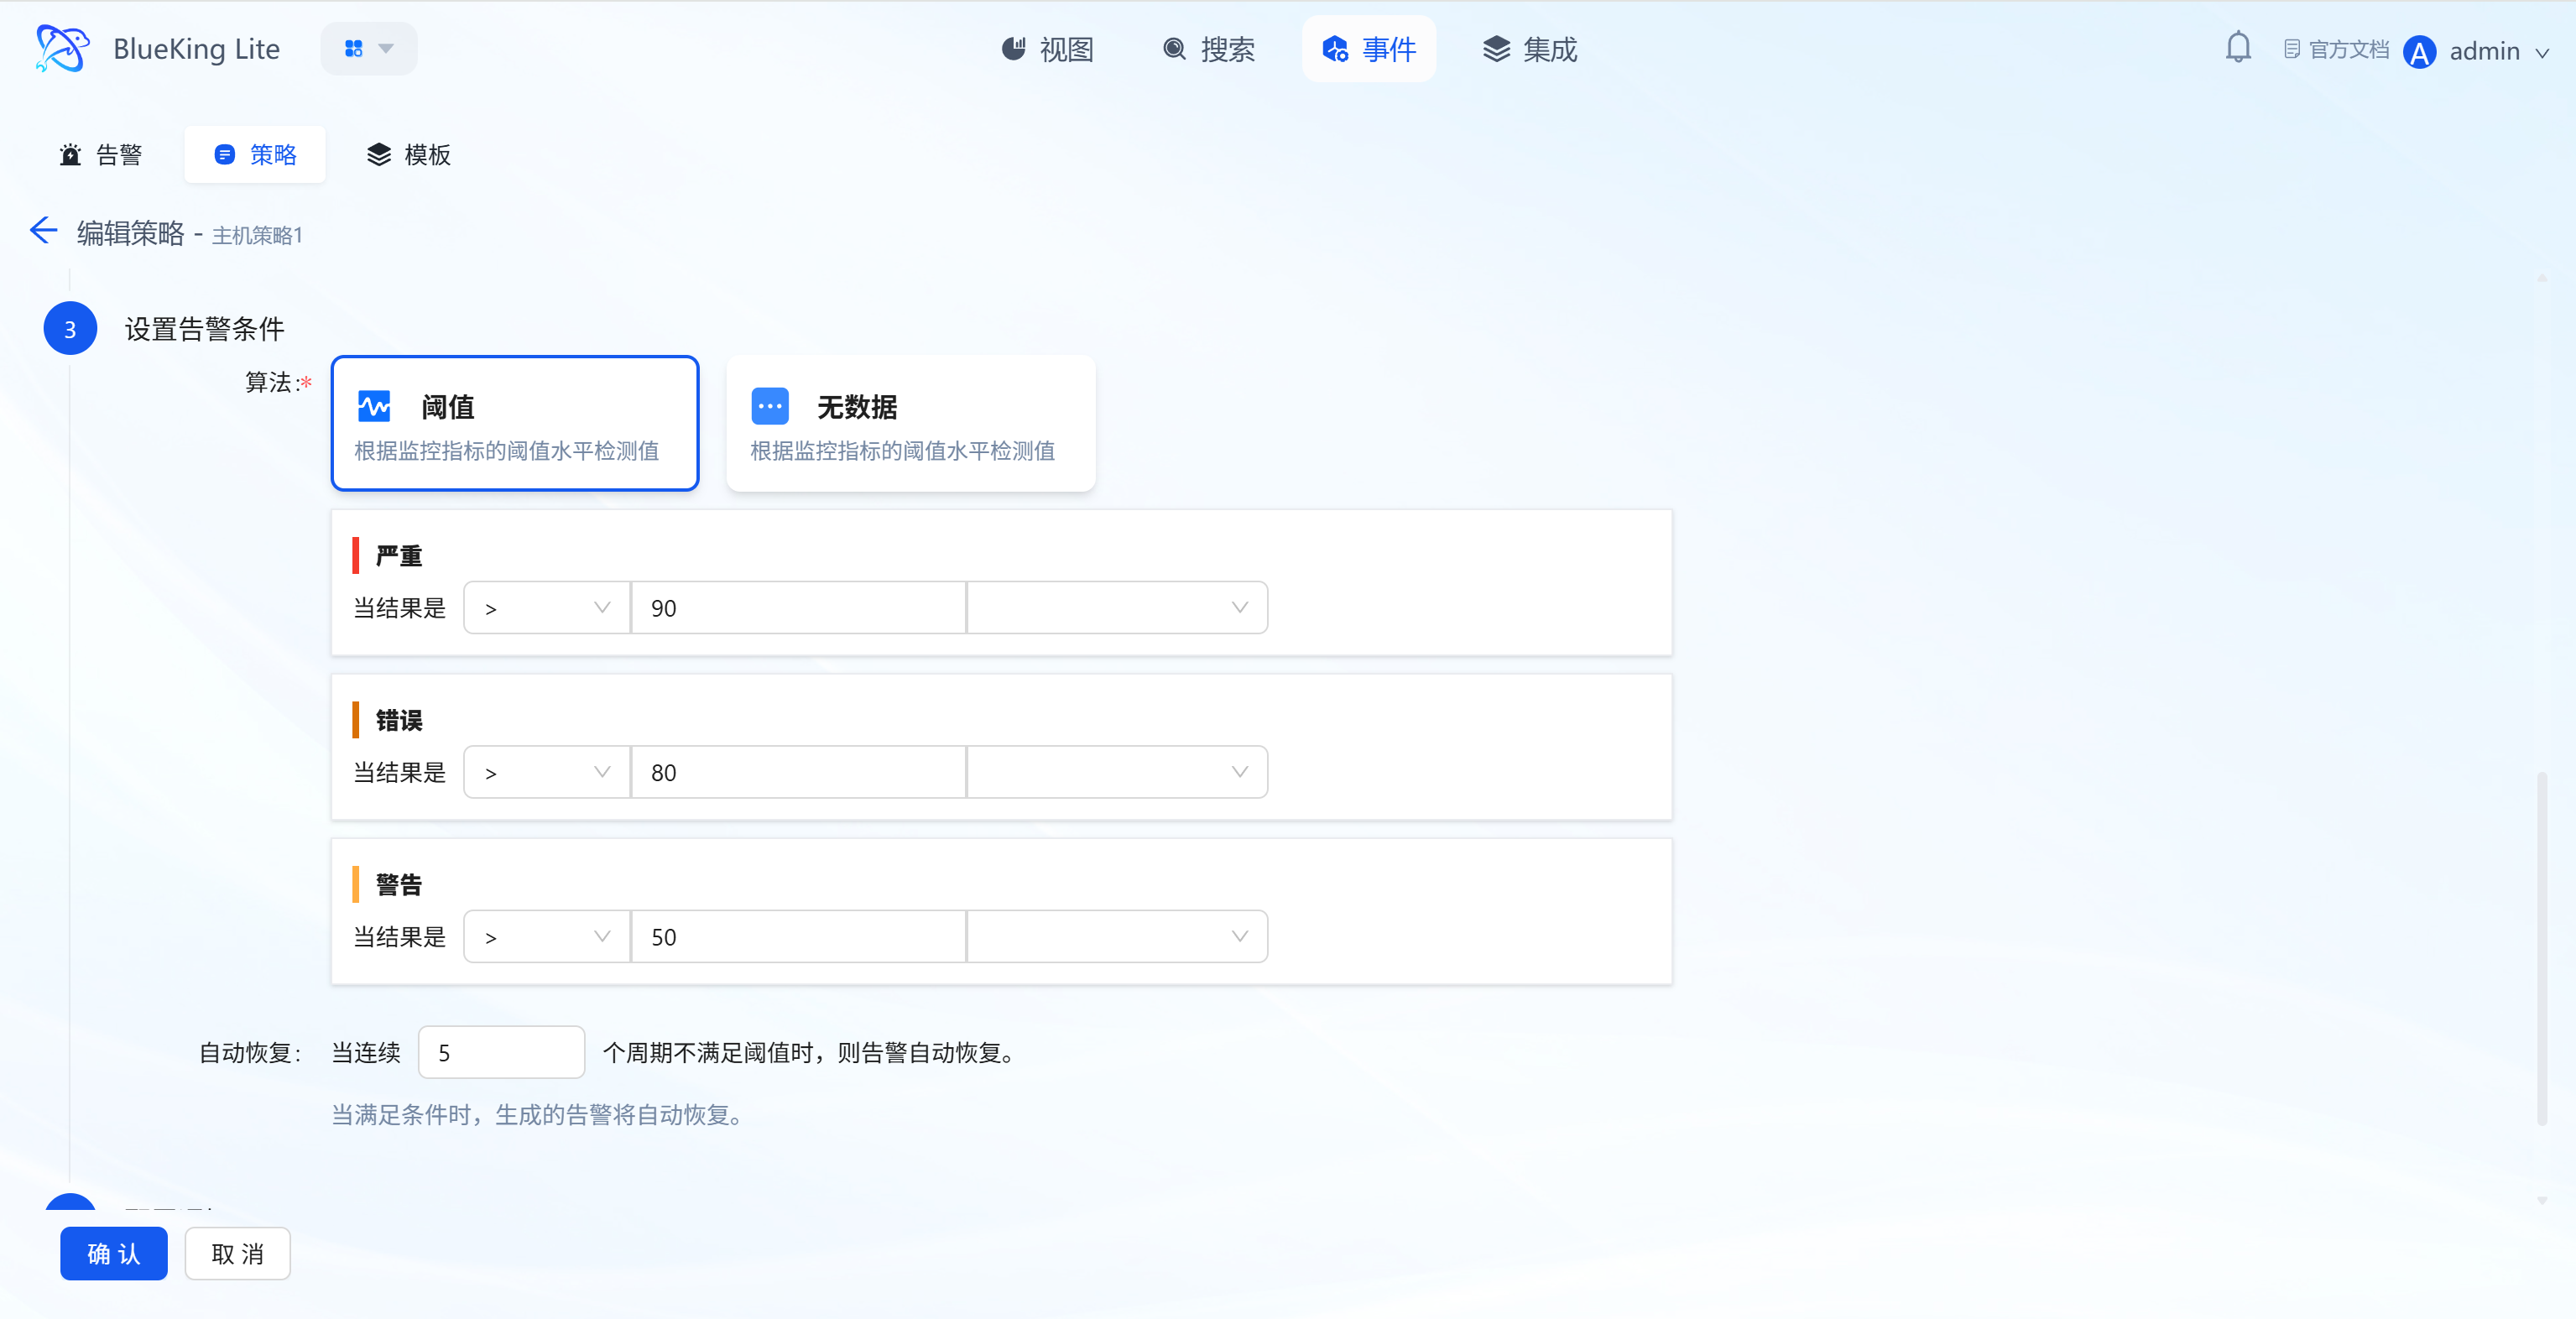
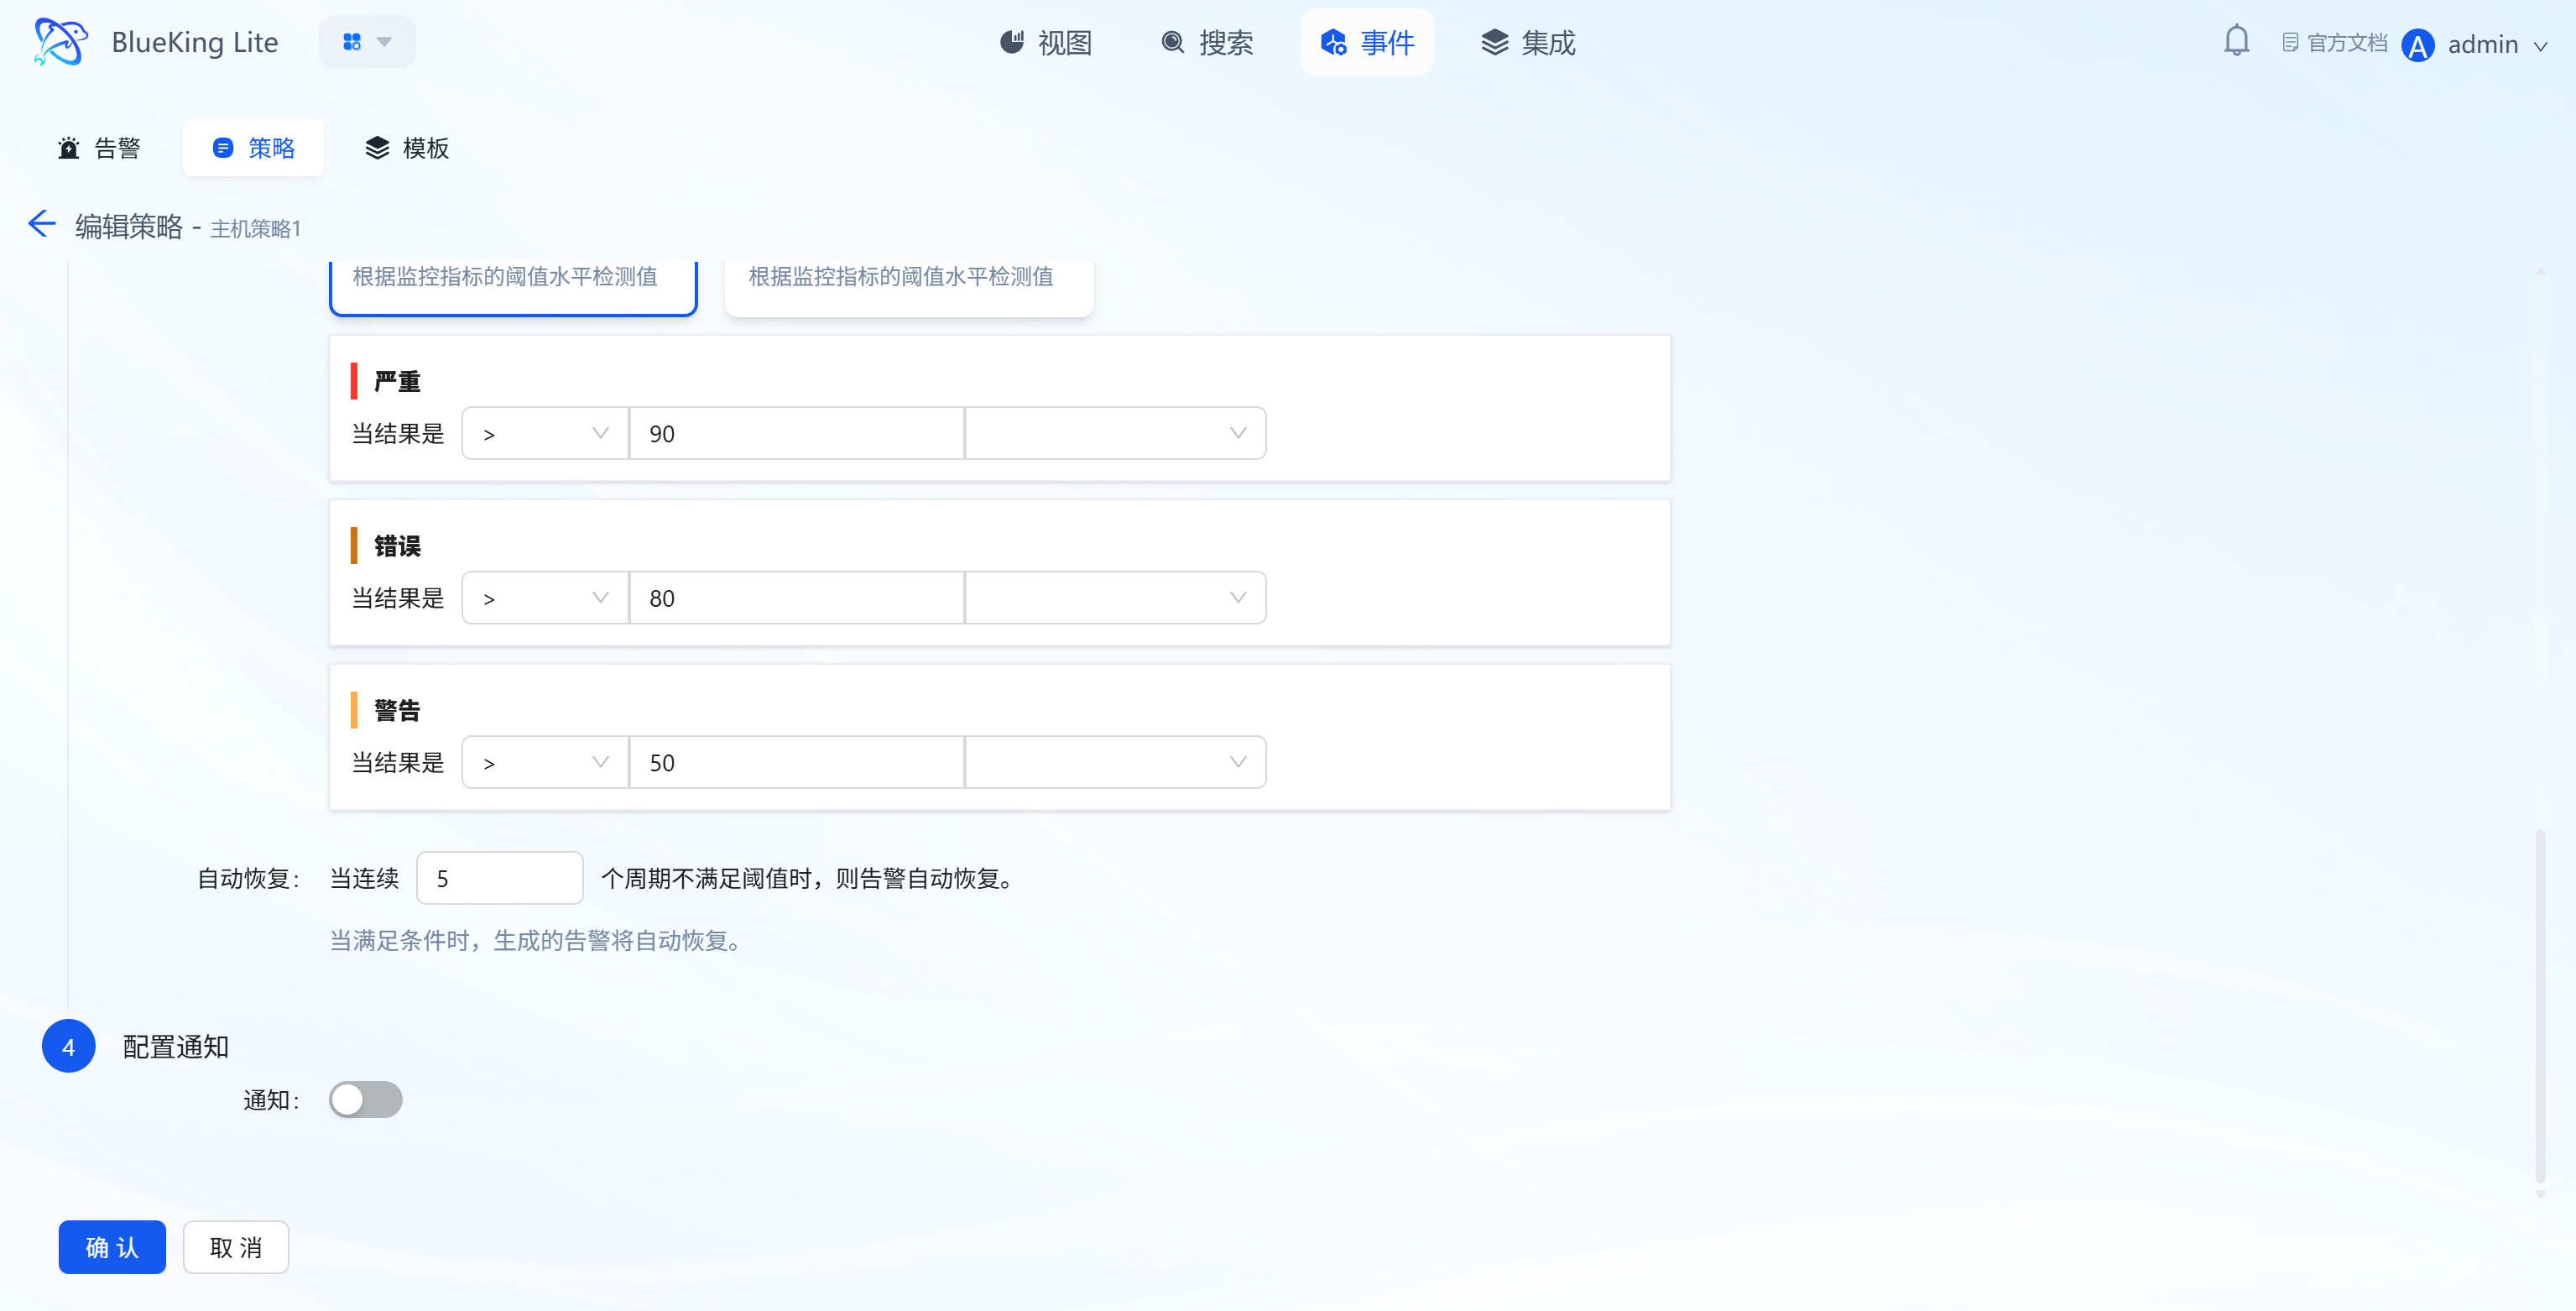
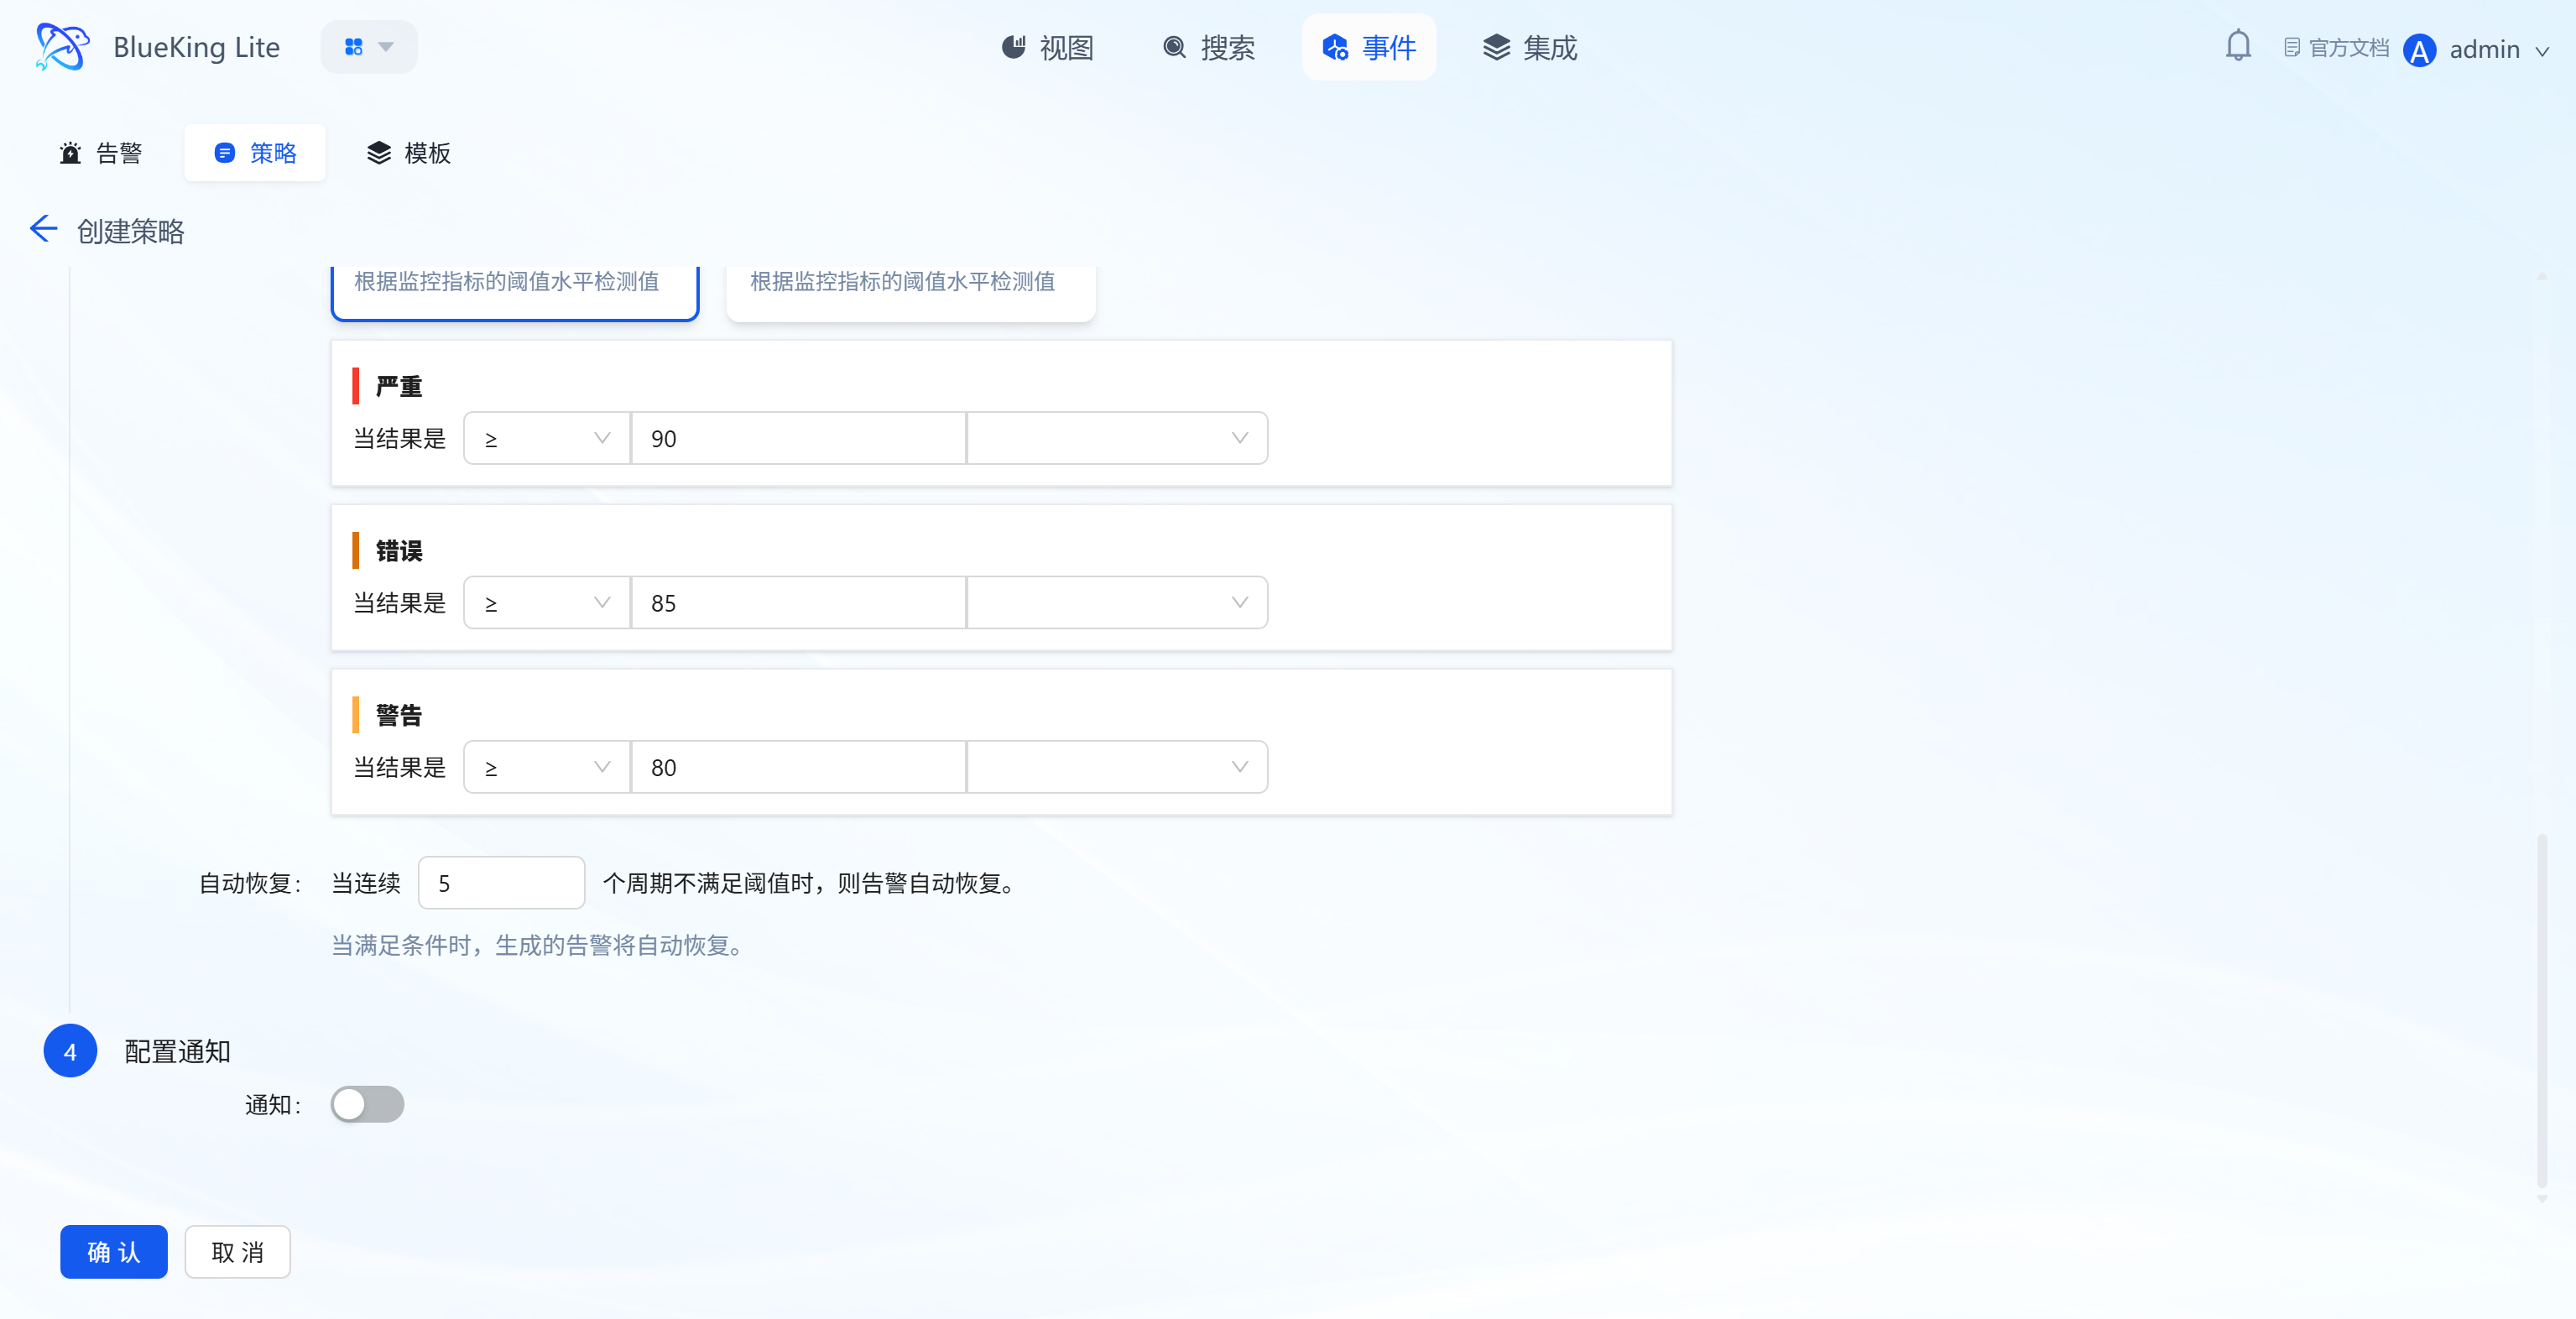
Step 3: Set Alert Conditions
- Threshold Configuration: Based on detection algorithms, set conditions for metric values (e.g., Critical level "≥90", Error level "≥85", Warning level "≥80") to trigger threshold alerts;
- No-Data Alert: Supports independent policy-level no-data alert configuration, triggering when the entire resource or collection item has not fully reported within a specified period, preventing missed alerts due to collection plugin failures;
- Auto-Recovery: Set "alert automatically recovers after N consecutive periods not meeting the threshold" (e.g., "5 periods");
- Policy Preview: After configuring query conditions, aggregation algorithm, grouping dimensions, query period and calculation units, click "Preview" to view the metric query results corresponding to the current parameters. Preview is executed by the backend using the same query semantics as actual policy scanning, returning the generated query statement, time-series data points, and alert hints (such as warnings when unit conversion is not possible). This effectively avoids frontend-assembled PromQL that may generate invalid expressions for complex algorithms like
_over_time, ensuring preview results match online scanning results and allowing policy validity verification before formal saving.
-
Step 4: Configure Notifications
- Enable/disable the "Notification" toggle. Notification channels are sourced from channels already configured in system administration for alert delivery.
After completing the 4-step configuration, click "Confirm." The policy will automatically run at the detection frequency and generate alerts when anomalies are triggered.
3.3.3 Alert Lifecycle Notifications
Alert notifications are triggered by alert (MonitorAlert) lifecycle state changes rather than every event scan, fundamentally eliminating duplicate notification storms. Notification configuration (channels + recipients) is snapshotted from the policy when the alert is created; throughout the entire lifecycle, this snapshot configuration is used and is unaffected by subsequent policy notification method changes.
| Action | Trigger Condition | Description |
|---|---|---|
| created (Alert Created) | When a new alert is generated | Notification title includes policy name, resource, alert level, and time |
| upgraded (Alert Upgraded) | When alert level weight increases | Notifies old level → new level change |
| closed (Alert Closed) | Manual close / Policy deleted / Policy disabled / Config change convergence | Notifies operator, reason, and time |
| recovered (Alert Recovered) | After N consecutive periods not meeting threshold / No-data recovery | Notifies duration |
Notification Continuity Assurance: After disabling the policy notification toggle (notice=false), new alerts no longer trigger created notifications; however, previously successfully notified active alerts can still send final-state notifications to their original channels when recovered or closed, preventing "permanently active" zombie alerts in the alert center.
3.4 Template Library (Event Page "Template" Tab)
Under the "Template" sub-tab, you can reuse pre-configured alert rule templates to lower the configuration barrier.
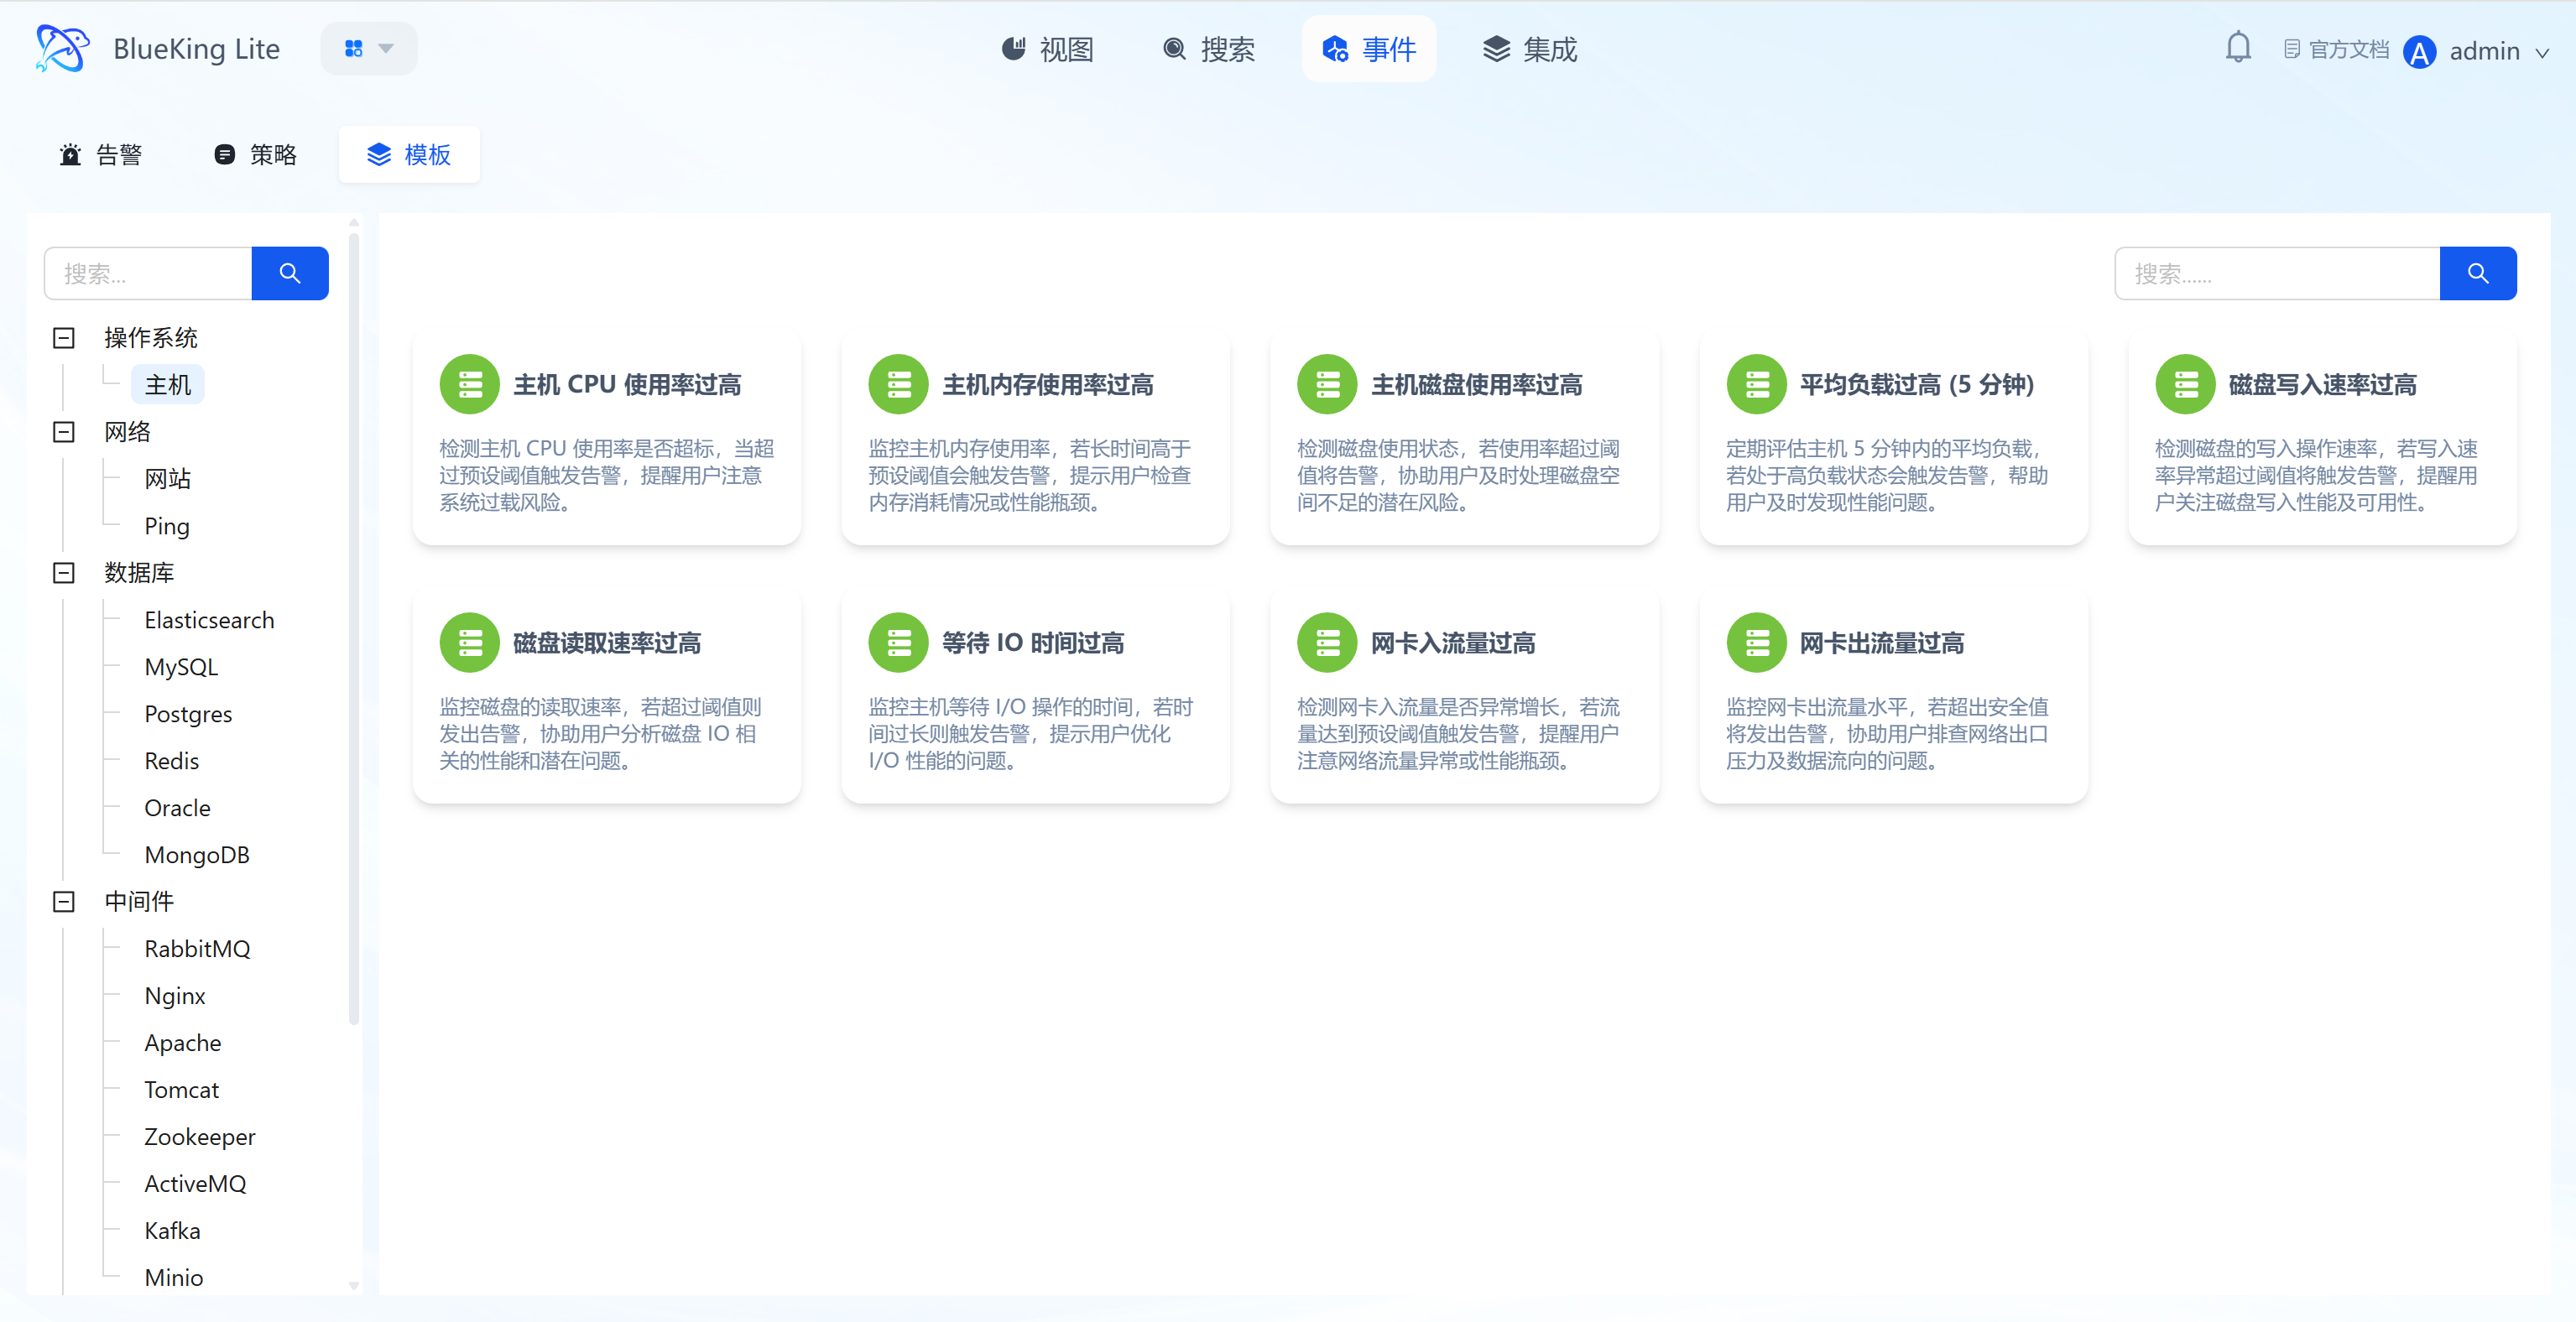

Core Capabilities
- Pre-Configured Mainstream Templates: Categorized by asset type, providing core scenario templates such as "Host CPU Usage Too High, Memory Usage Too High";
- Template Detail Descriptions: Each template is annotated with "Detection Logic + Risk Prompts" (e.g., "Host CPU Usage Too High: Detects if CPU exceeds threshold, warns of system overload risk");
- Quick Reuse: Alert policies can be generated directly from templates without repeating basic rule configuration;
- Batch Apply Templates: Supports multi-selecting templates on the template page and creating policies in bulk through a three-step wizard.
- Step 1 Confirm Templates: Review and optionally remove selected templates; template thresholds, algorithms, and alert levels retain original values and cannot be modified at this step;
- Step 2 Select Assets: Uniformly specify target monitoring assets for all selected templates (e.g., 20 hosts) without affecting the final policy count by asset quantity;
- Step 3 Shared Configuration: Uniformly set detection frequency, organization ownership, notification channels, and policy enable status; policy names default to template names with optional custom prefix support (e.g., "Production - CPU Usage Too High");
- Result Feedback: After submission, displays success/failure counts and failure reasons for each template, with option to jump to the policy list to view policies created in this batch.
4. Integration
Integration is the configuration and management hub for monitoring data collection, implementing full-process collection management from "collection template onboarding - onboarded asset management - resource grouping rule configuration" through the "Integration, Assets, Grouping" sub-tabs, providing stable data source support for monitoring scenarios.
4.1 Integration (Collection Template Onboarding)
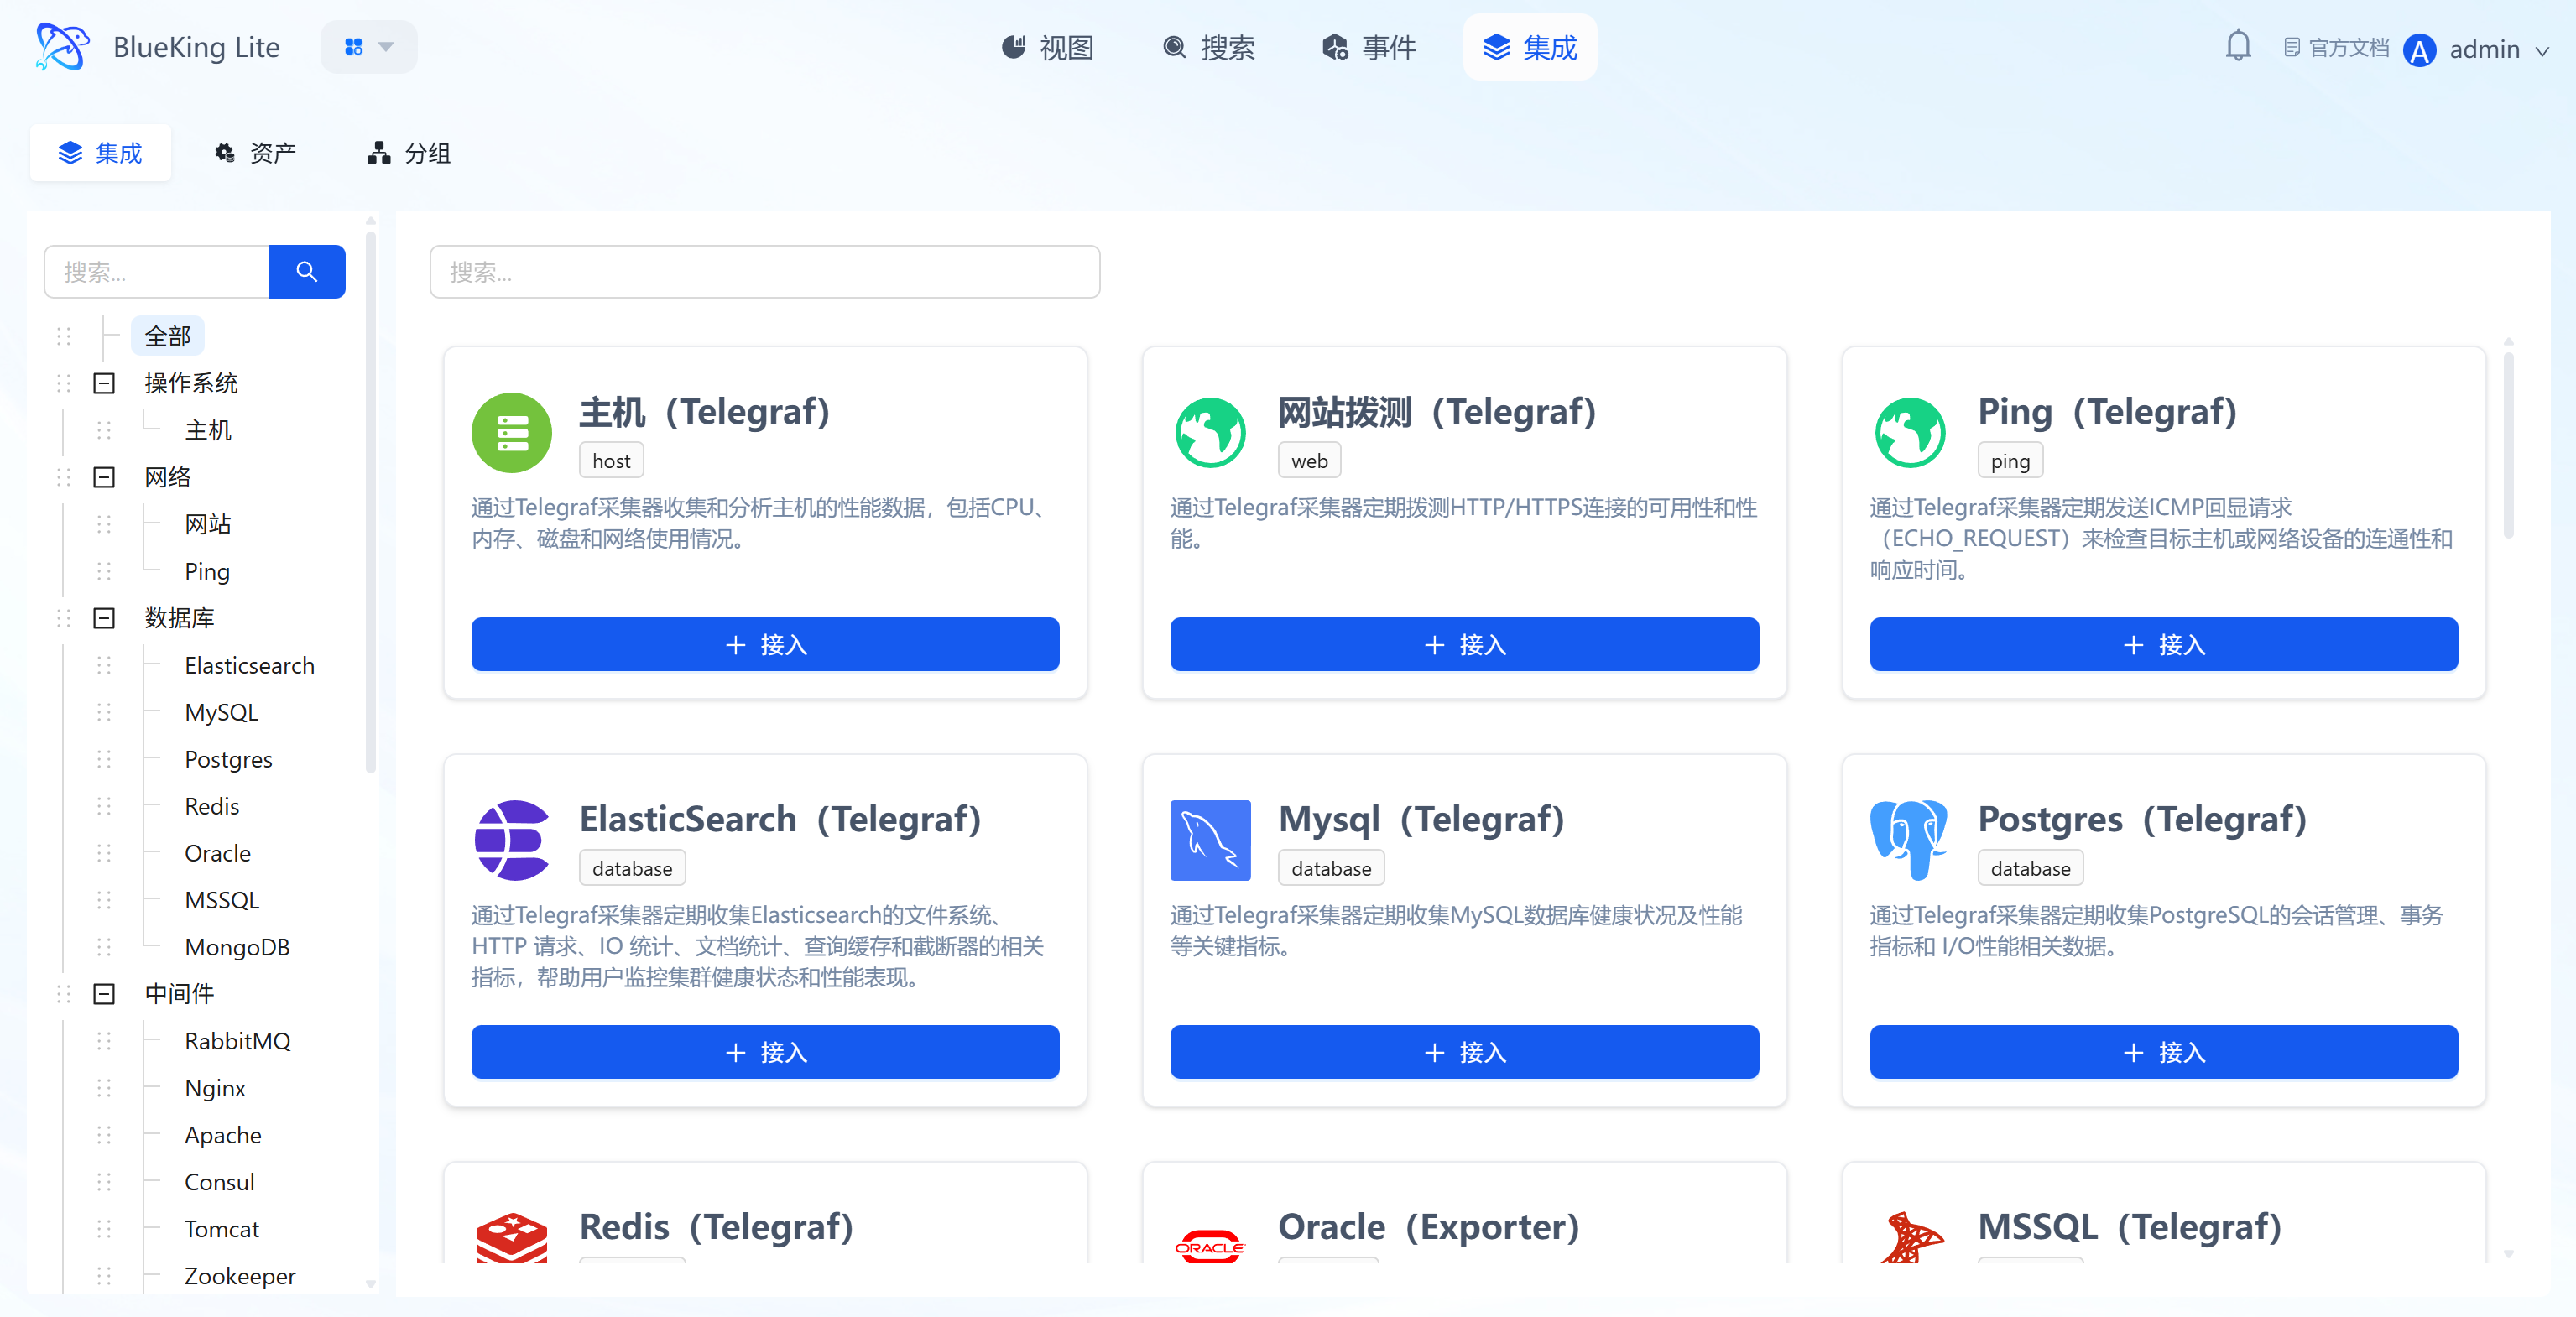
Core Capabilities
- Pre-Configured Full-Stack Collection Templates: Provides standardized collection templates covering "Host (Telegraf), Website Probing, Ping, Database (Elasticsearch/MySQL, etc.), Middleware." Each template card intuitively displays the current status (e.g., whether enabled, whether out-of-the-box) and collection logic (e.g., "Host Template: Collects CPU, Memory, Disk data via Telegraf"). Notably, the Website (Web Probing) plugin supports a "Skip Certificate Verification" (
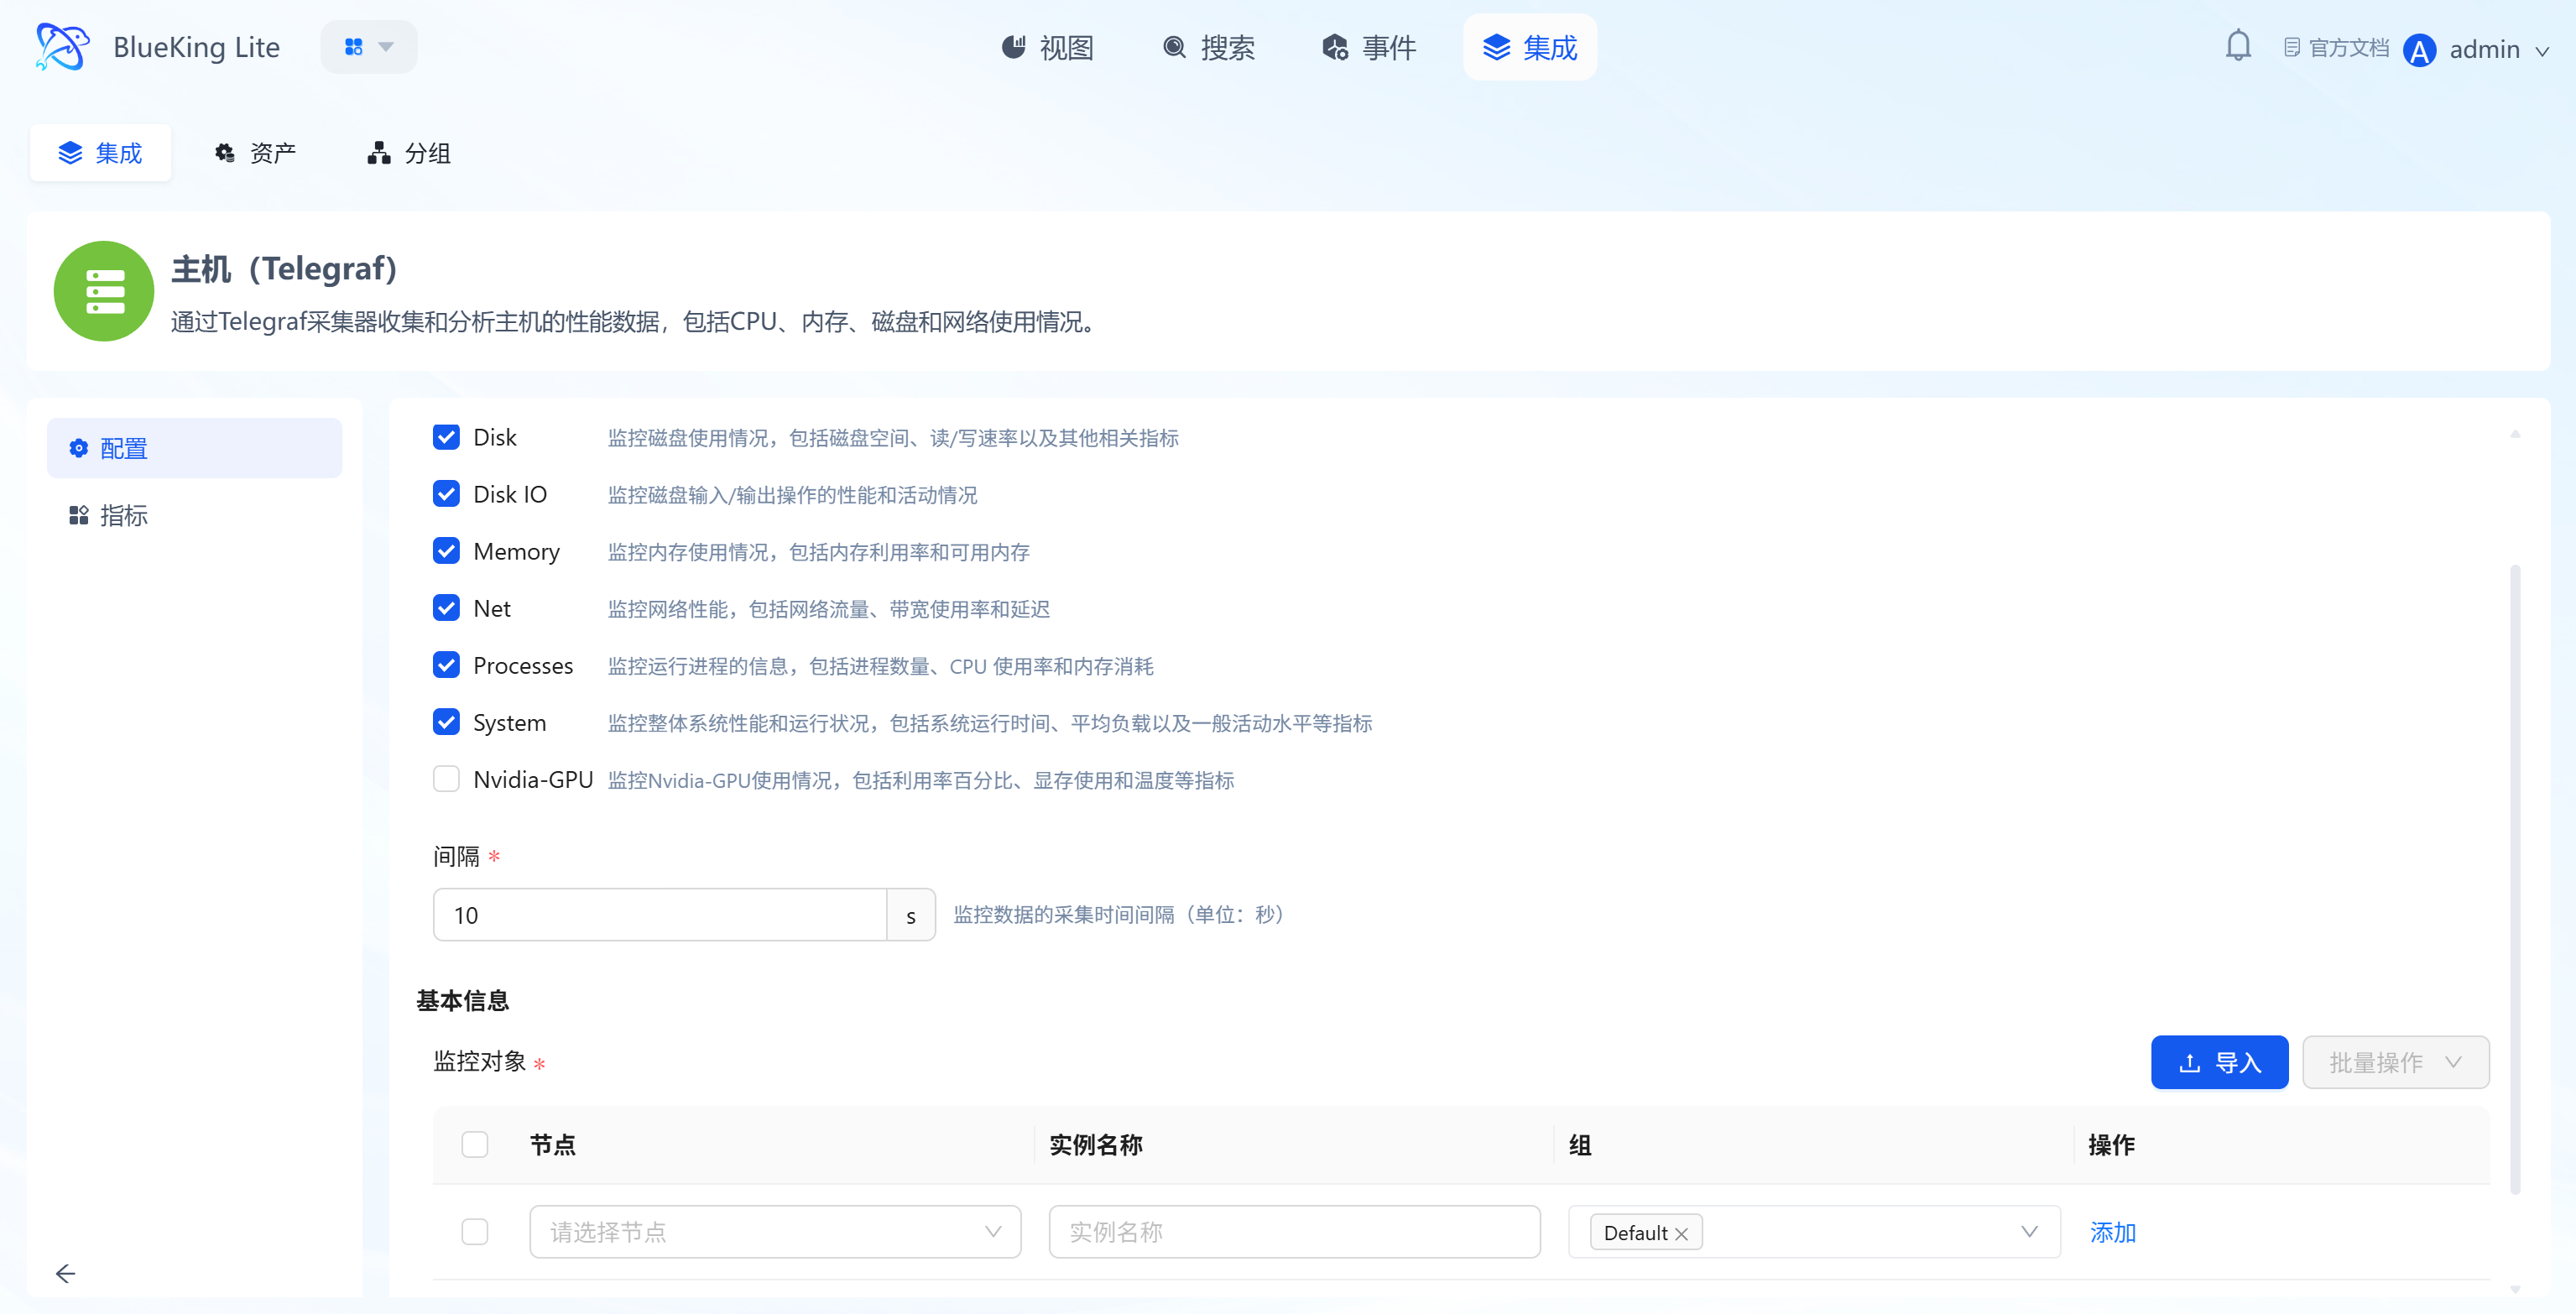
insecure_skip_verify) toggle, allowing bypass of server-side certificate validation in HTTPS scenarios (disabled by default), suitable for self-signed certificate environments; - Flexible Onboarding Methods (Automatic and Manual): Some built-in resources (such as base OS host collection) support fully automatic zero-configuration onboarding, while complex objects provide a wizard-style manual template onboarding process. API-type templates enter the onboarding guide page by default, non-K8s objects enter the auto-configuration page, and K8s objects enter a dedicated three-step wizard. Click the template's "+ Onboard" button to complete 3 types of core configuration:
- Select collection metrics (e.g., Disk/CPU/Memory);
- Set monitoring targets (select target node assets);
- Configure collection interval (e.g., 10s); Once complete, the corresponding asset collection task is created;
- Tiered Detail Capabilities: The template detail page provides "Configure" and "Metric" capabilities by default; when the template type is SNMP, an additional "Collect" entry is provided for collection template maintenance;
- Category-Filtered Templates: The left navigation bar categorizes by "OS/Network/Database" dimensions for quickly locating target type collection templates.
4.2 Assets (Onboarded Resource Management)
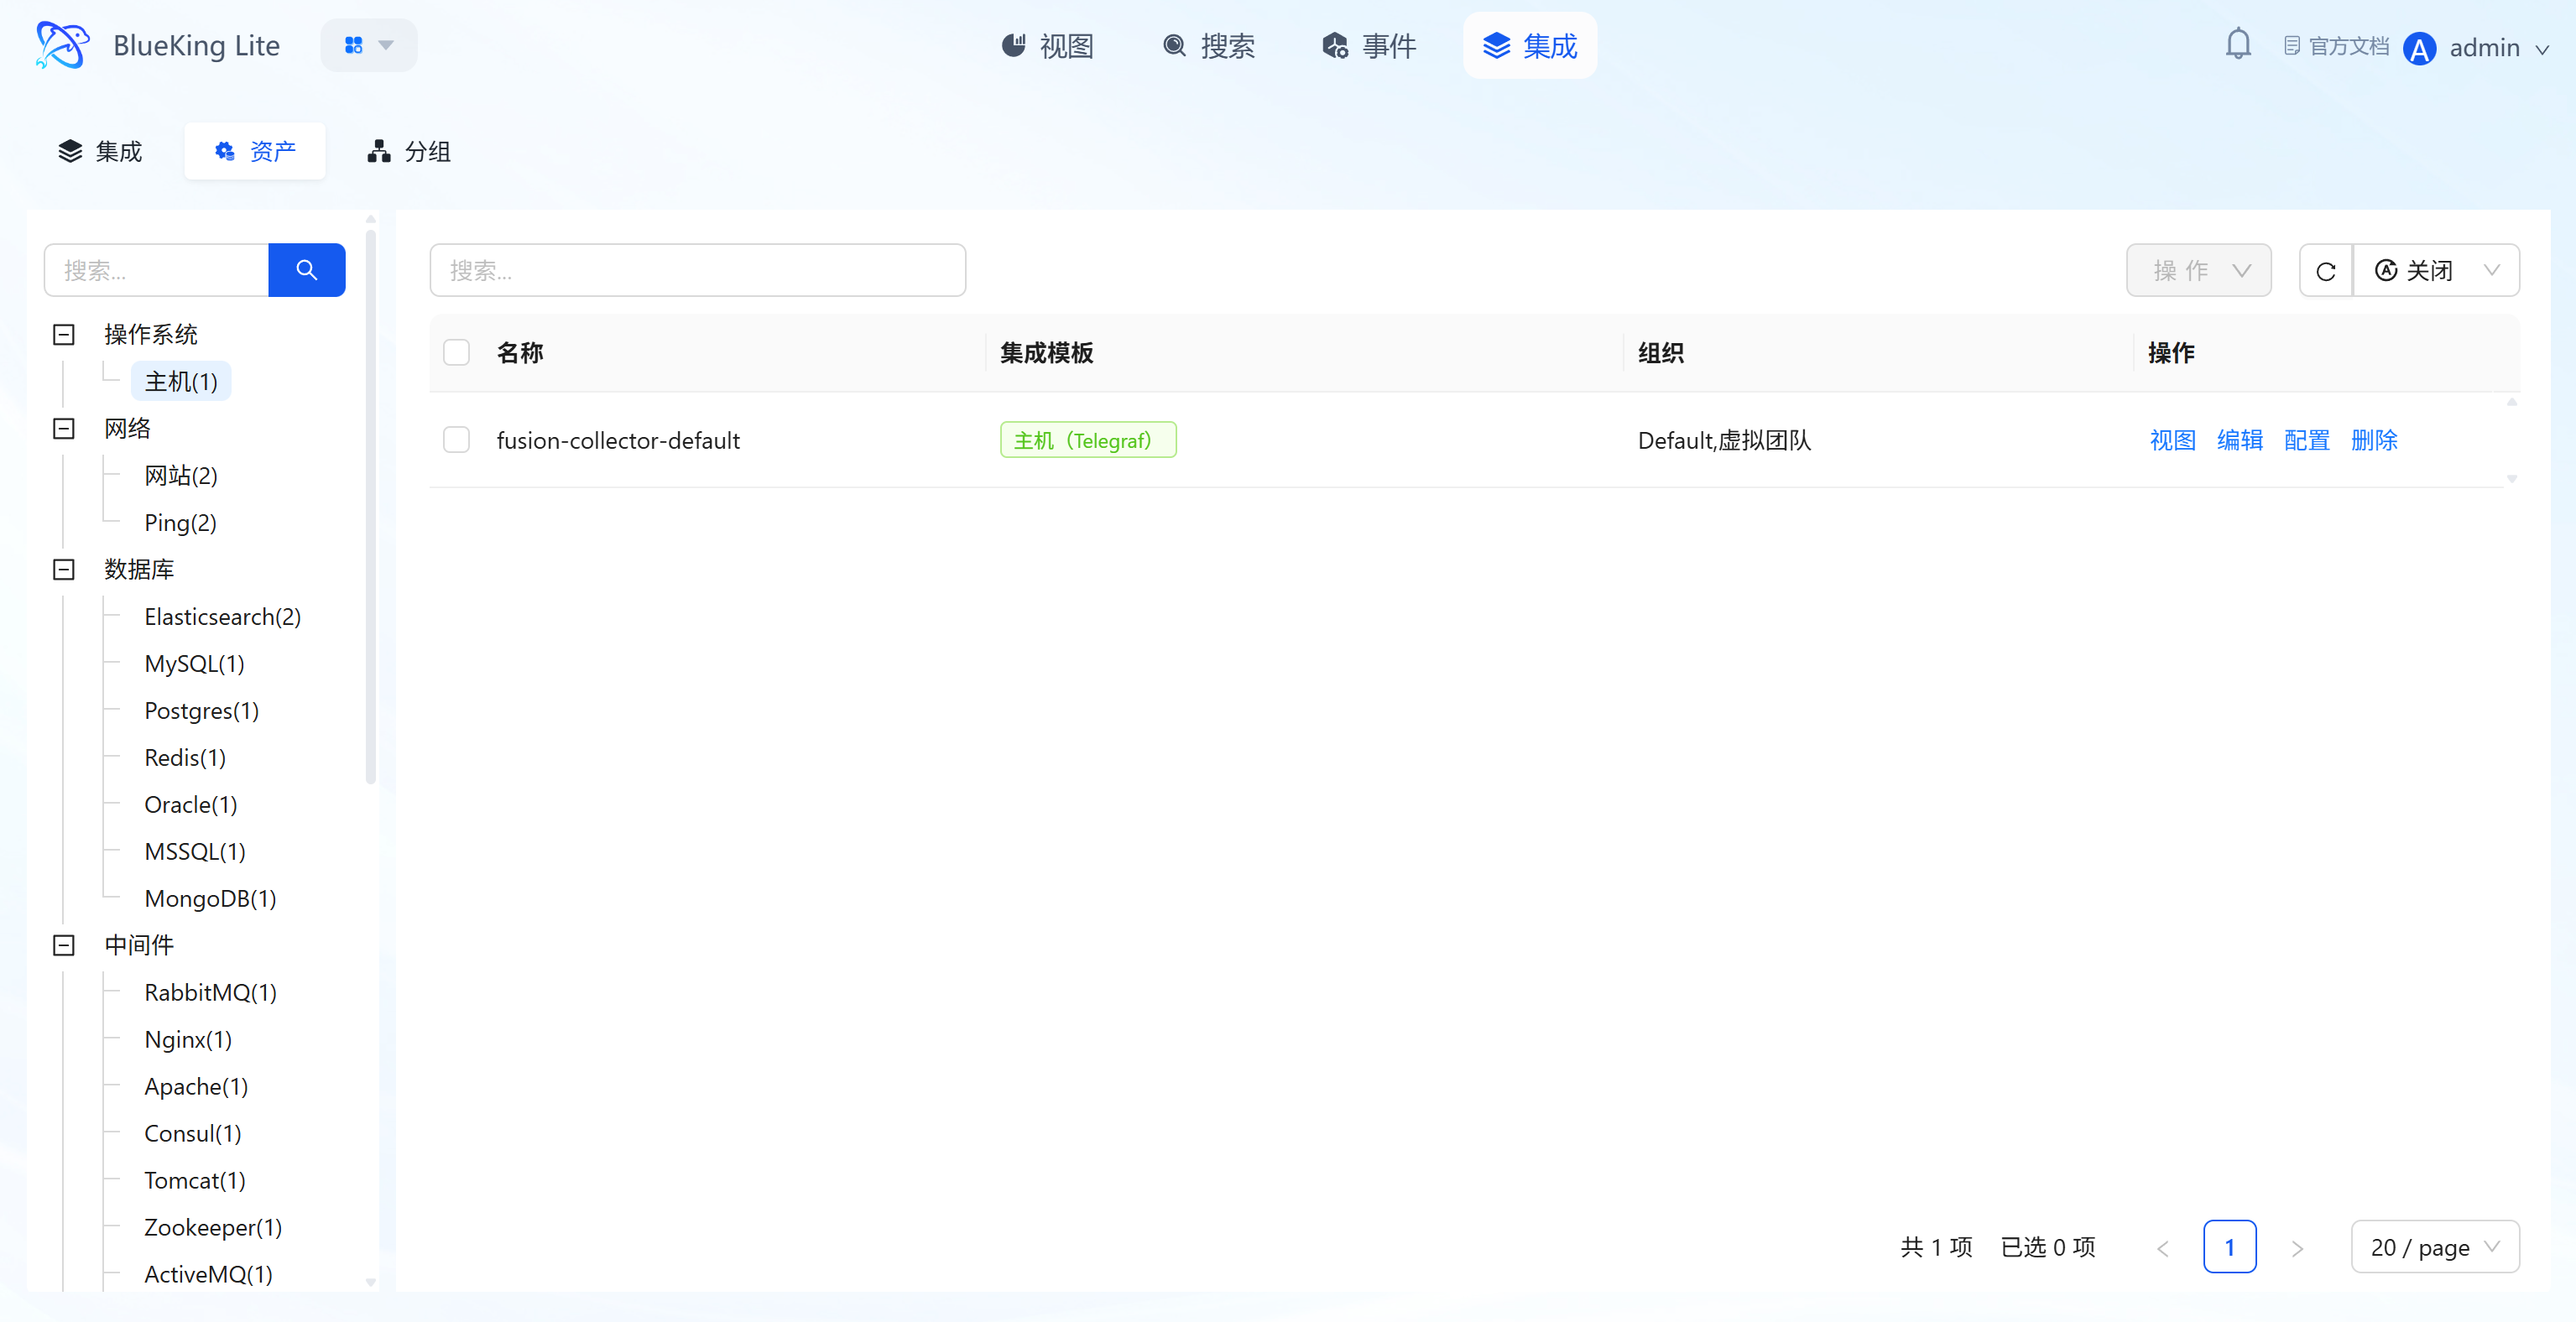
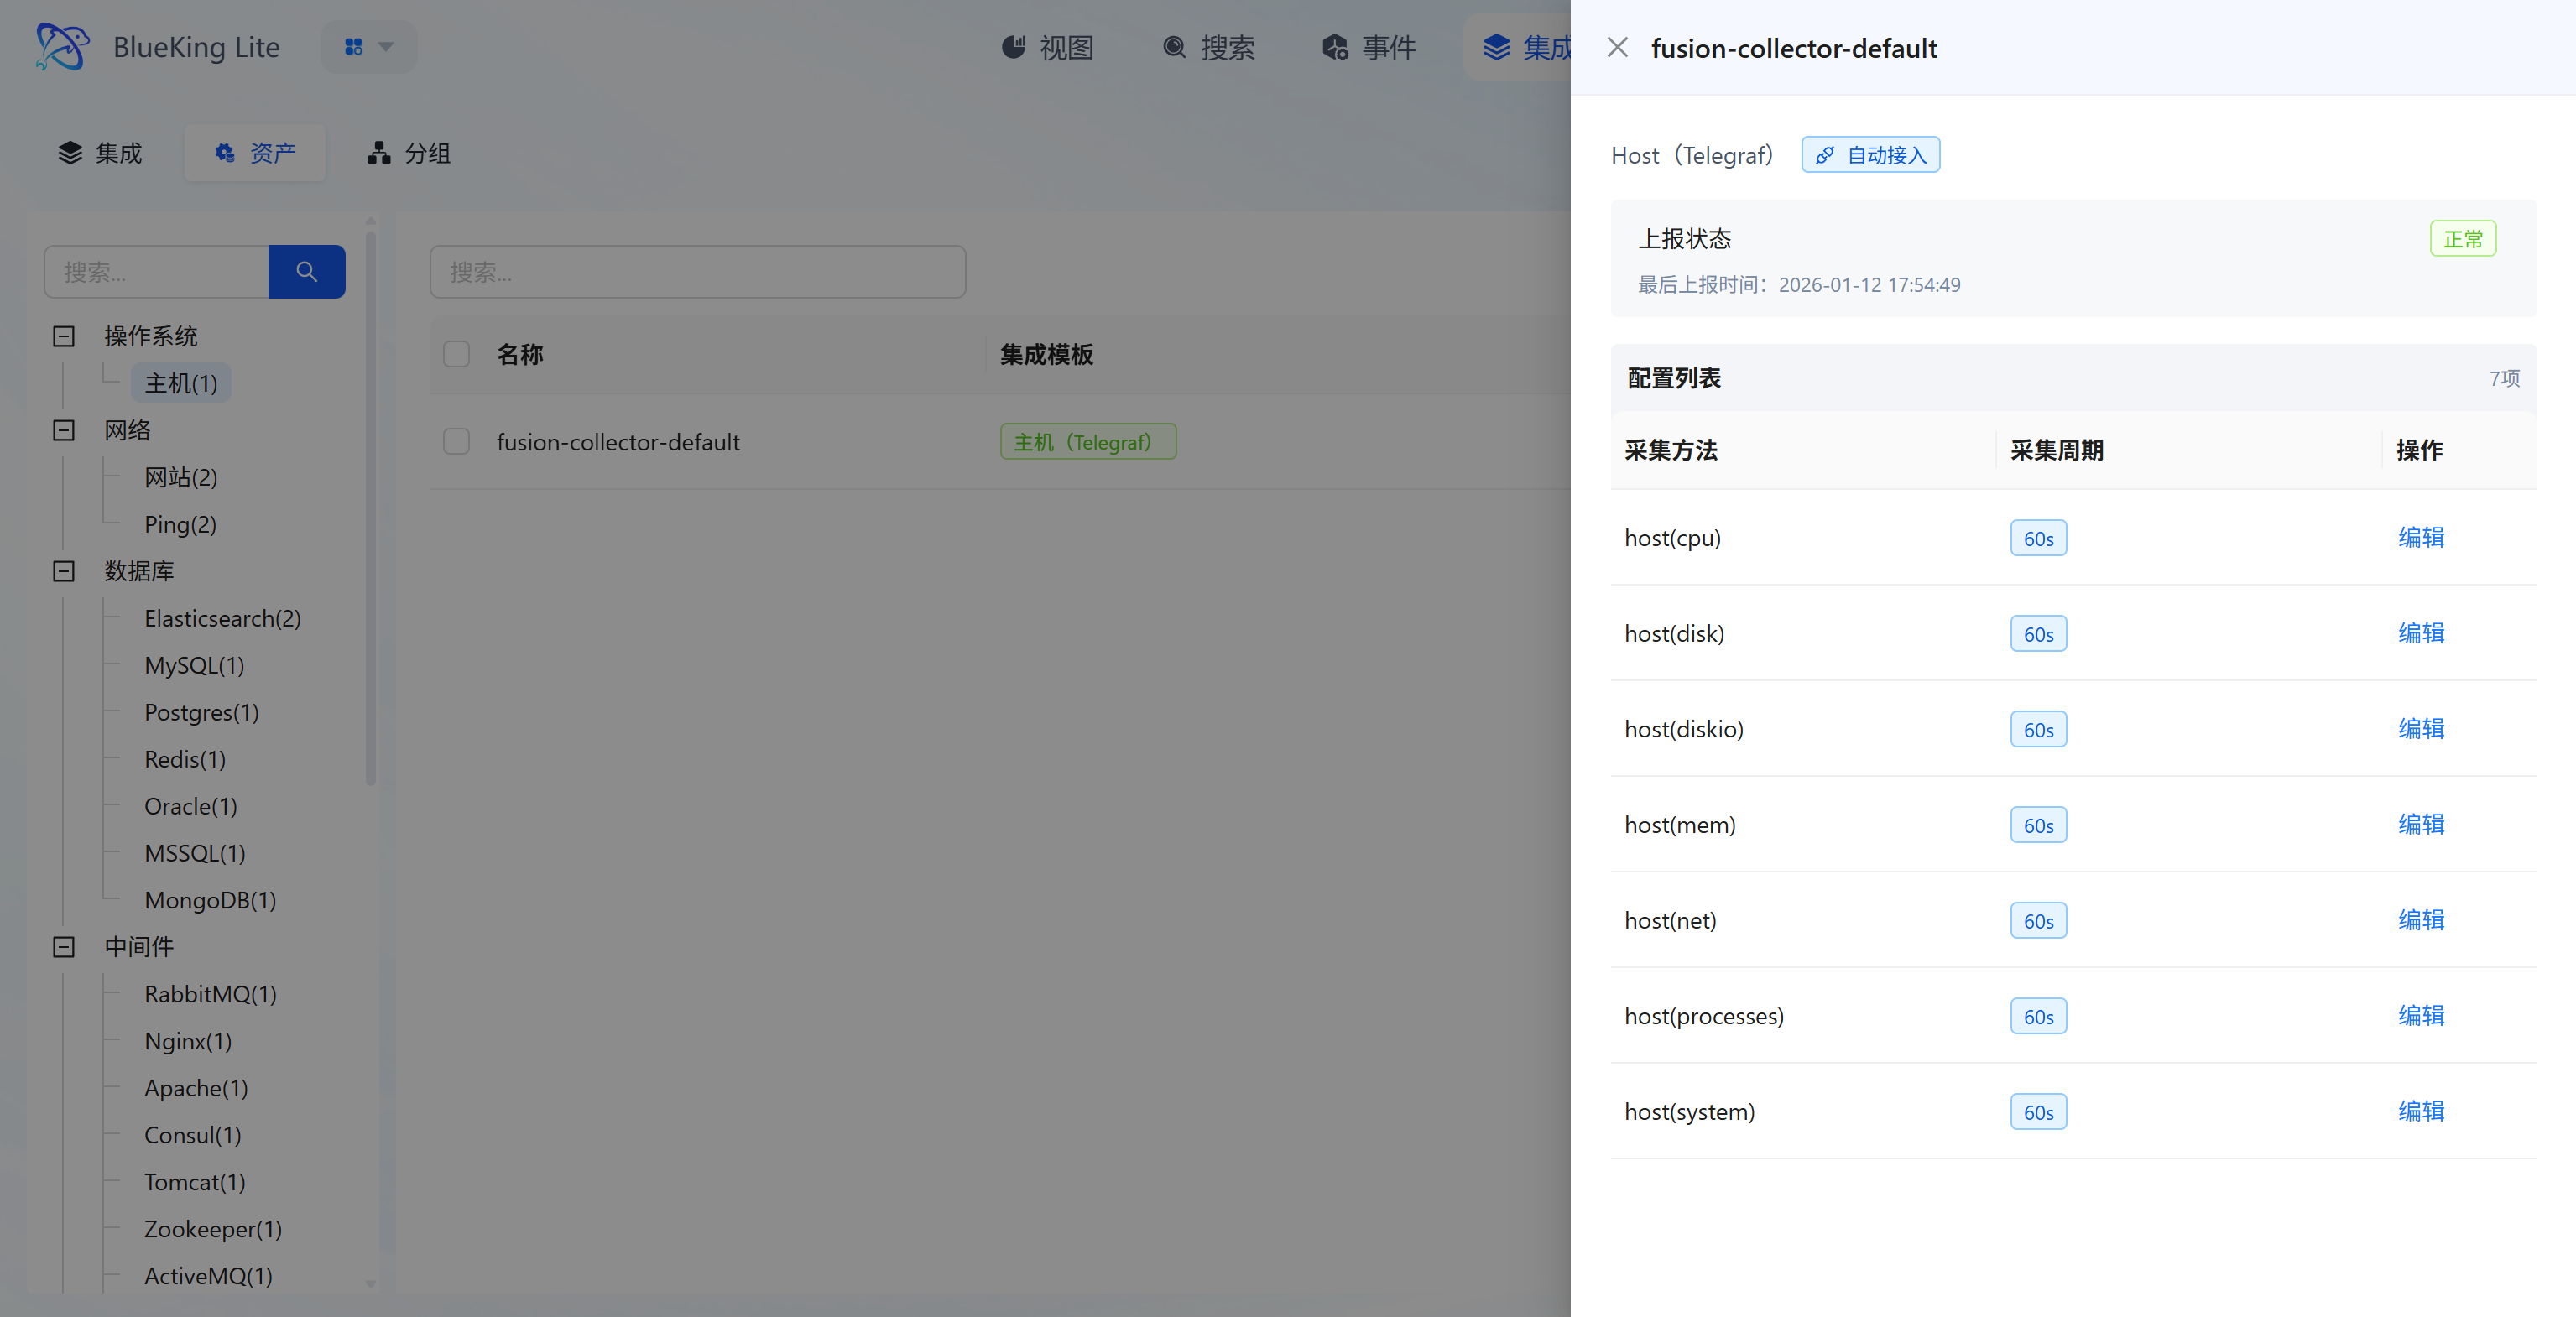
Core Capabilities
- Onboarded Asset Overview: List displays all asset objects associated with configured collection methods, including "Asset Name, Integration Template, Organization," with left-side filtering by asset type such as "Host/Website/Database";
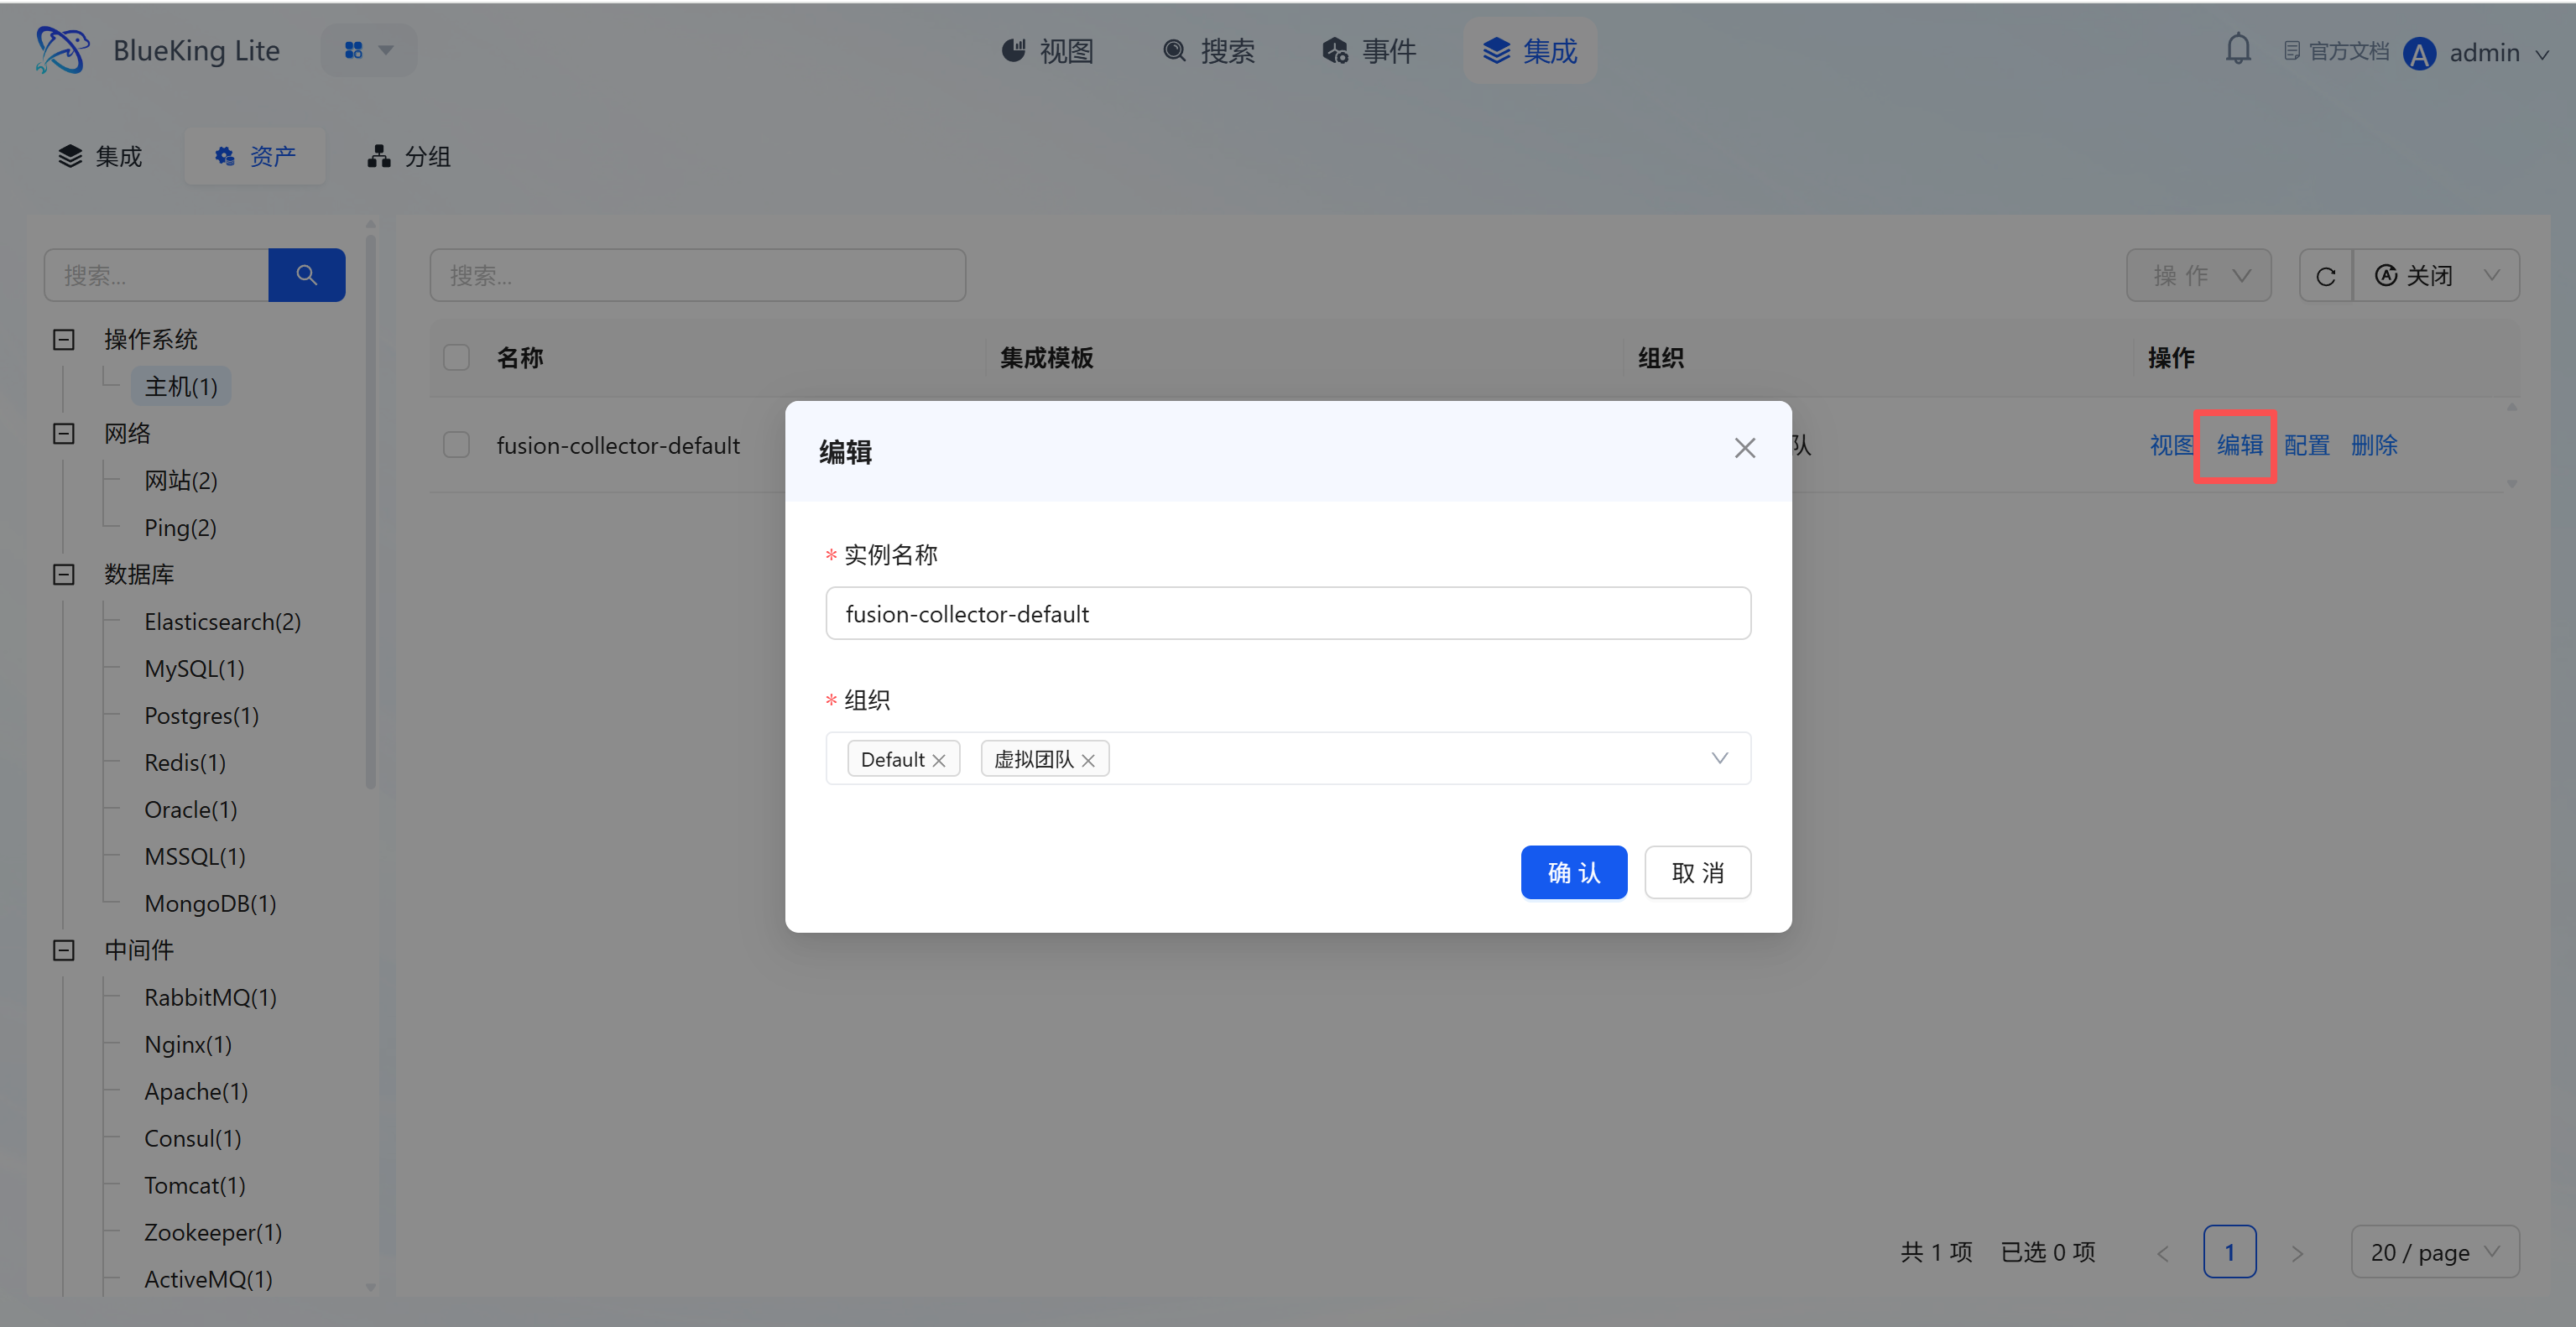
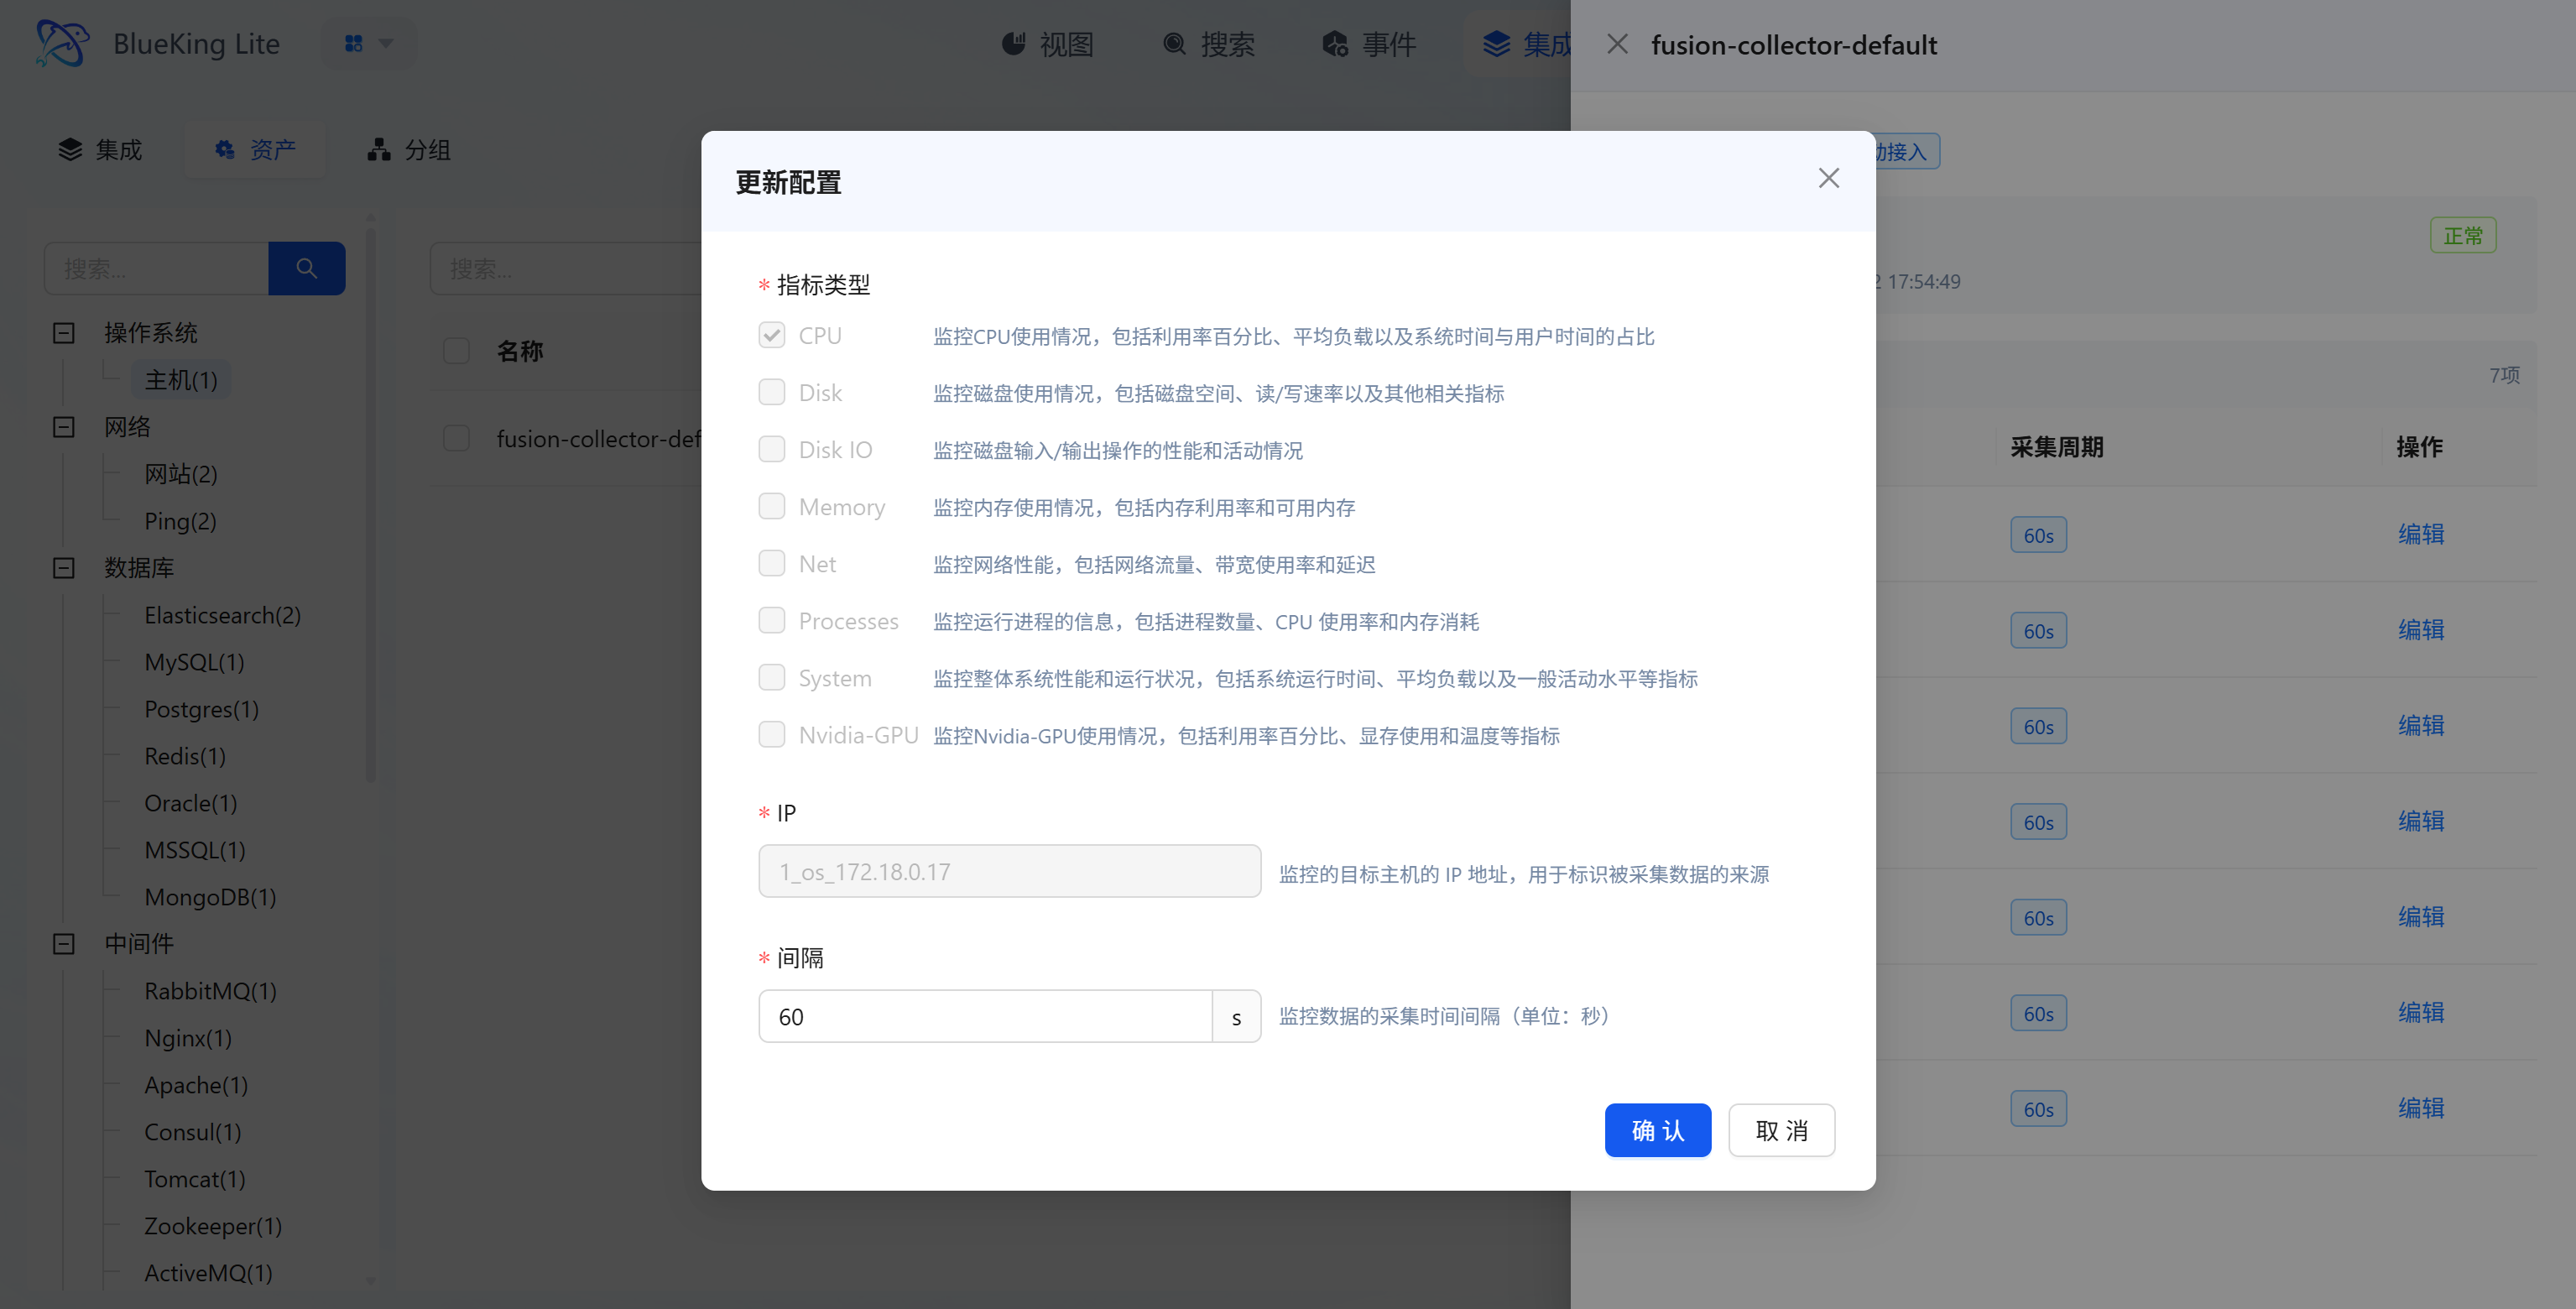
- Asset Full-Lifecycle Operations: Each asset supports 4 types of operations:
- "View": View the asset's collection details and monitoring chart dashboard;
- "Edit": Modify the asset's "Instance Name, Organization";
- "Configure": Adjust specific parameters for the collection target (e.g., monitoring metric type, target IP, collection interval);
- "Delete": Remove invalid collection assets;
- Collection Status Monitoring: The asset detail page displays individual asset "Report Status, Last Report Time" to confirm in real-time whether the asset node's data collection pipeline is functioning normally.
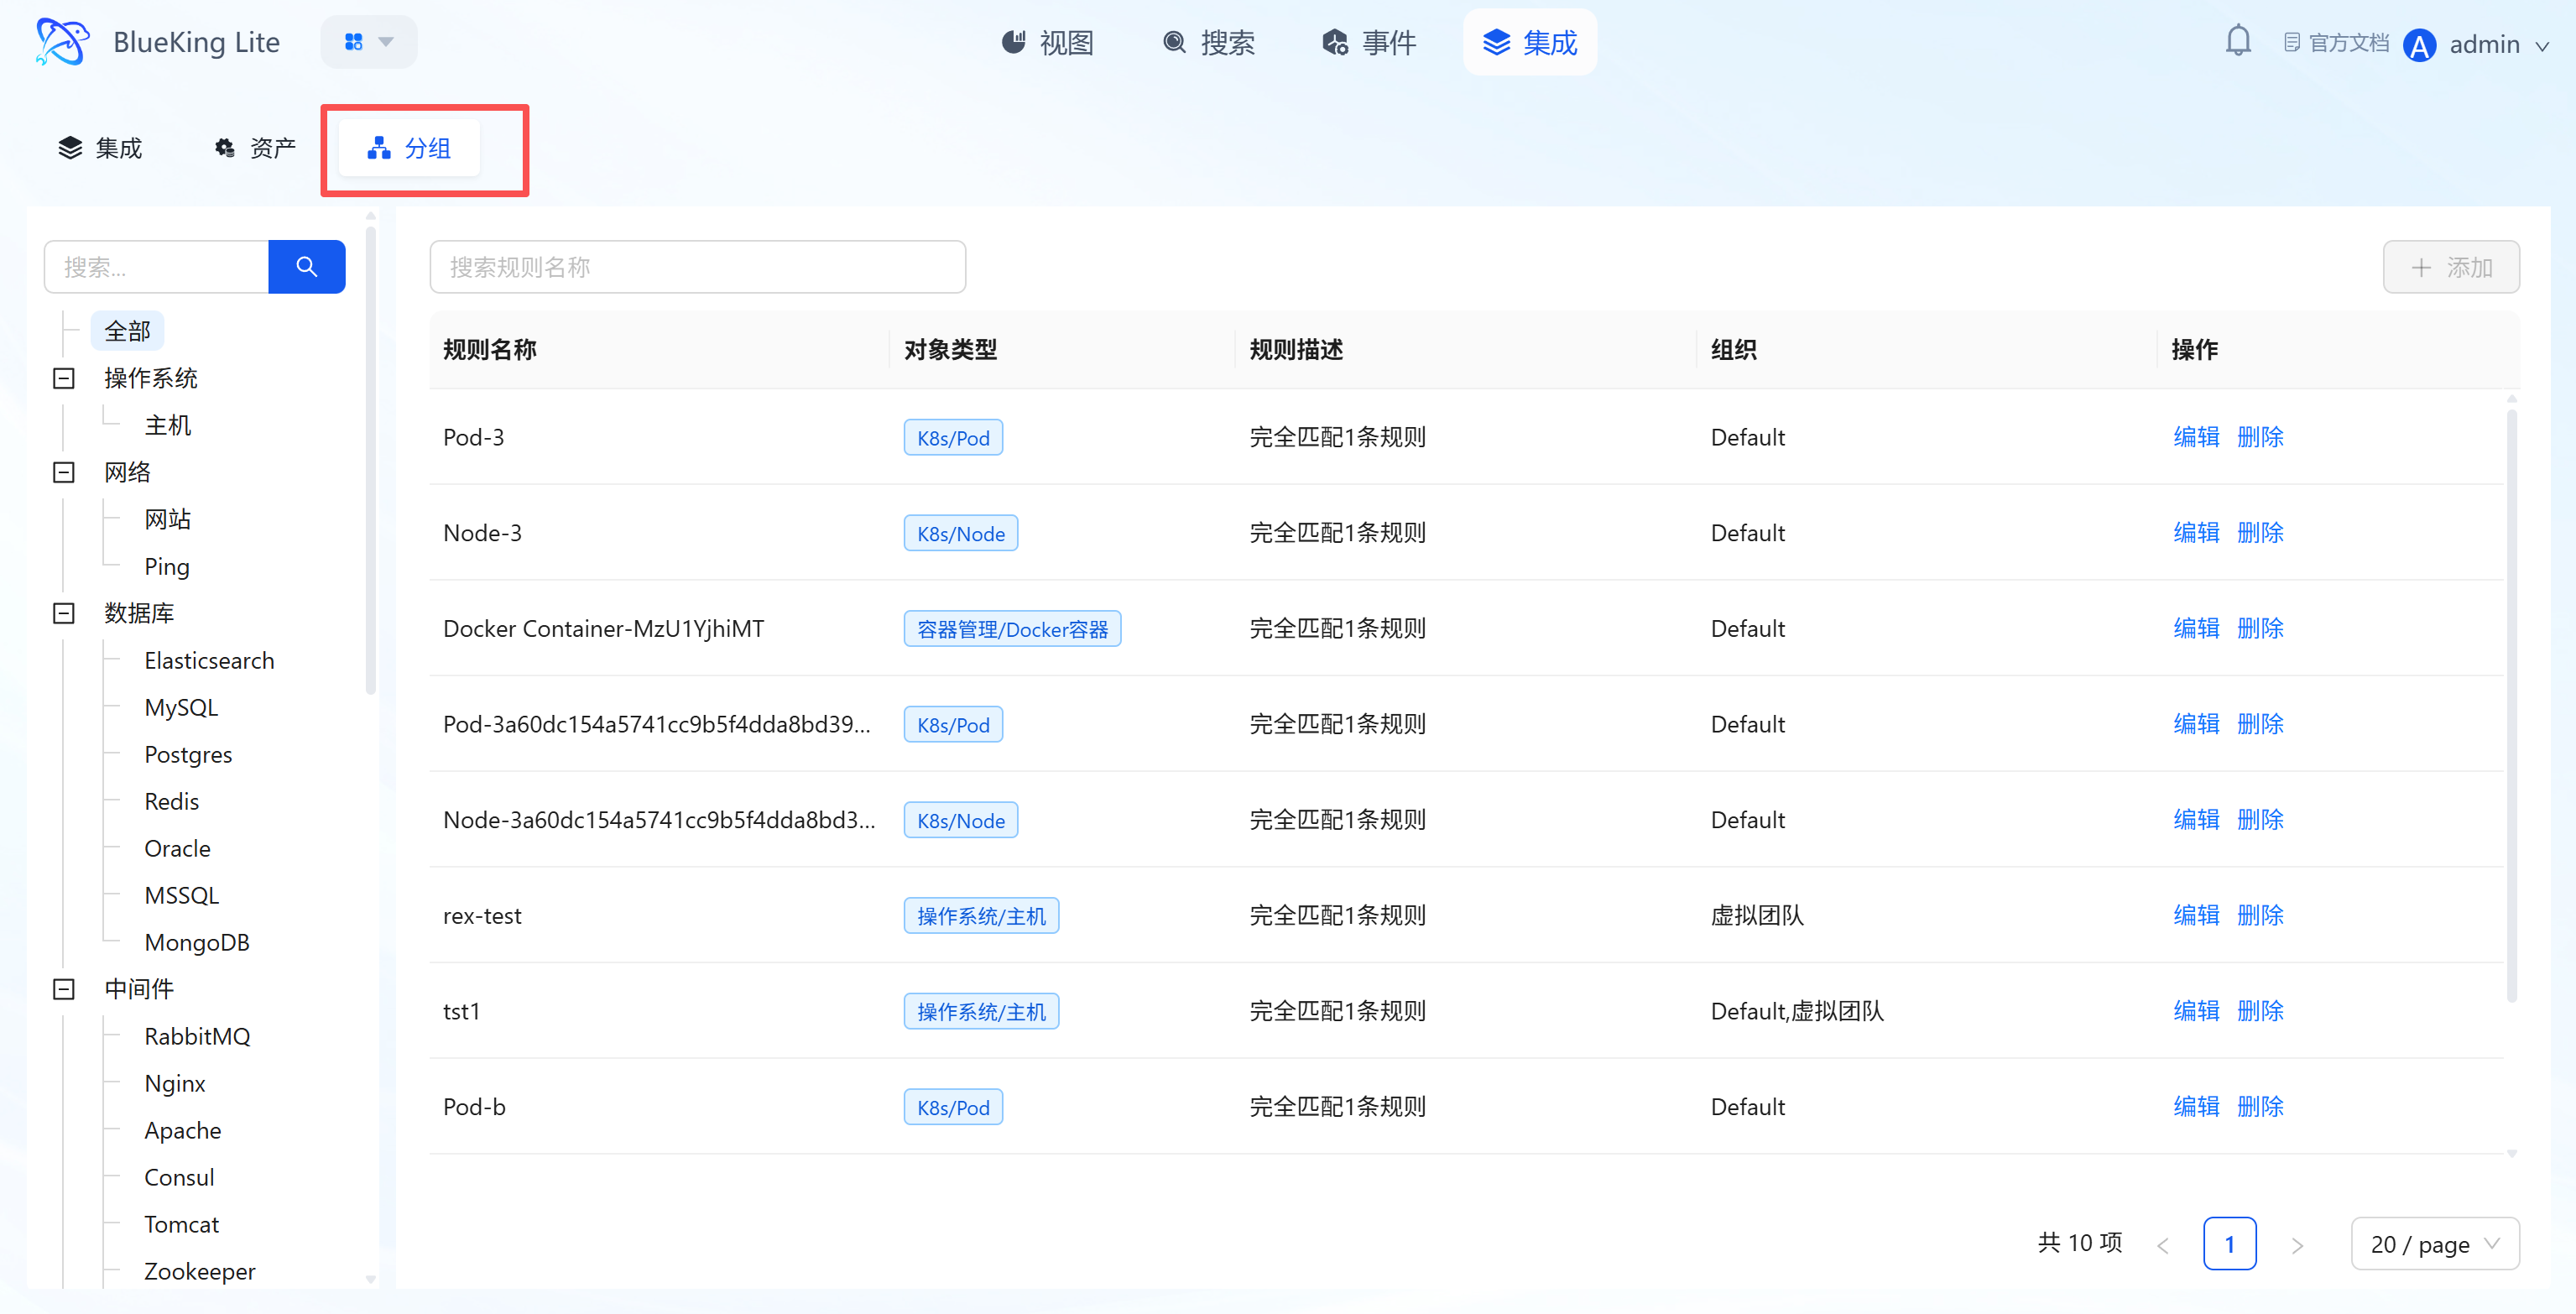
4.3 Grouping (Resource Grouping Rule Configuration)
Core Capabilities
- Resource Logical Group Management: Through rules, scattered assets under the same type category are re-aggregated by "technical dimension (e.g., K8s/Pod, OS/Host)" or business cluster dimension. The list displays "Rule Name, Object Type, Rule Description, Organization";
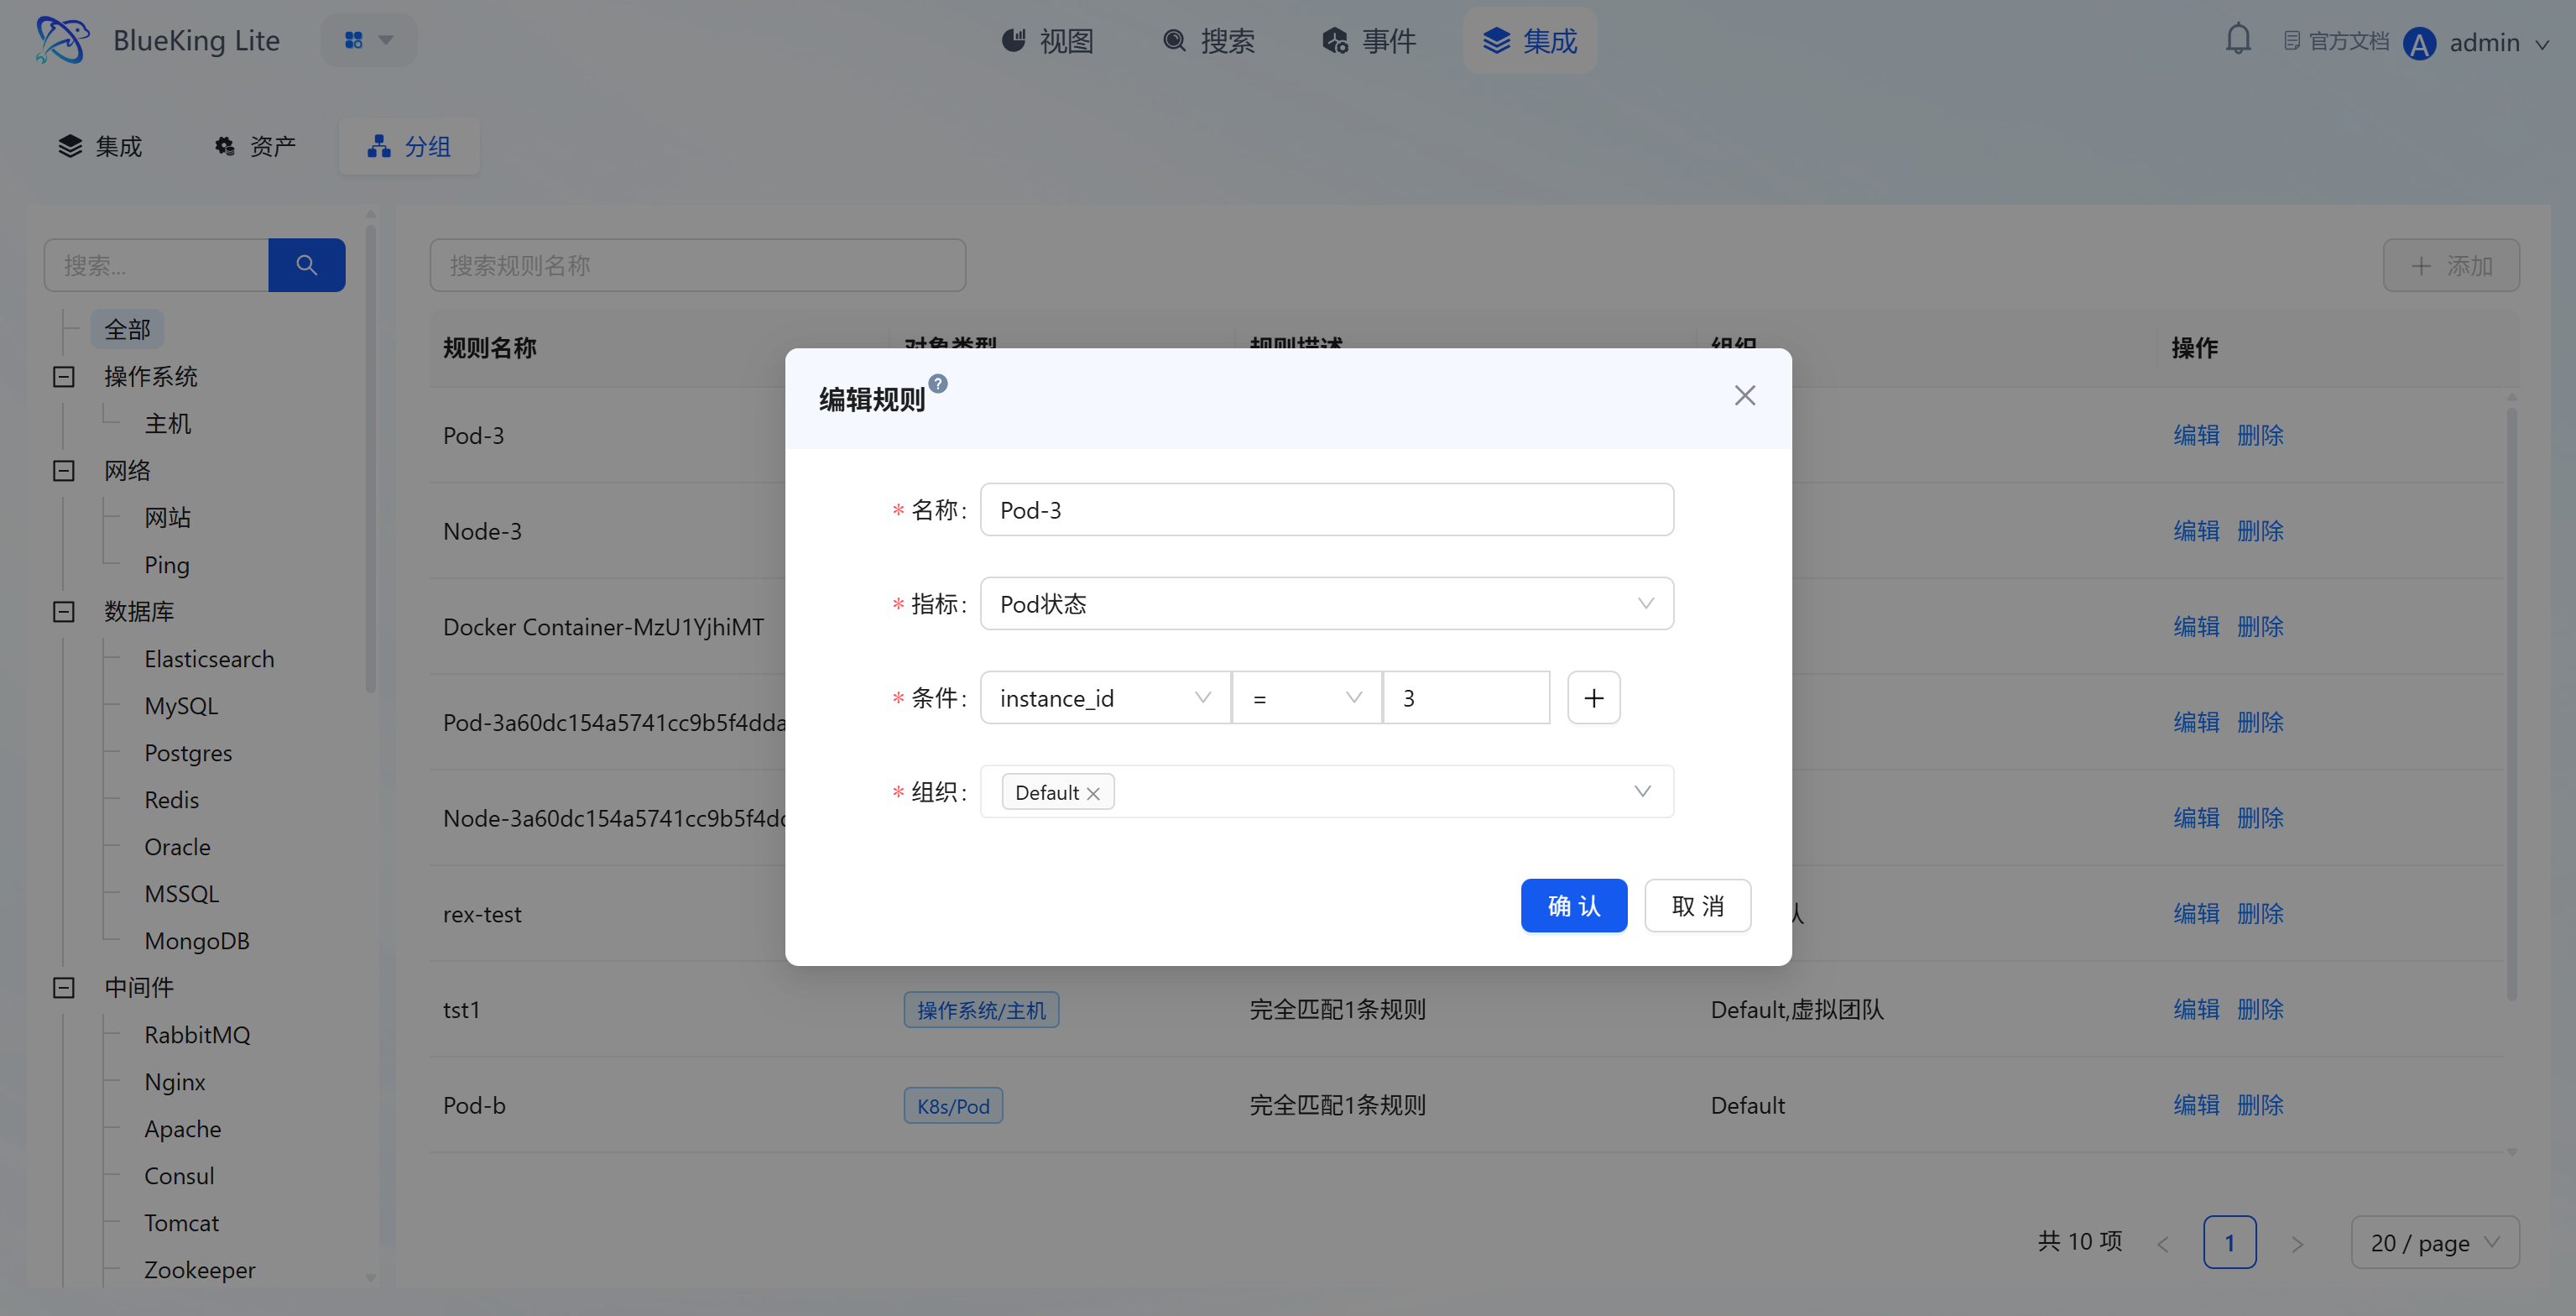
- Rule Configuration Logic: When creating/editing rules, you can set "Matching Metric, Condition (e.g.,
instance_id = 3), Organization" to achieve automatic asset classification; - Batch Operations Support: Grouping rules provide the logical grouping foundation for subsequent "batch alert policy configuration, batch monitoring data viewing," reducing repetitive operations and improving operational efficiency.
4.4 Object (Monitoring Object Governance)
Core Capabilities
- Object Type Management: Supports creating, editing, deleting, and sorting monitoring object types for unified classification of monitoring objects in your business domain;
- Monitoring Object Management: Supports creating, editing, deleting, and sorting monitoring objects while controlling object visibility to ensure consistent terminology across integration, view, template, and policy pages;
- Object Scope Support: Objects and object types can be directly used in collection onboarding, resource viewing, template selection, and policy scope configuration, reducing cross-page configuration ambiguity;
- Instance List Column Name Internationalization: The display column names in the monitoring object instance list automatically switch based on the current account's language setting (Chinese/English), and custom column display configurations are preserved after language switching without being lost or reverted, ensuring consistent multi-language user experience;
- Display Metric Configuration: Each monitoring object (including built-in objects) provides a "Display" entry where you can configure visible display columns in view lists and corresponding collection template metric mappings for that object.
- For composite objects with sub-objects (e.g., Kubernetes with Pod and Node), the dialog left side displays the object tree, allowing separate display column configuration for the main object and each sub-object;
- Each display column supports adding multiple "Collection Template / Metric" mappings to accommodate same-type metrics from different plugin sources (e.g., CPU usage can map both Host and HostRemote template metrics);
- Supports drag-to-reorder display columns to meet different teams' metric priority preferences.
4.5 SNMP Network Device Monitoring (Beta)
For switches, routers, firewalls, and load balancers, the platform provides device status and performance monitoring onboarding based on the SNMP protocol. Unlike flow collection (NetFlow/sFlow) which focuses on traffic flow analysis, SNMP monitoring actively polls device runtime status, interface throughput, CPU/memory utilization, and other key performance indicators, making it ideal for network device health and availability monitoring.
Core Capabilities
- Extensive Vendor Brand Coverage: Ships with approximately 61 SNMP collection plugins for mainstream vendor brands, covering industry leaders such as Huawei, Cisco, H3C, Juniper, Ruijie, Dlink, DPtech, Brocade, Paloalto, F5, etc., across four major device types: switches, routers, firewalls, and load balancers. Each brand plugin includes vendor-specific built-in MIB collection templates that enable out-of-the-box collection of standard indicators for that brand's devices without manual OID configuration;
- Pre-Configured Metrics and Alert Templates: Each brand SNMP plugin includes standardized device performance indicators (such as interface traffic, CPU utilization, memory usage, device reachability, etc.) and comes with ready-to-use alert templates. You can directly create alert policies based on templates, significantly lowering the configuration barrier for network device monitoring;
- Device Instance Unique Identity: Network device instances use "Cloud Region + Device IP" as the unique identifier. When the same device is collected by multiple different vendor SNMP plugins, the platform automatically merges these collection data into a single asset instance, avoiding duplicate assets and keeping the asset view clean;
- Unified Asset Management: SNMP network device assets are managed uniformly within the Integration "Assets" page, supporting viewing collection status, editing asset information, and adjusting collection configurations, maintaining a consistent management experience with other monitoring resources.
4.6 Flow Monitoring Onboarding (NetFlow / sFlow)
For network devices such as switches, routers, firewalls, and load balancers, the platform provides flow monitoring onboarding based on the NetFlow / sFlow protocols. Unlike SNMP polling, flow collection has the device actively push traffic samples to a platform listener endpoint, making it better suited for analyzing network flows and session-level traffic distribution.
Core Capabilities
- Protocol and Endpoint Generation: Supports both NetFlow (UDP 2055) and sFlow (UDP 6343) protocols. After selecting a protocol and cloud region, the platform automatically assembles an endpoint of the form
udp://<host>:<port>from the cloud region's node server address and provides device-side configuration guidance (enable flow export, point the destination to this endpoint, keep the device source IP consistent with bound asset IP). - Asset Binding and Protocol Aggregation: Supports binding a flow asset to device IP and cloud region; a single asset can have multiple protocols enabled simultaneously. Within the same cloud region,
IPcannot be bound more than once, avoiding traffic ownership ambiguity. - Rich Built-in Metrics: Each NetFlow/sFlow plugin includes seven groups totaling 21 monitoring metrics covering major network traffic analysis dimensions:
- Traffic Overview: Device total ingress/egress traffic, total packet count, average packet size, etc.;
- Interface Traffic: Ingress/egress traffic and packet count by device interface;
- Protocol: Traffic distribution by IP protocol type (TCP/UDP/ICMP, etc.);
- Application Port: Application-layer traffic by destination port;
- Endpoint: Traffic sources and destinations by source/destination IP;
- Conversation: Bidirectional session traffic by source IP + destination IP pair;
- Sampling: Sampling rate and raw traffic conversion data.
- Built-in Alert Templates: Each network device type (Switch/Router/Firewall/Load Balancer)'s NetFlow and sFlow plugins include three types of alert threshold templates: Device Total Traffic Too High, Device Total Packet Count Too High, Average Packet Size Anomaly. Policies can be created directly from templates without manual metric configuration.
- Sampling-Rate Normalization and Fallback: The platform consistently consumes an "effective sampling rate (effective_sampling_rate)." The receiving side normalizes the sampling rate by priority order
SAMPLING_INTERVAL,SAMPLING_ALGORITHM,sampling_rate,samplingRate; if all are absent from reported data, it falls back to the asset's configured fallback sampling rate (default 1000), keeping traffic scaling consistent. - Cloud Region Environment Linkage: When a flow asset changes, the platform refreshes the "IP → asset" mapping into environment variables on the collection side of the corresponding cloud region, so the receiver resolves traffic sources against the latest asset list.
- Onboarding Detection: Onboarding is considered successful when actual flow data for the asset's protocol is received within the most recent time window, making it easy to confirm the pipeline is connected.