Quick Start
With this quick start guide, you can get up and running from scratch in a short time, using the BlueKing Lite monitoring platform to quickly integrate and analyze operational data from hosts, databases, containers (K8s/Docker), network devices, or virtualization platforms (VMware). This guide covers configuring automated collection, viewing monitoring dashboards, and analyzing key performance metrics.
Operating System
Integrating Host Monitoring
This section will guide you through integrating basic performance monitoring for Linux or Windows hosts.
Step 1: Select an Integration Plugin
The Integration Center is the management hub for all monitoring targets.
- After entering Monitor, click "Integration" in the top navigation bar.
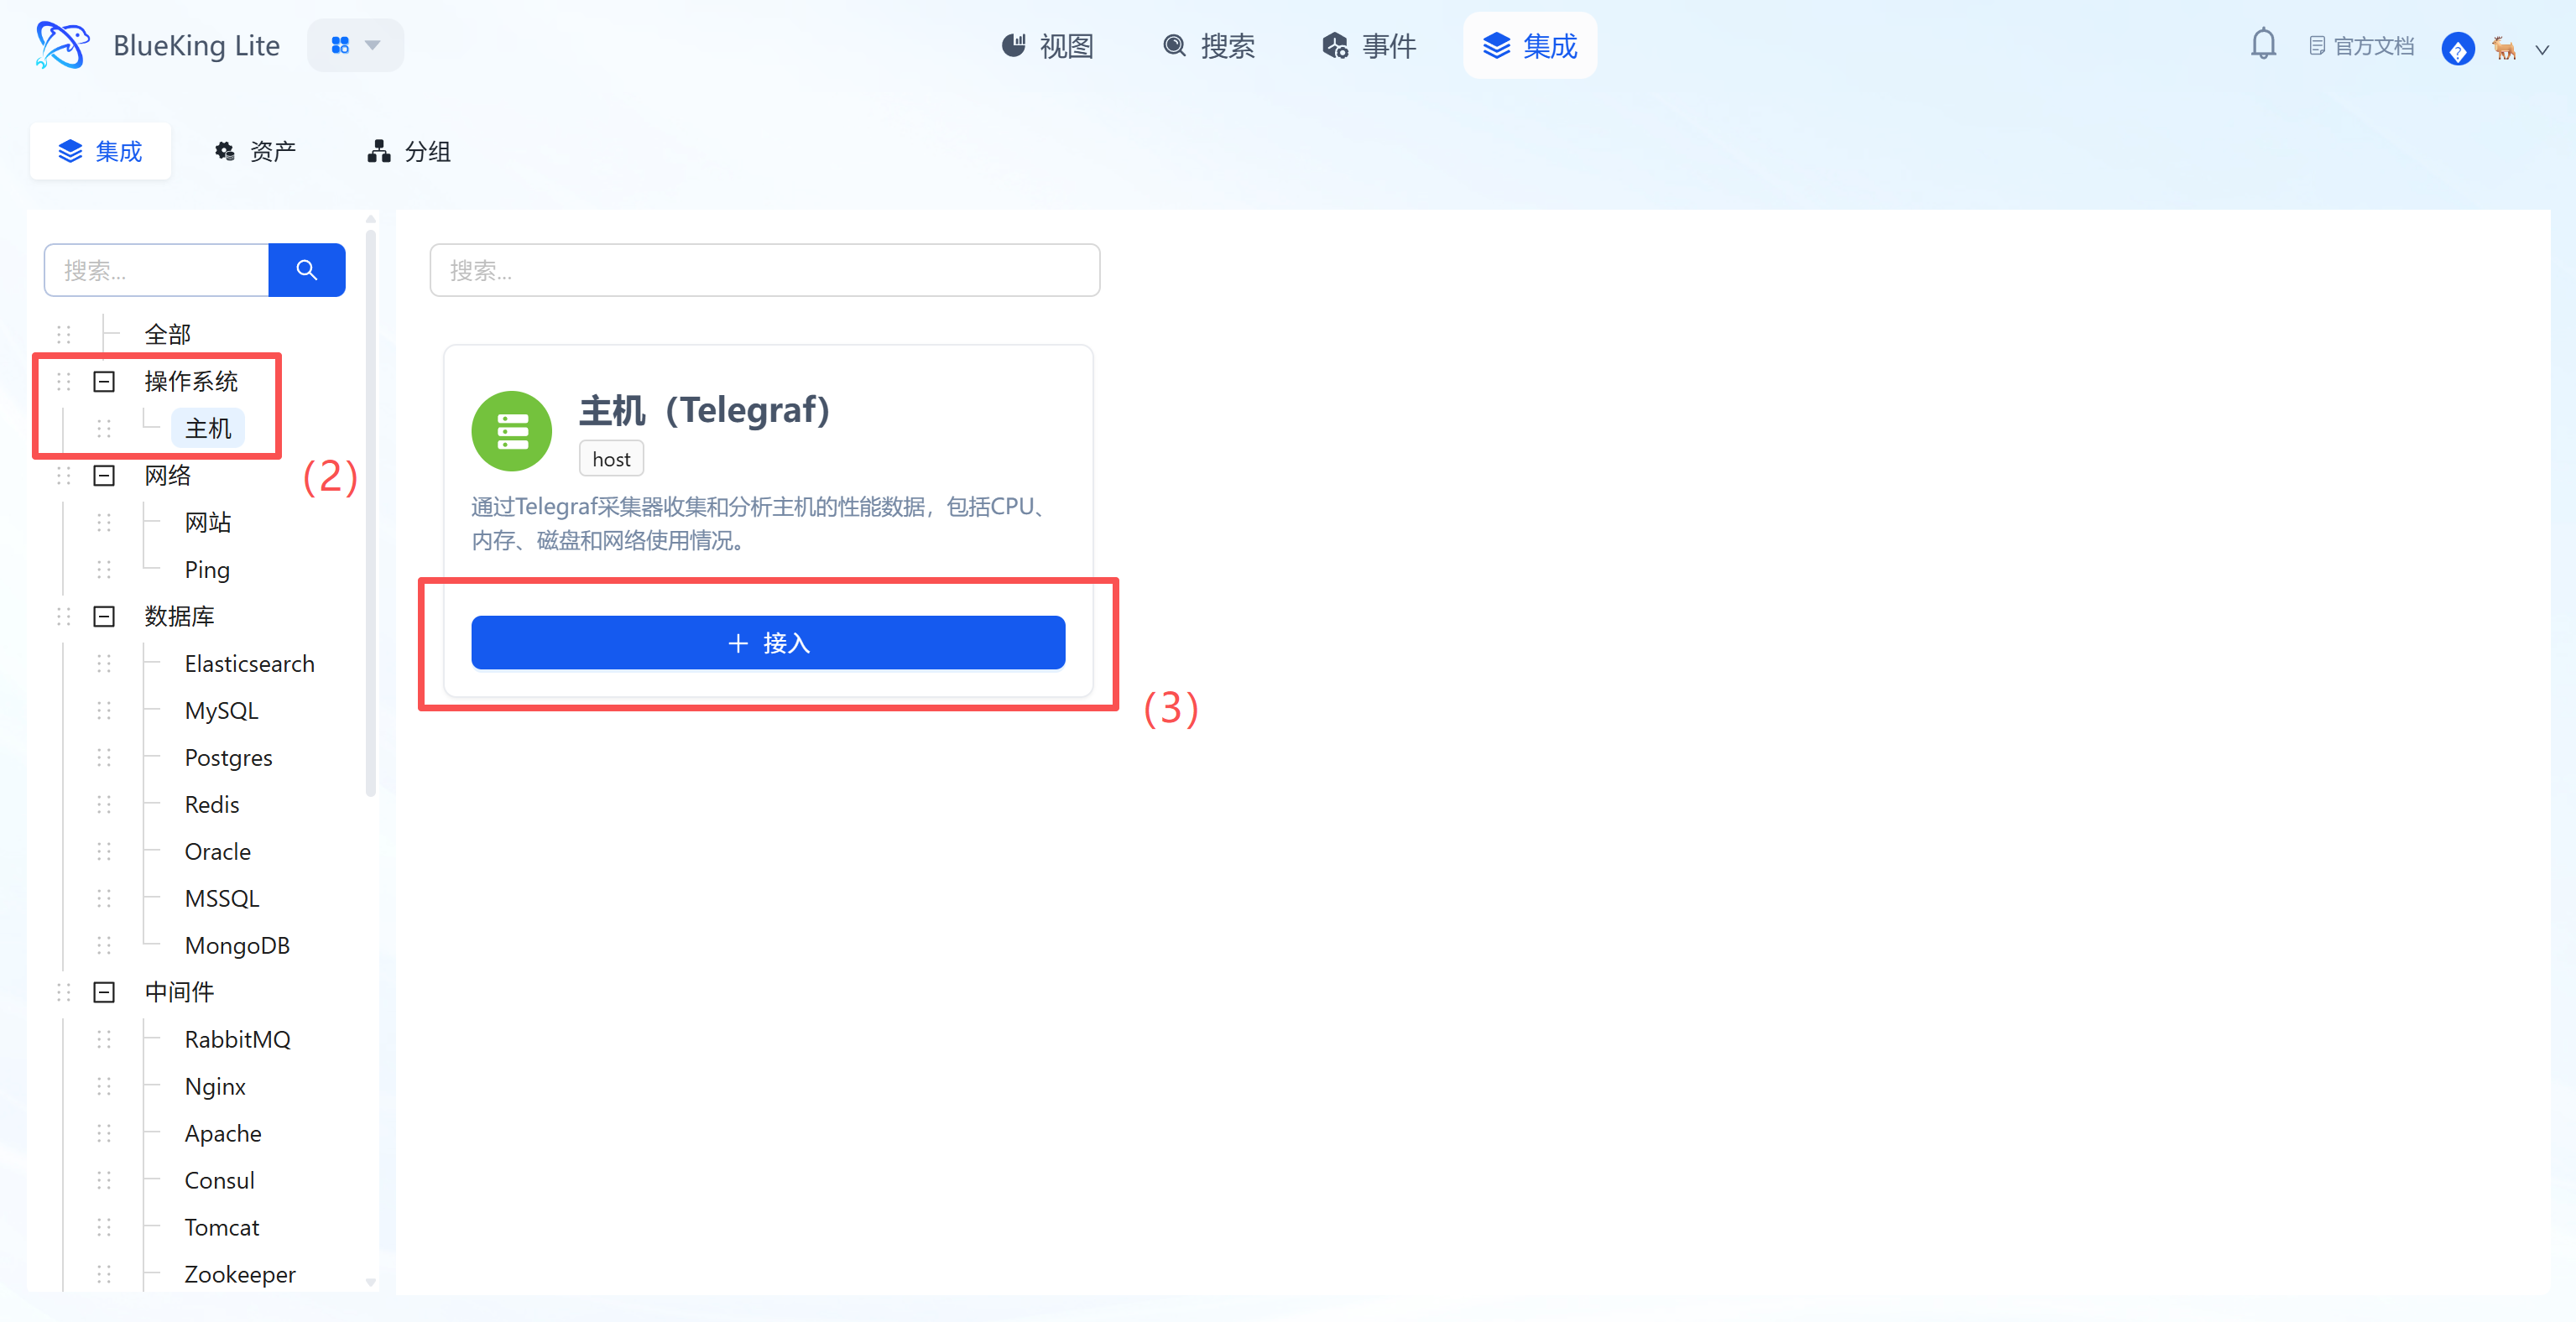
- Select resource type: In the left menu tree, choose the component based on your needs.
- The platform has built-in categories such as
Operating System,Database,Middleware,Network, etc. - For host monitoring as an example: Click "Operating System" -> "Host".
- The platform has built-in categories such as
- Click "+ Integrate" at the top right of the list.
Screenshot Guide:
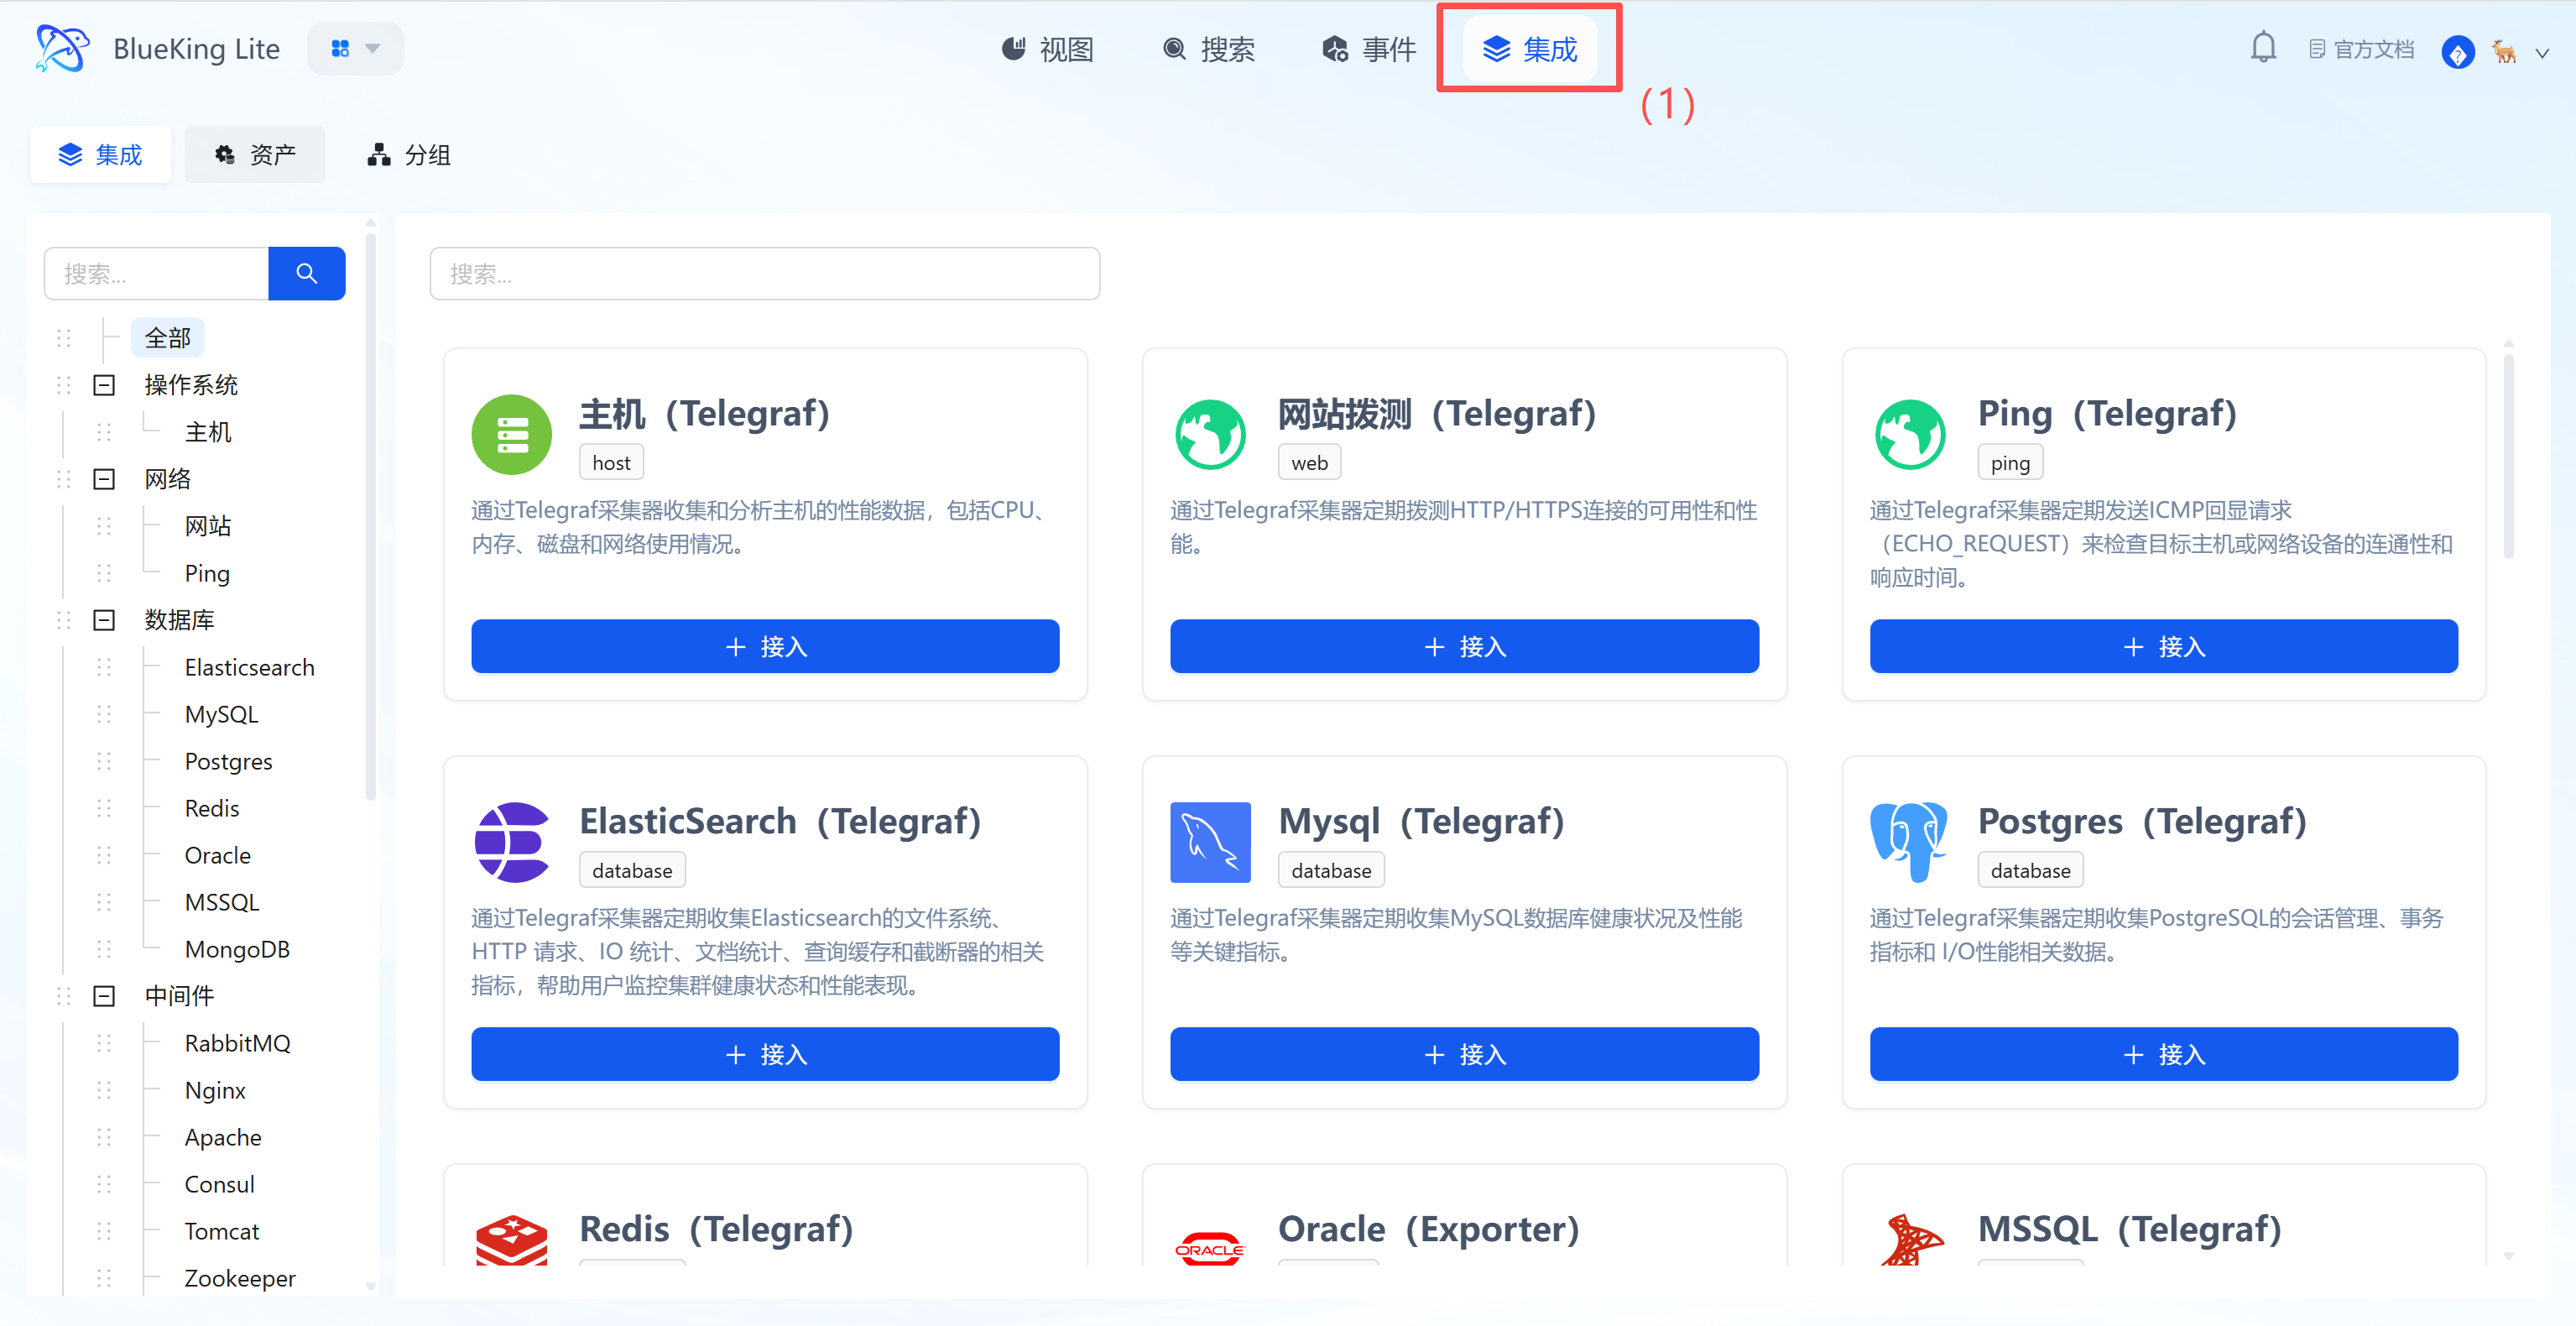
- Left menu tree: Lists all supported monitoring targets (such as K8s, switches, Redis, etc.), demonstrating the platform's full-stack capabilities.
- Instance list: The right side displays the status of currently integrated hosts, where you can see their collection status and resource usage overview.
Step 2: Configure Collection Policy
The system comes with standardized collection templates pre-configured. You only need simple configuration to dispatch tasks.
- After clicking "Integrate", enter the configuration panel.
- Configure Metrics:
- It is recommended to keep the default selection of all metrics, including
Memory,Net(Network),Processes,System(Load), and other core metrics. - Interval: Default is
10s, which can be adjusted based on precision requirements.
- It is recommended to keep the default selection of all metrics, including
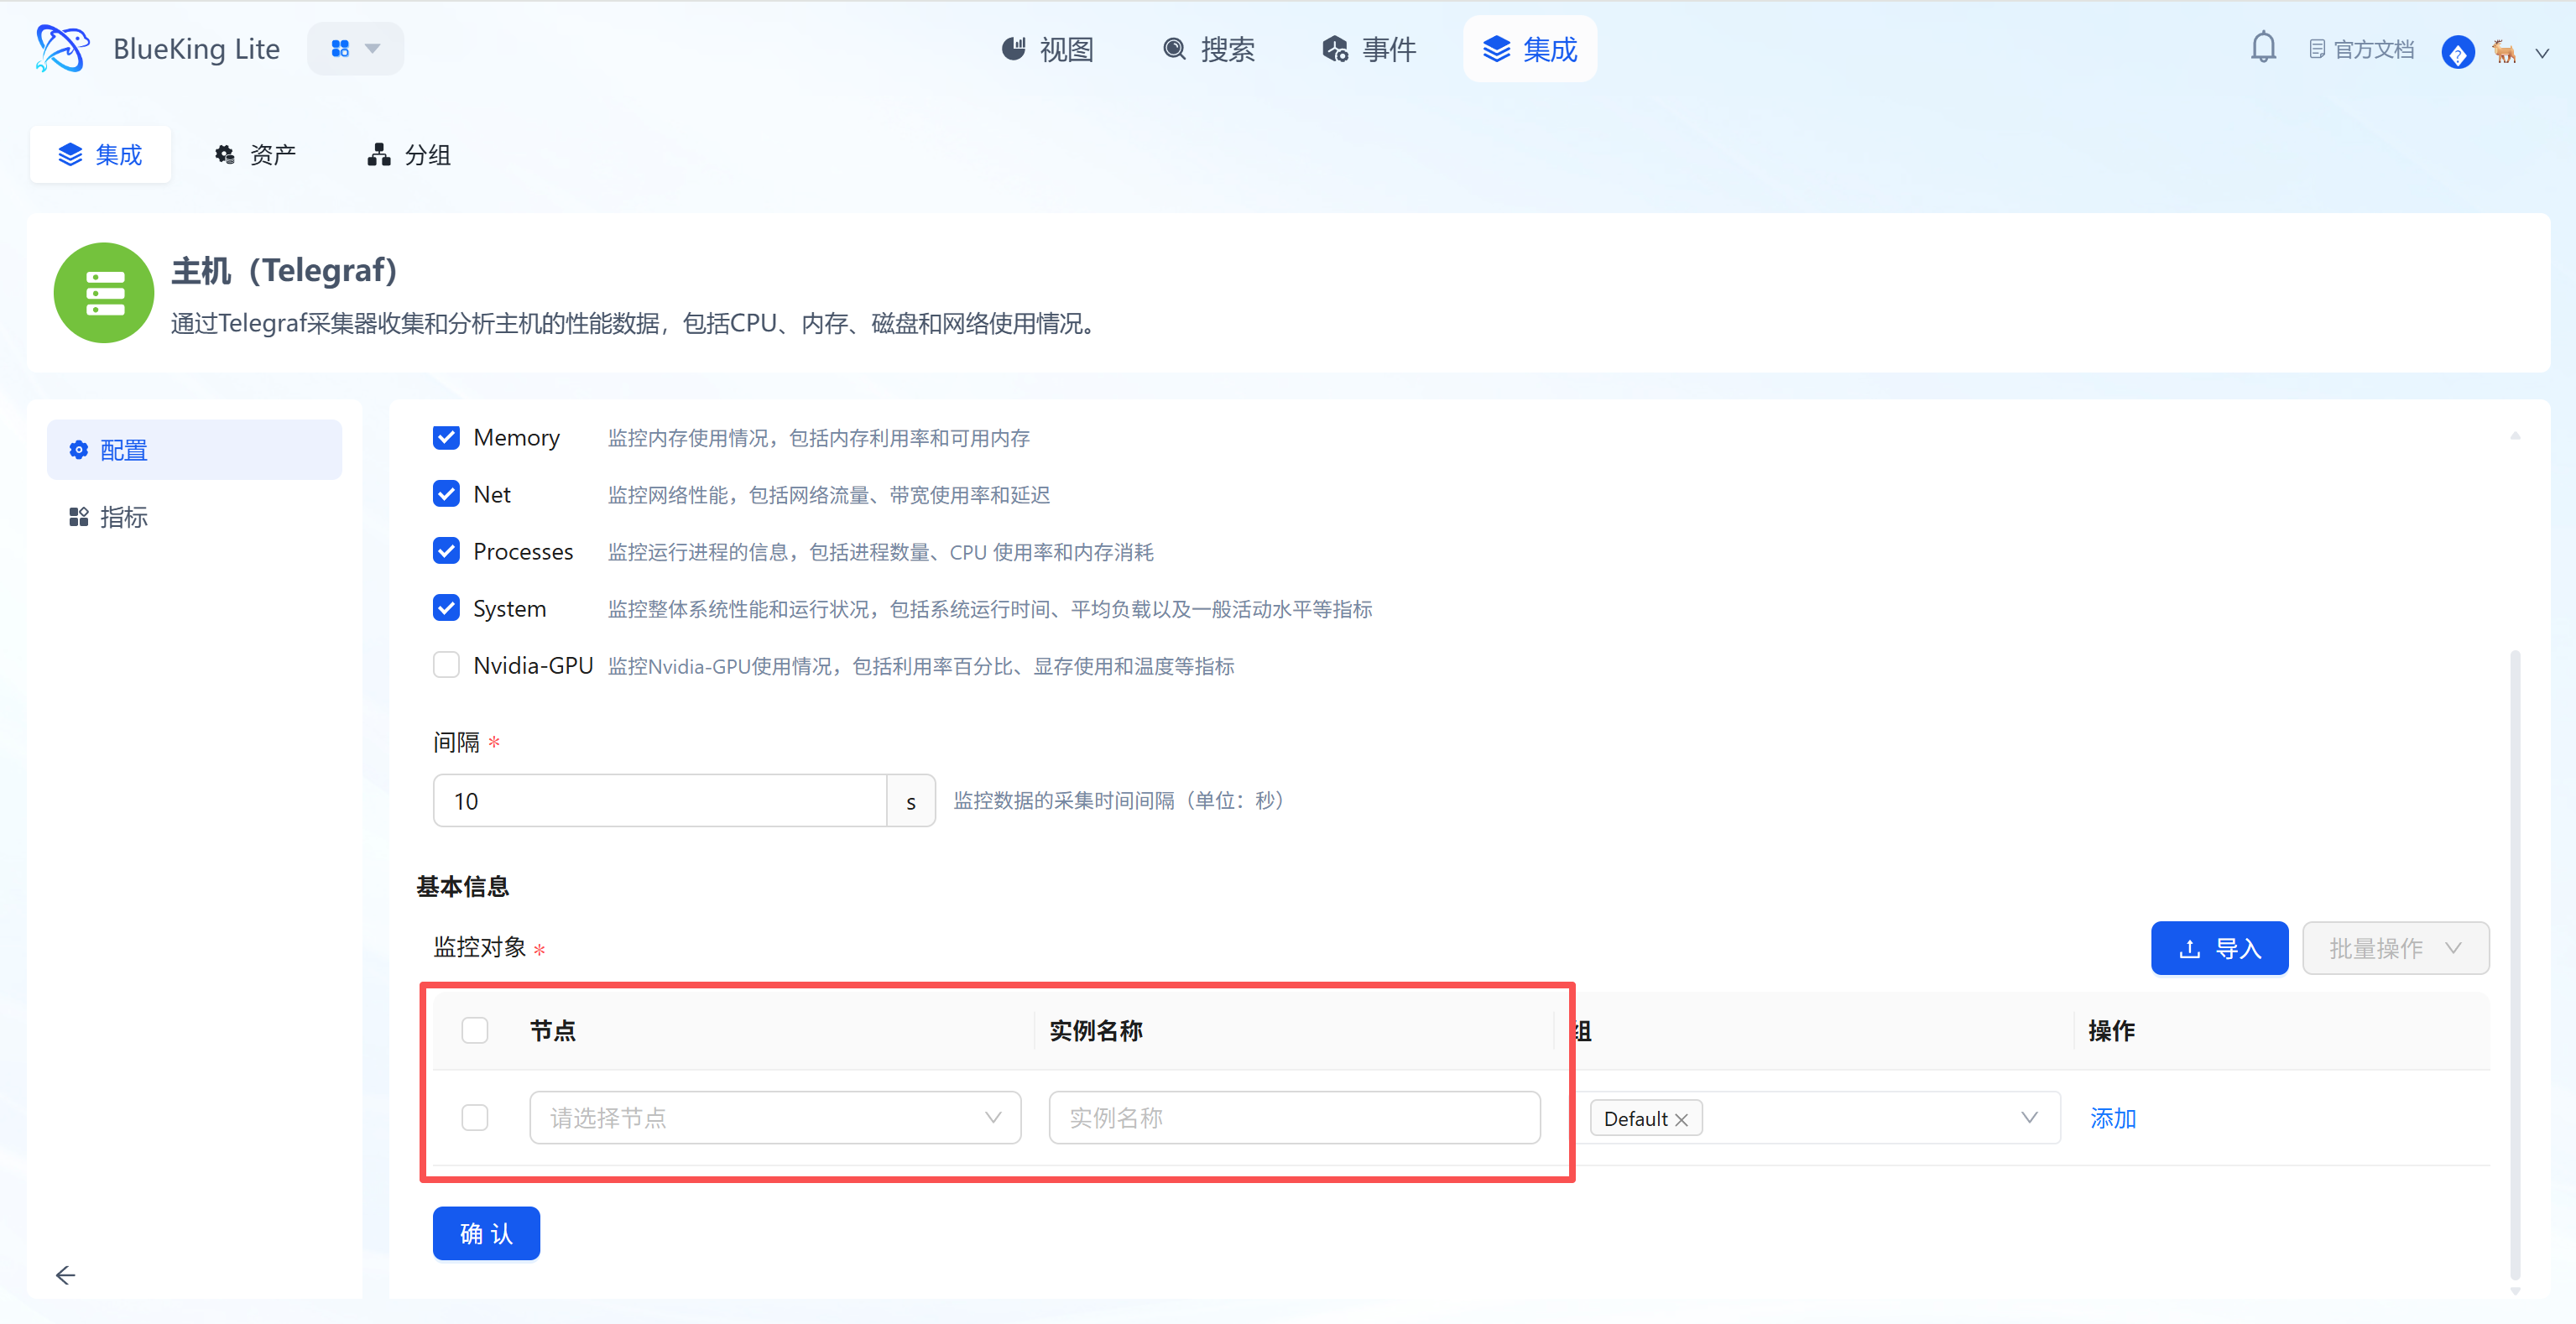
- Select Monitoring Targets:
- In the "Monitoring Targets" area at the bottom, click the "Node" dropdown.
- Select your managed target server (e.g.,
defaultorfusion-collector).
- Click the "Confirm" button at the bottom.
Screenshot Guide:
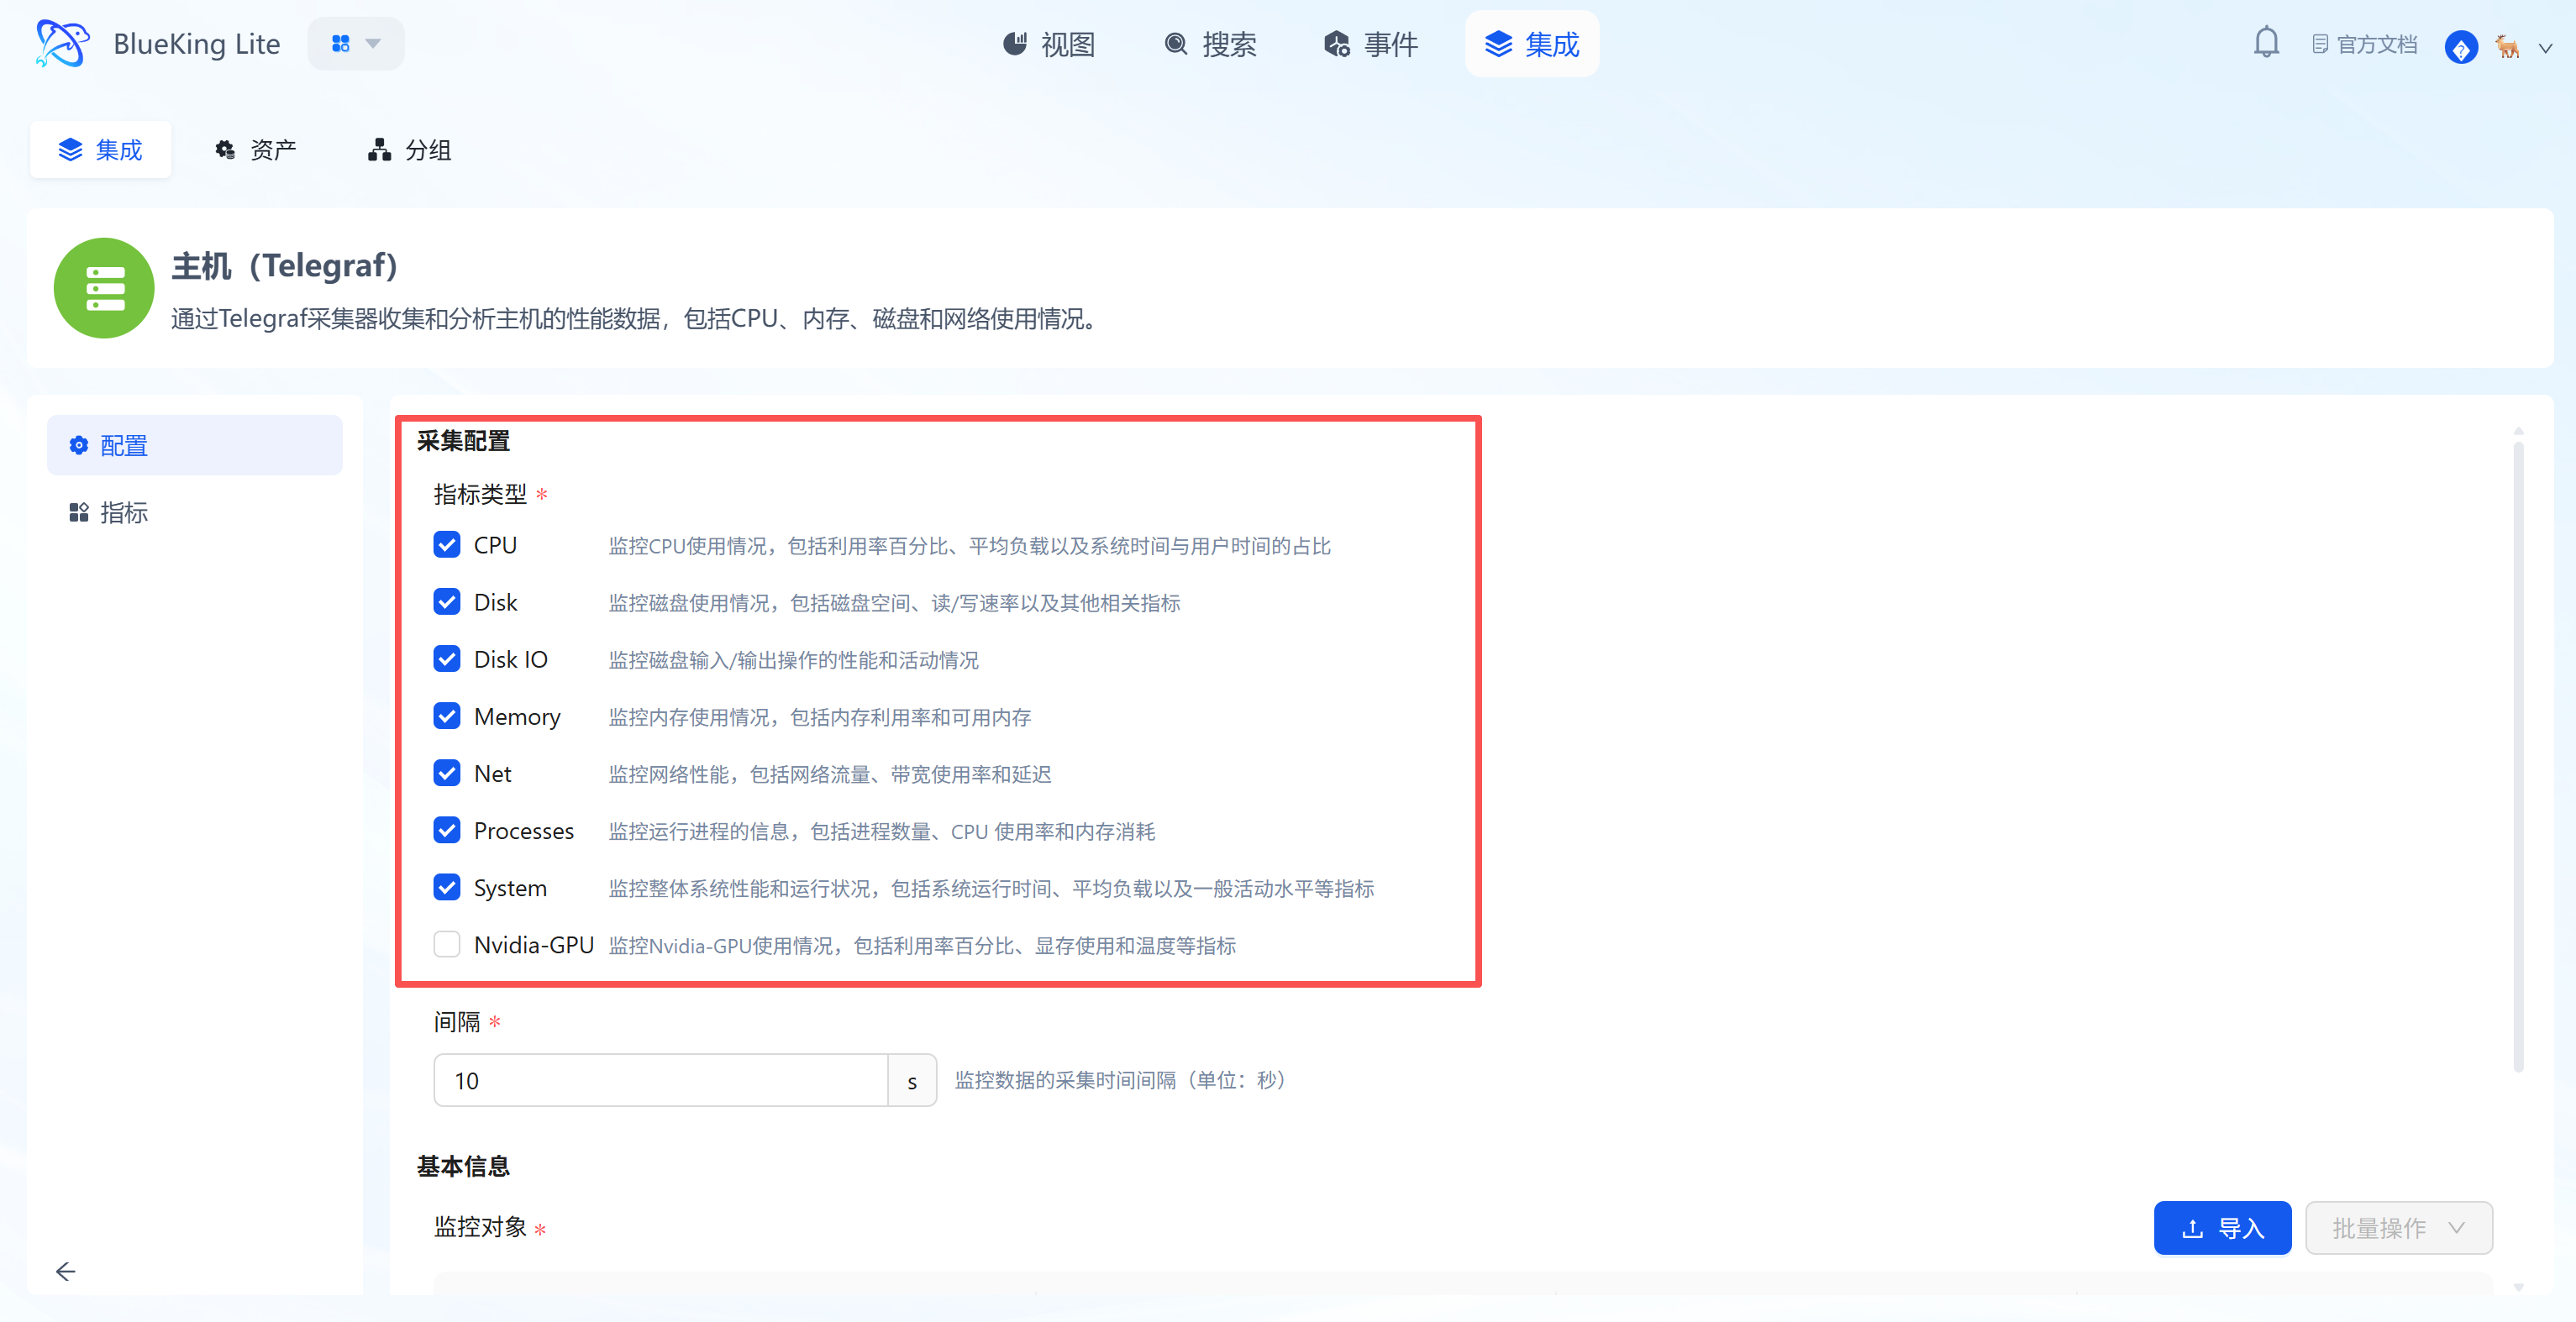
- Metric selection area: The system automatically lists all metrics supported by the component (Telegraf) — check the box to collect.
- Monitoring targets area: Bind specific server IPs here, with support for batch-selecting multiple nodes for simultaneous deployment.
Step 3: Verify and Analyze
After successful configuration deployment, the system automatically generates professional "View" dashboards without manual chart creation. This is also a key step to verify whether the integration was successful.
- After configuration is complete, click the "View" module in the top navigation.
- In the left resource category tree, click "Host", then find the recently integrated instance (e.g.,
fusion-collector) in the right resource list. - Click the dropdown or view action at the end of the instance row (to open the instance detail panel for that resource):
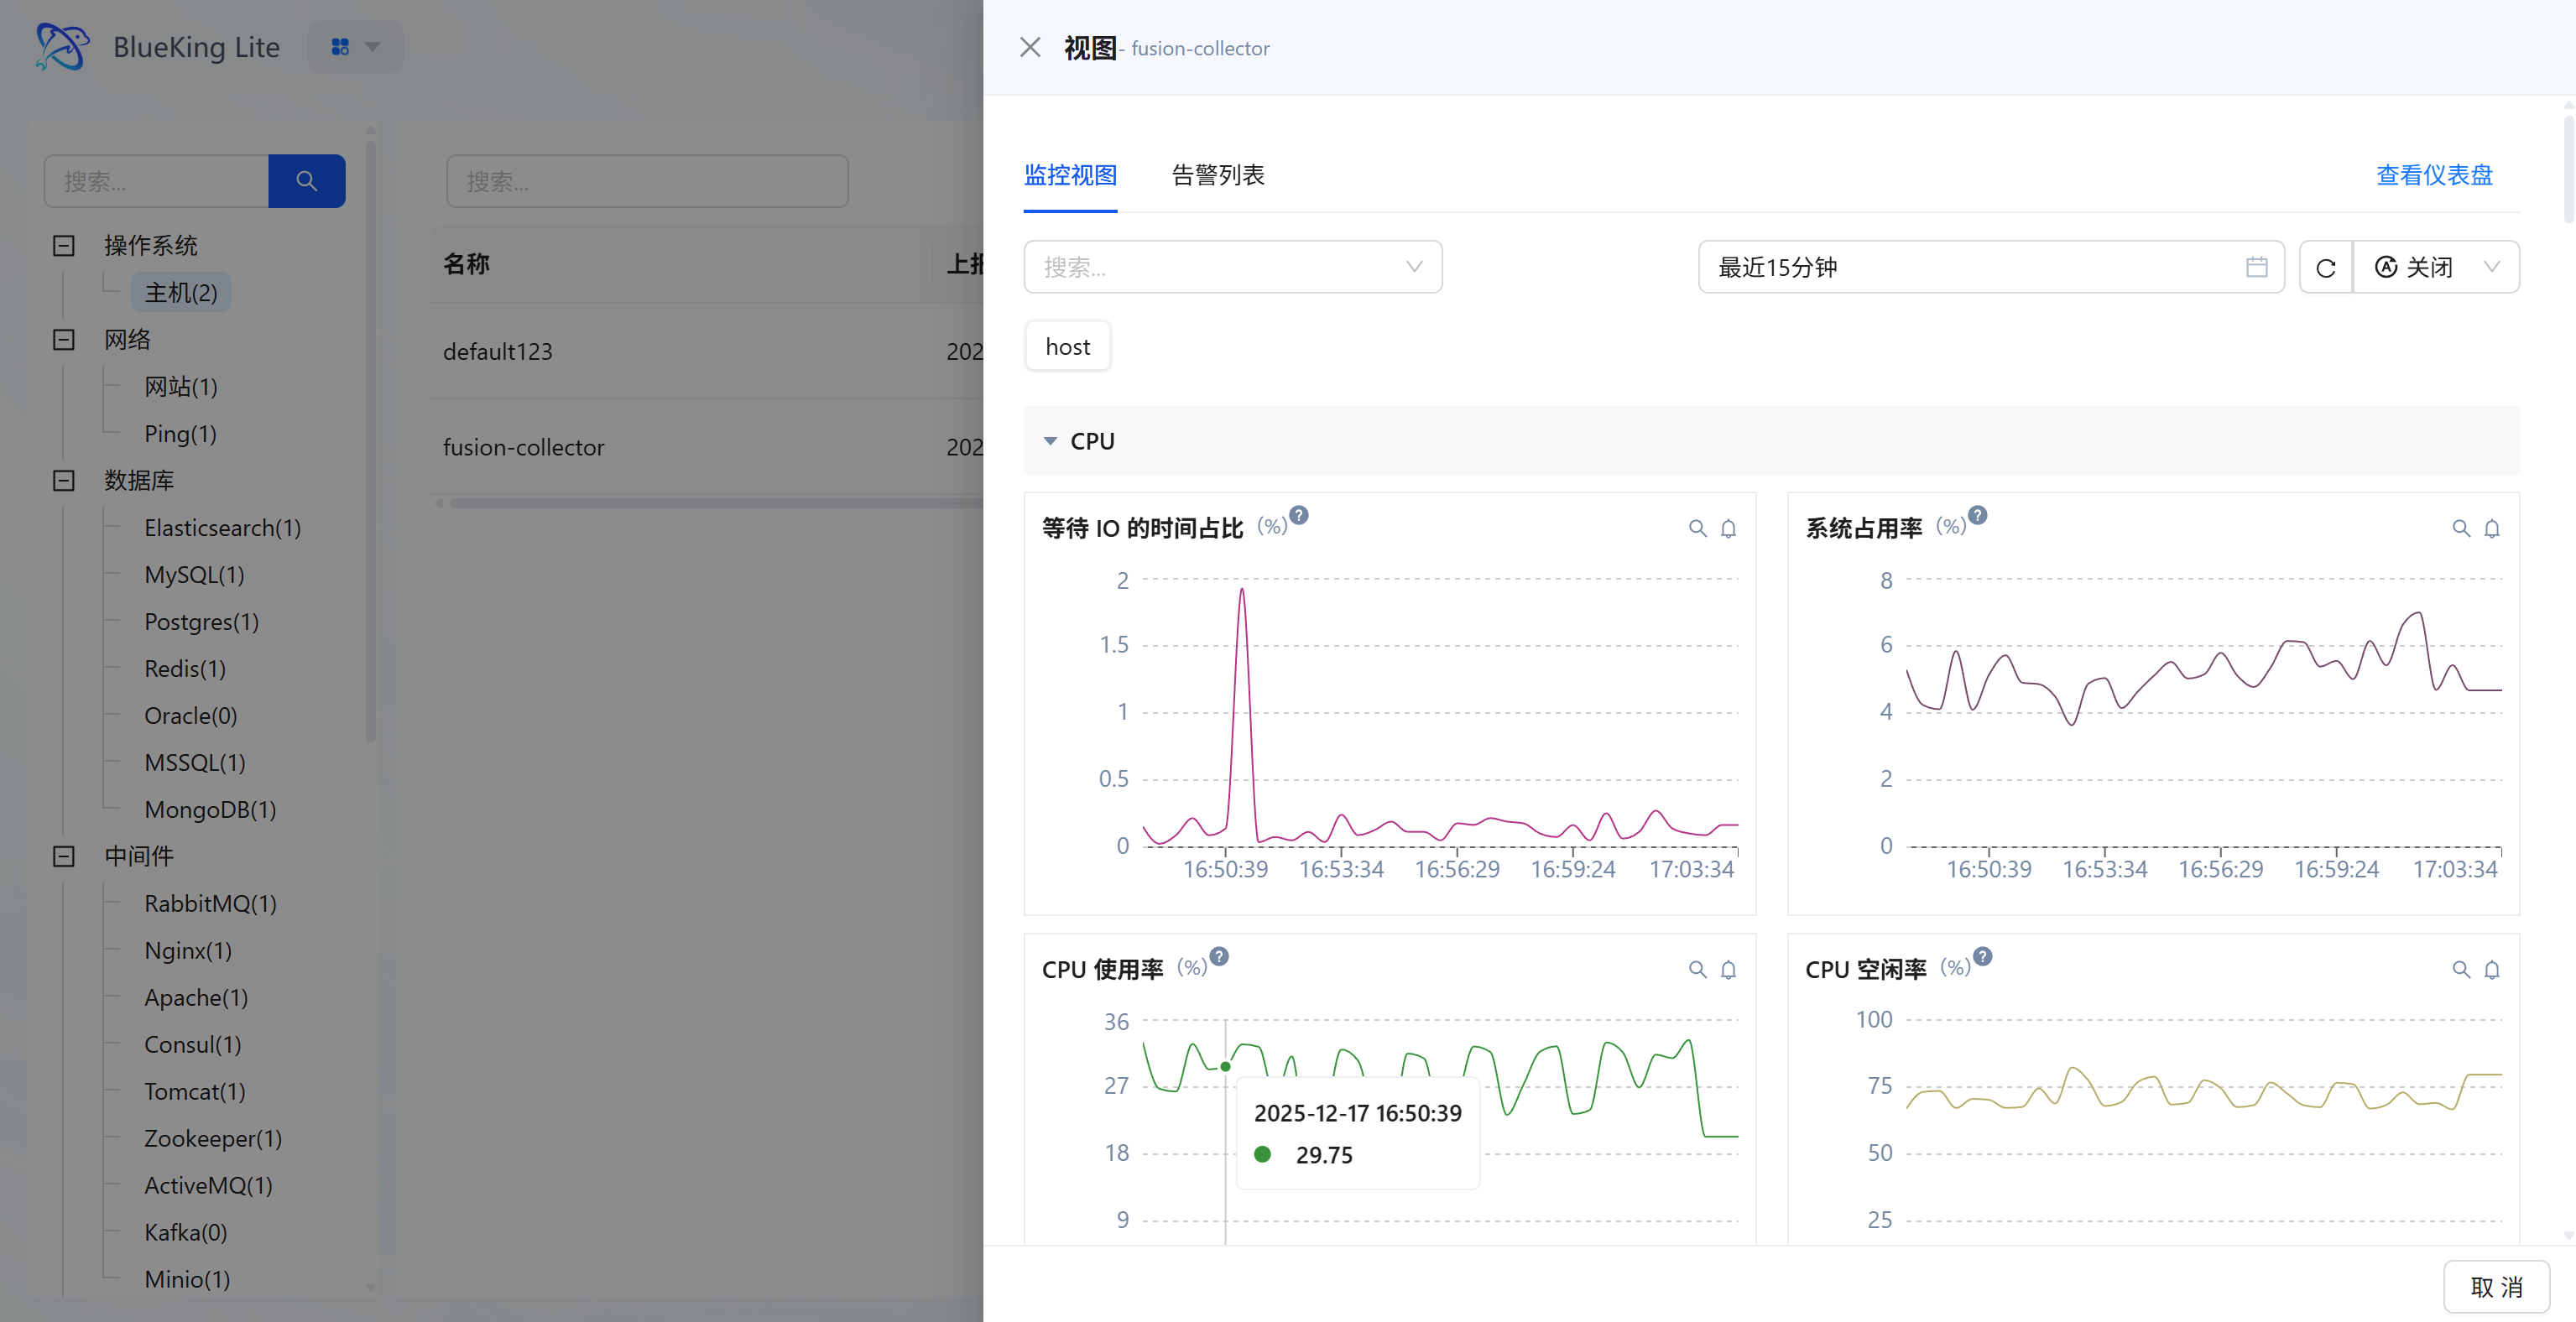
- Monitoring Views and Alerts (in-panel investigation): The panel displays core metrics such as CPU, memory, etc. by default; switch to "Alert List" to check whether the host has any anomalies.
- View Dashboard (full detail panorama): Click "View Dashboard" at the top right of the panel to enter the dedicated detail route, viewing key curves including "IO wait percentage, system/user mode consumption, etc."
- Time retrospection and linkage: Use the global time picker on the charts (default "Last 15 minutes") to synchronously refresh charts and view historical performance.
Screenshot Guide:
- Left list: Quickly switch between viewing monitoring details for different hosts.
- Chart area:
- IO Wait Time Percentage: High peaks may indicate disk read/write bottlenecks.
- CPU Usage: Shows the overall system load.
- CPU Idle Rate: Intuitively reflects remaining resource availability.
Network Monitoring
This section covers the monitoring integration workflow for Website Probing and Ping Detection.
Integrating Website Probing
This feature sends requests from designated probe nodes to target URLs using the HTTP/HTTPS protocol to monitor the availability and response time of websites or API endpoints.
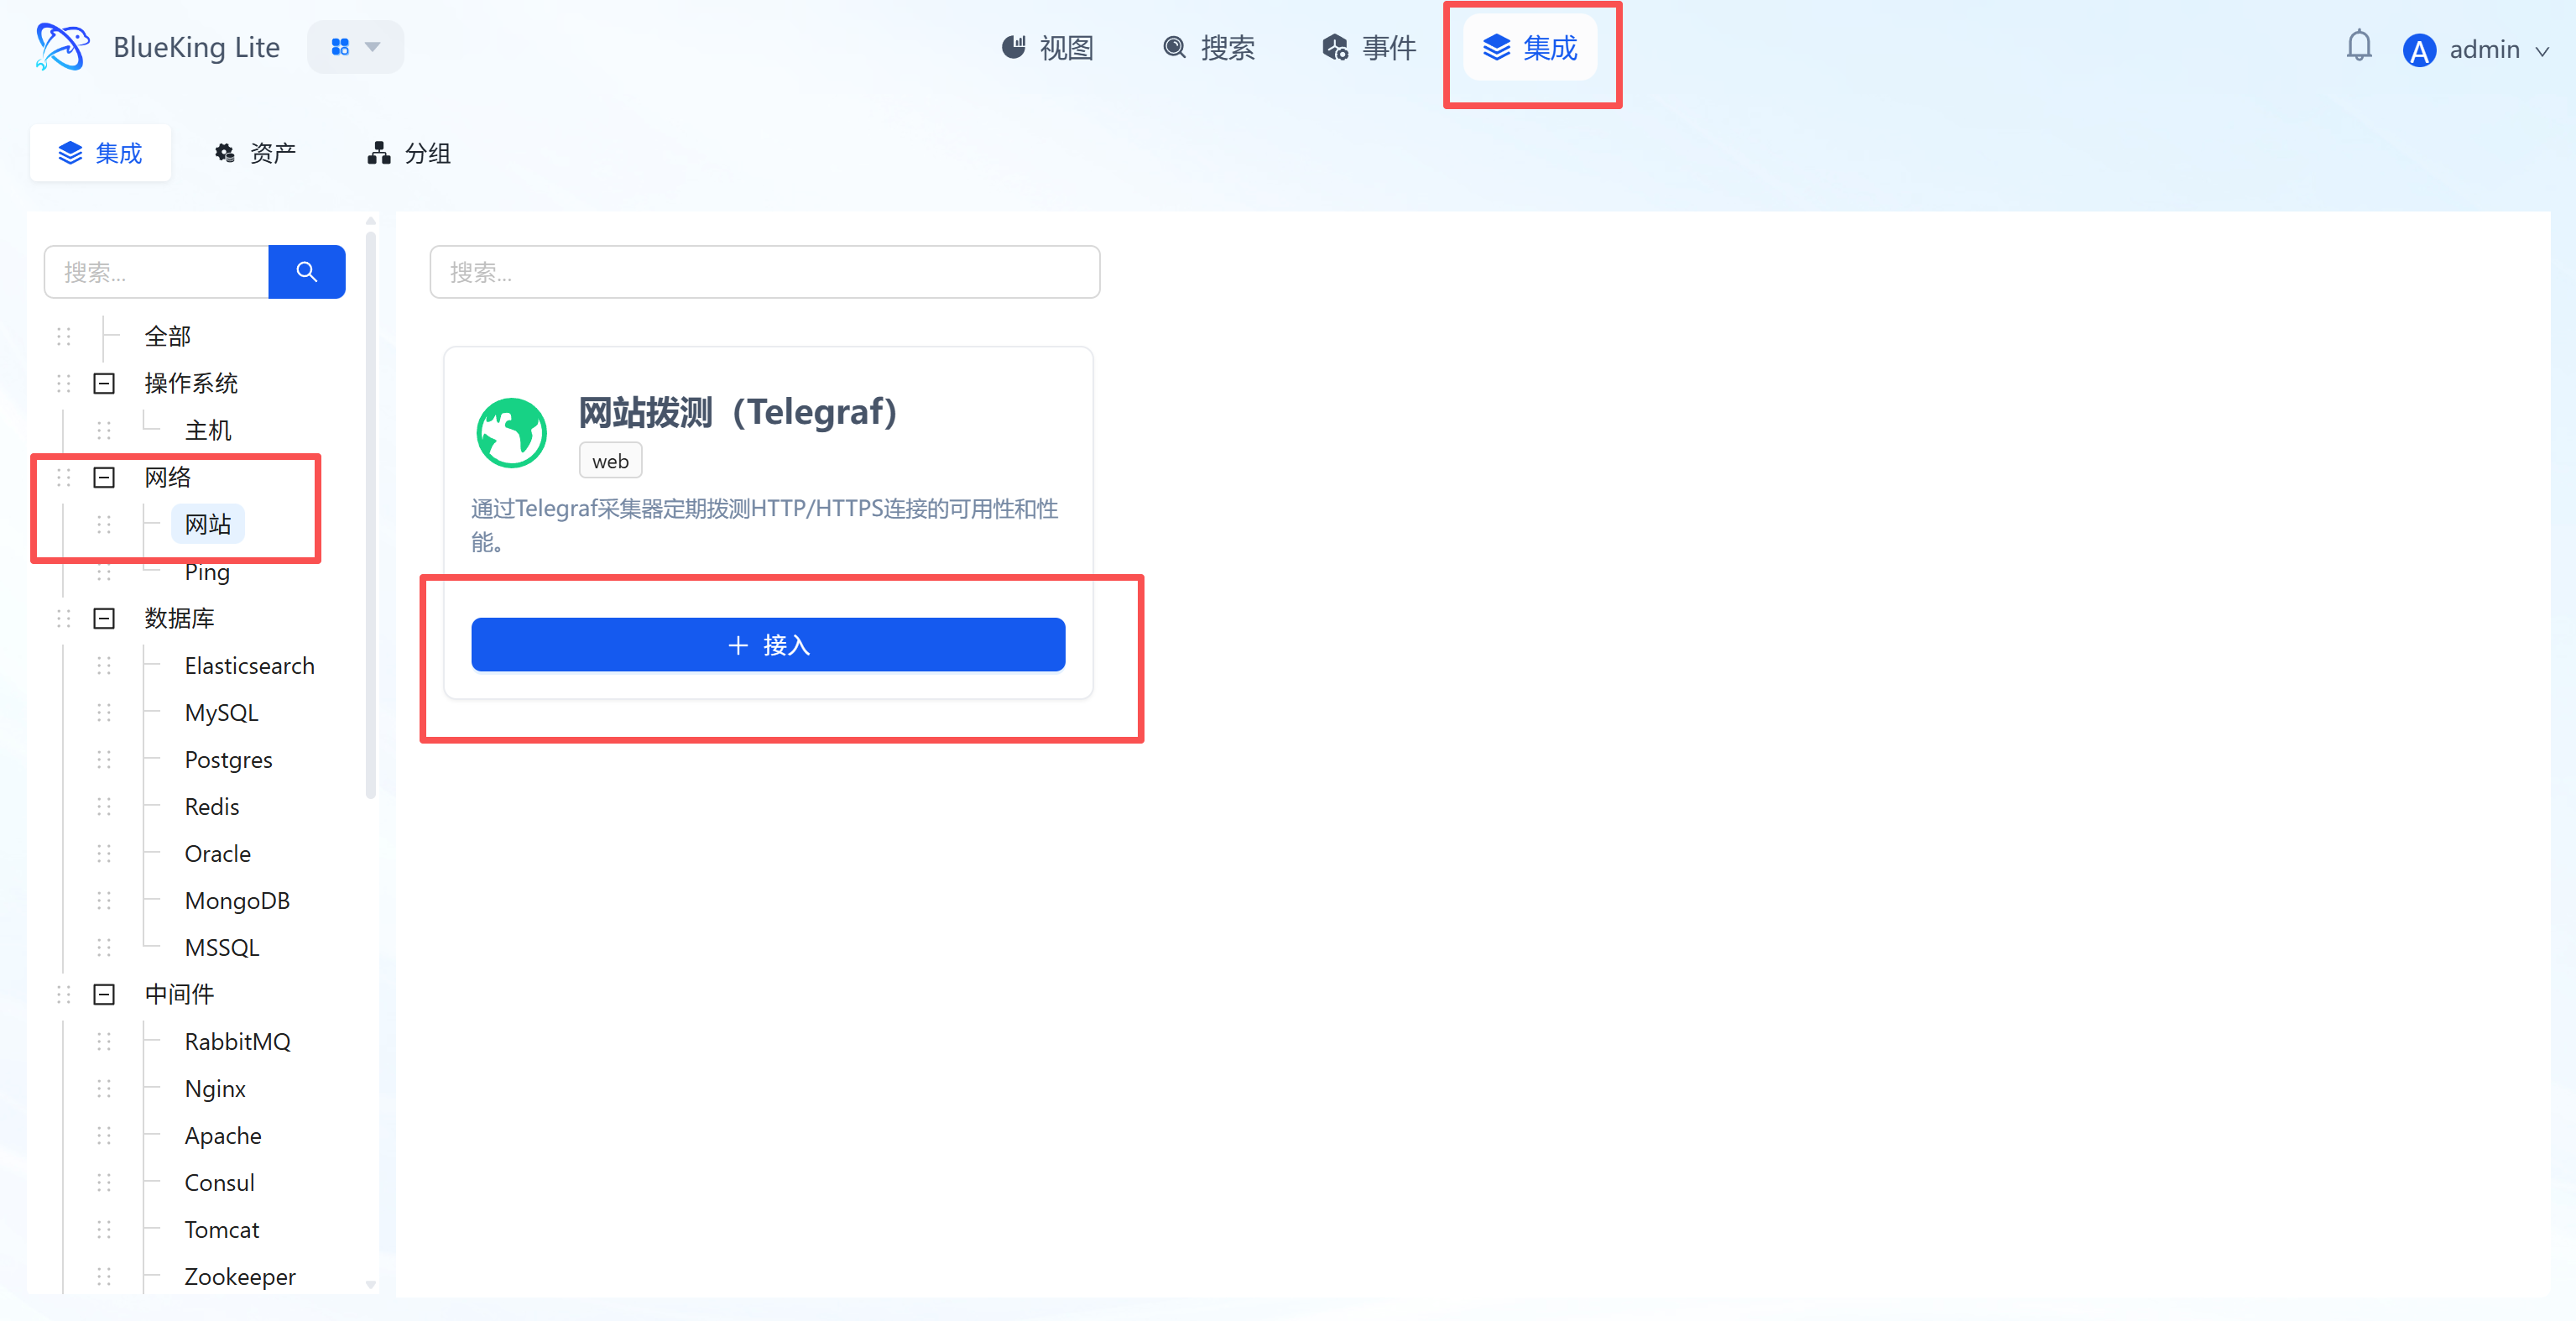
Step 1: Select an Integration Plugin
- After entering Monitor, click "Integration" in the top navigation bar.
- Select resource type:
- Expand the "Network" category in the left menu.
- Click "Website" (Web).
- Click "+ Integrate" at the top right of the list.
Screenshot Guide:
- Plugin description: This plugin uses the Telegraf collector and supports periodic connectivity checks for Web services.
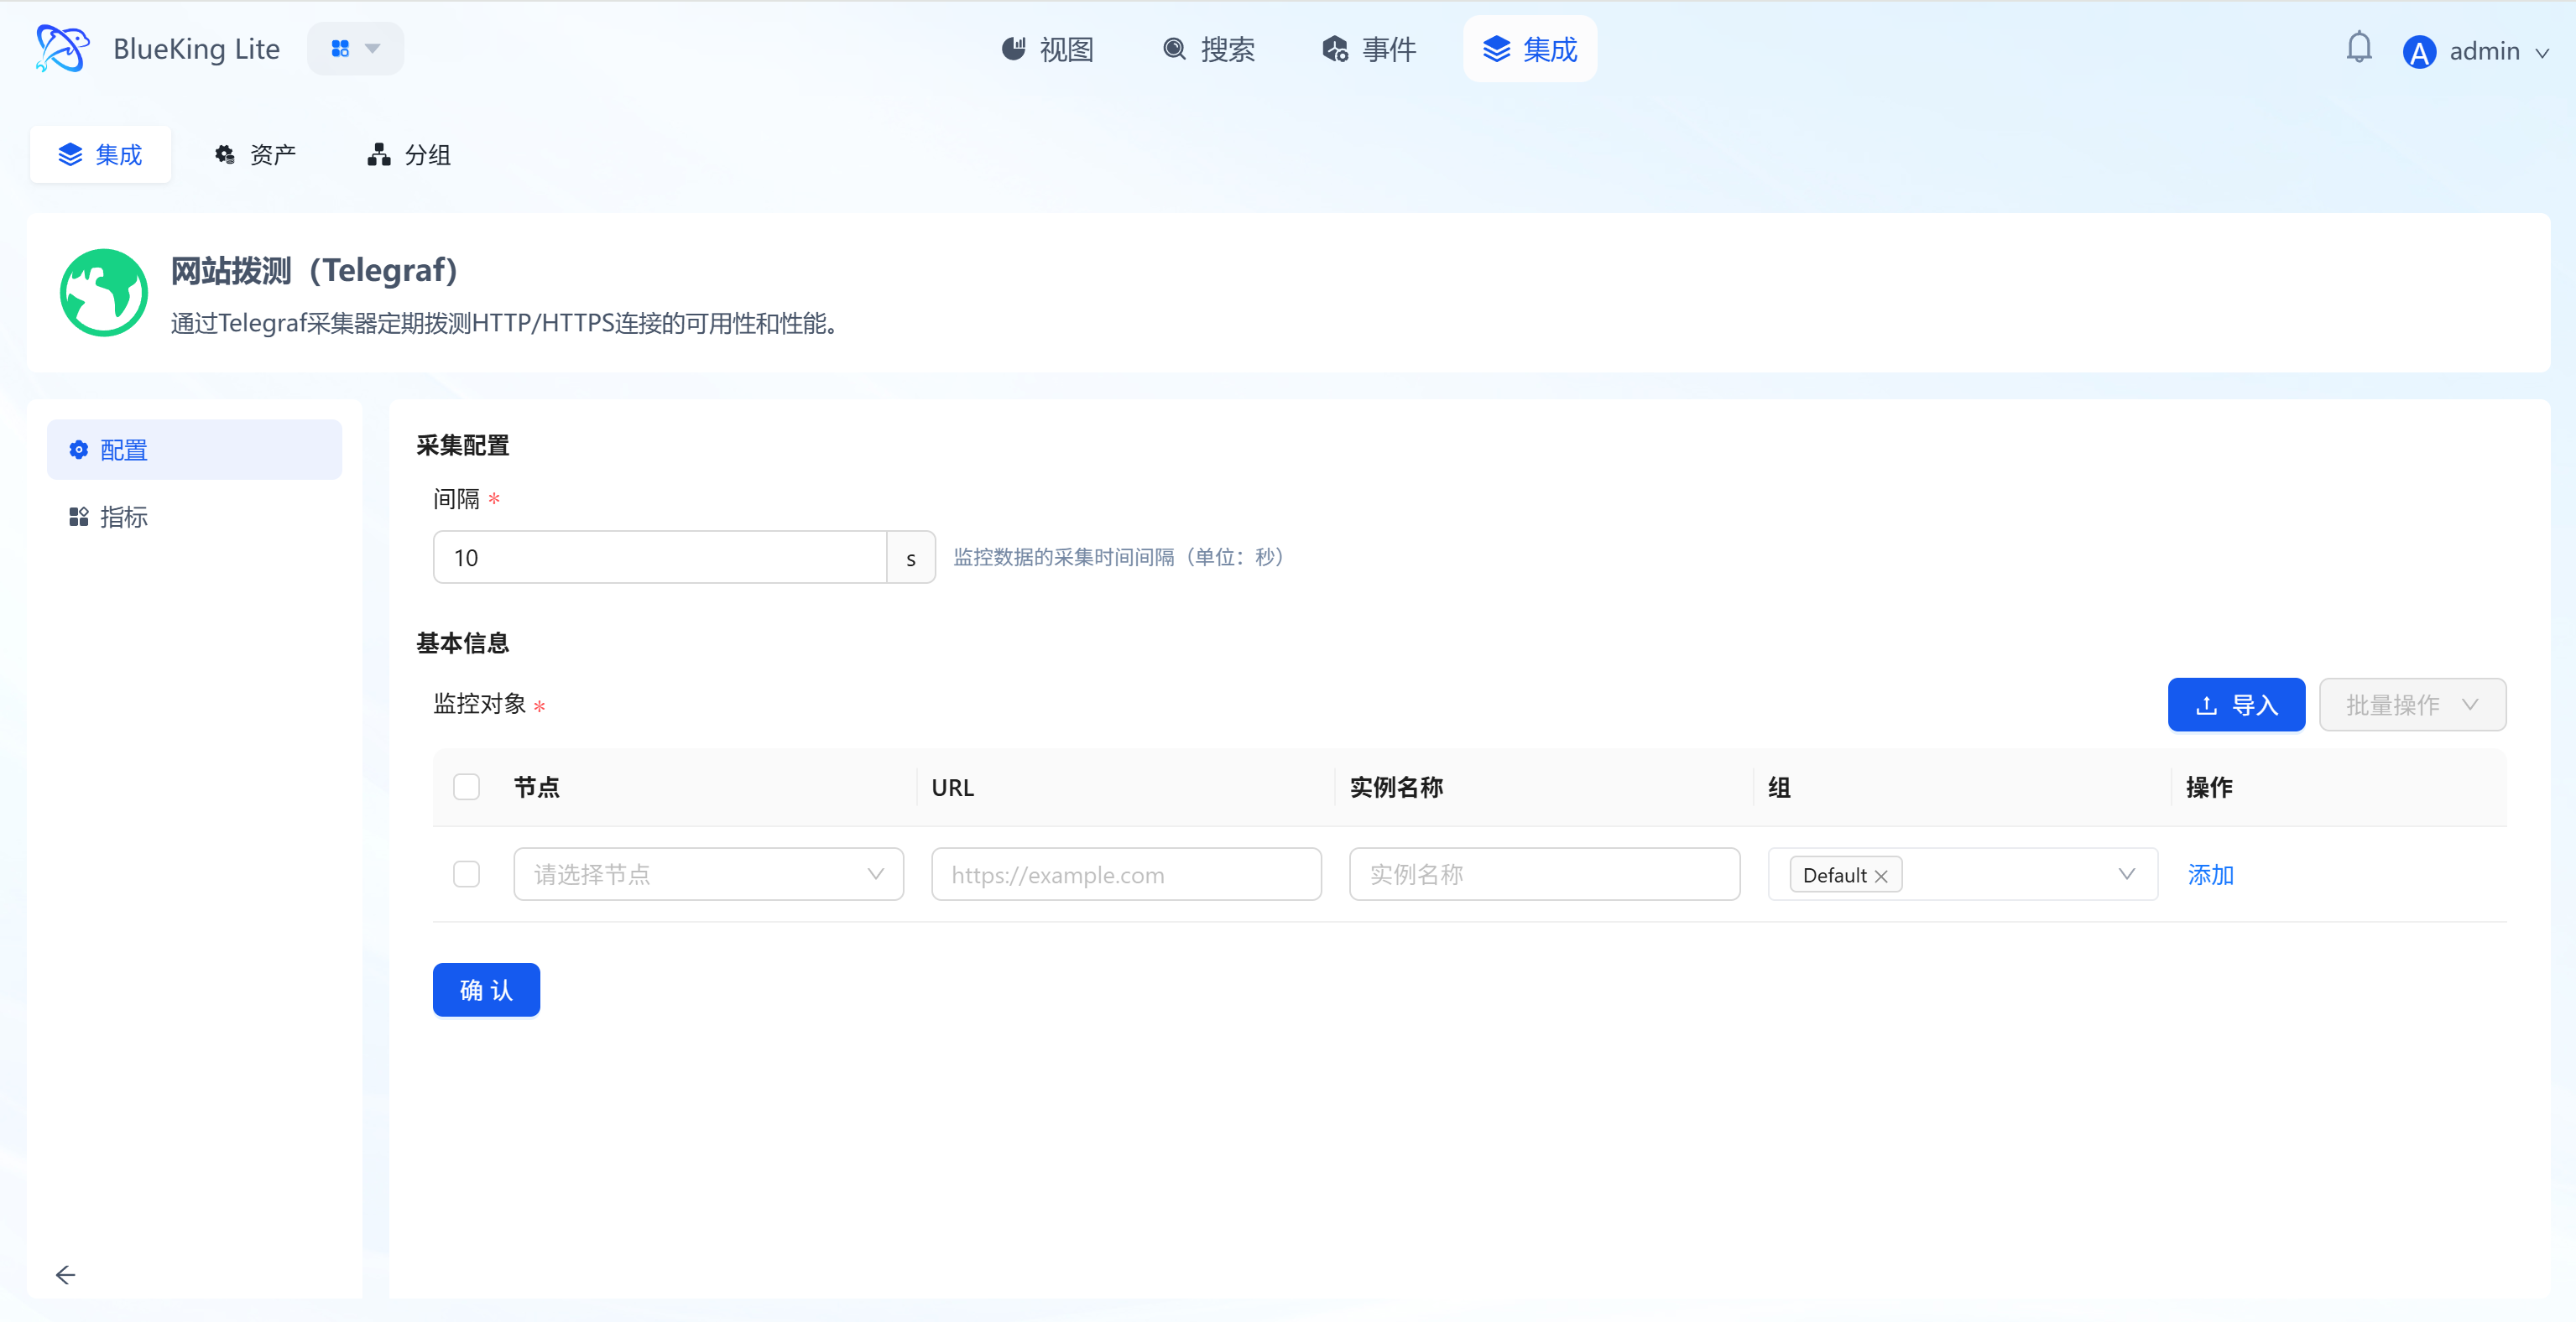
Step 2: Configure Collection Policy
In this step, you need to specify "who probes" (node) and "what to probe" (URL).
- Basic configuration:
- Interval: Set the probing frequency, default is
10s(i.e., one request every 10 seconds).
- Interval: Set the probing frequency, default is
- Configure monitoring targets:
- Node (Probe): Select a managed host from the dropdown as the "probe source".
- Note: Ensure the selected node can access the target URL (e.g., the node has internet access, or the node has network connectivity to the internal API).
- URL (Target): Enter the target address you want to monitor (e.g.,
https://www.baidu.comorhttp://192.168.1.100:8080/health). - Instance name: It is recommended to name it "WebsiteName-ProbeSource" for easy identification later.
- Node (Probe): Select a managed host from the dropdown as the "probe source".
- Click "Confirm".
Screenshot Guide:
- Configuration logic: The system will dispatch instructions to the selected "node" to access the specified "URL".
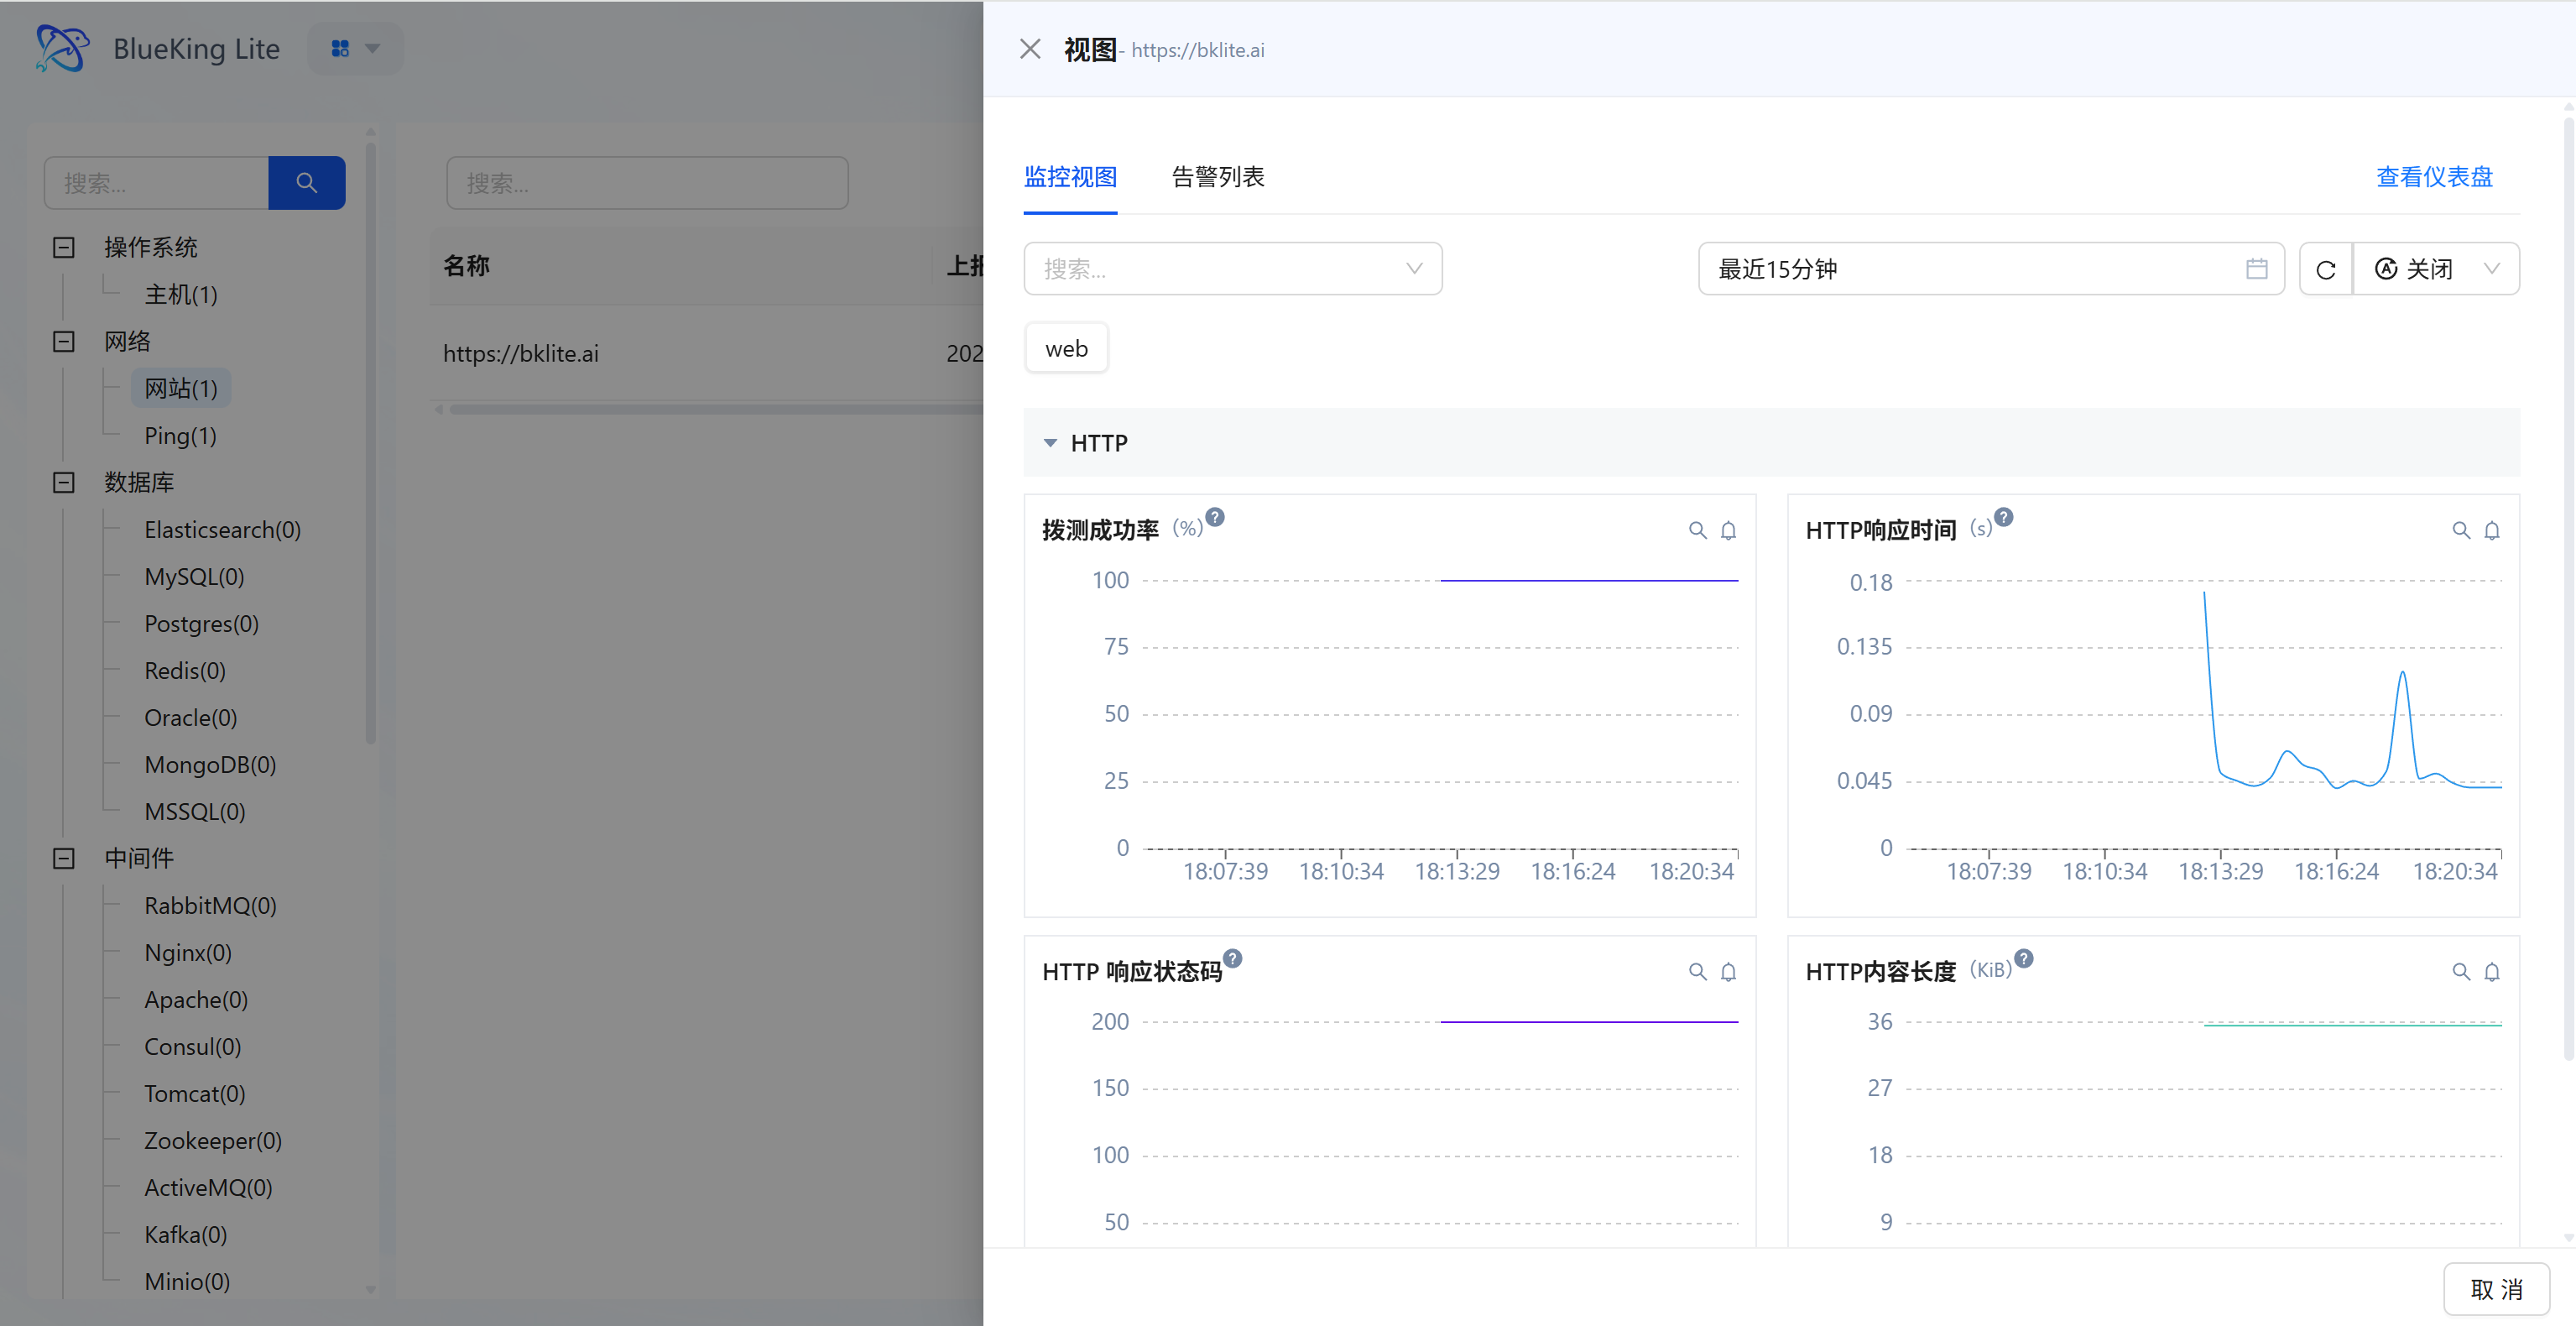
Step 3: Verify and Analyze
- After configuration is complete, click the "View" module at the top of the page.
- In the left resource category tree, expand "Network" -> "Website".
- Click to open the instance detail panel for the instance you just created (e.g.,
https://bklite.cn). - Data verification (metric cards or dashboard):
- Probing success rate: Check the website accessibility percentage (should be stable under normal conditions; a drop indicates probe failures).
- HTTP response time: View the request latency curve (in seconds); high peaks indicate network congestion or slow server response.
- HTTP response status code: Confirm whether the return code is stable (e.g.,
200in the chart indicates normal, while404/500indicates anomalies).
Screenshot Guide:
- Chart interpretation:
- Top right chart (Response time): A small peak appeared around 18:16, indicating a momentary slowdown in response.
- Bottom left chart (Status code): The purple line is stable at 200, indicating normal service status.
Integrating Ping Detection
This feature sends Ping packets from designated probe nodes to target IPs or domain names using the ICMP protocol to detect network-layer connectivity, packet loss rate, and round-trip latency.
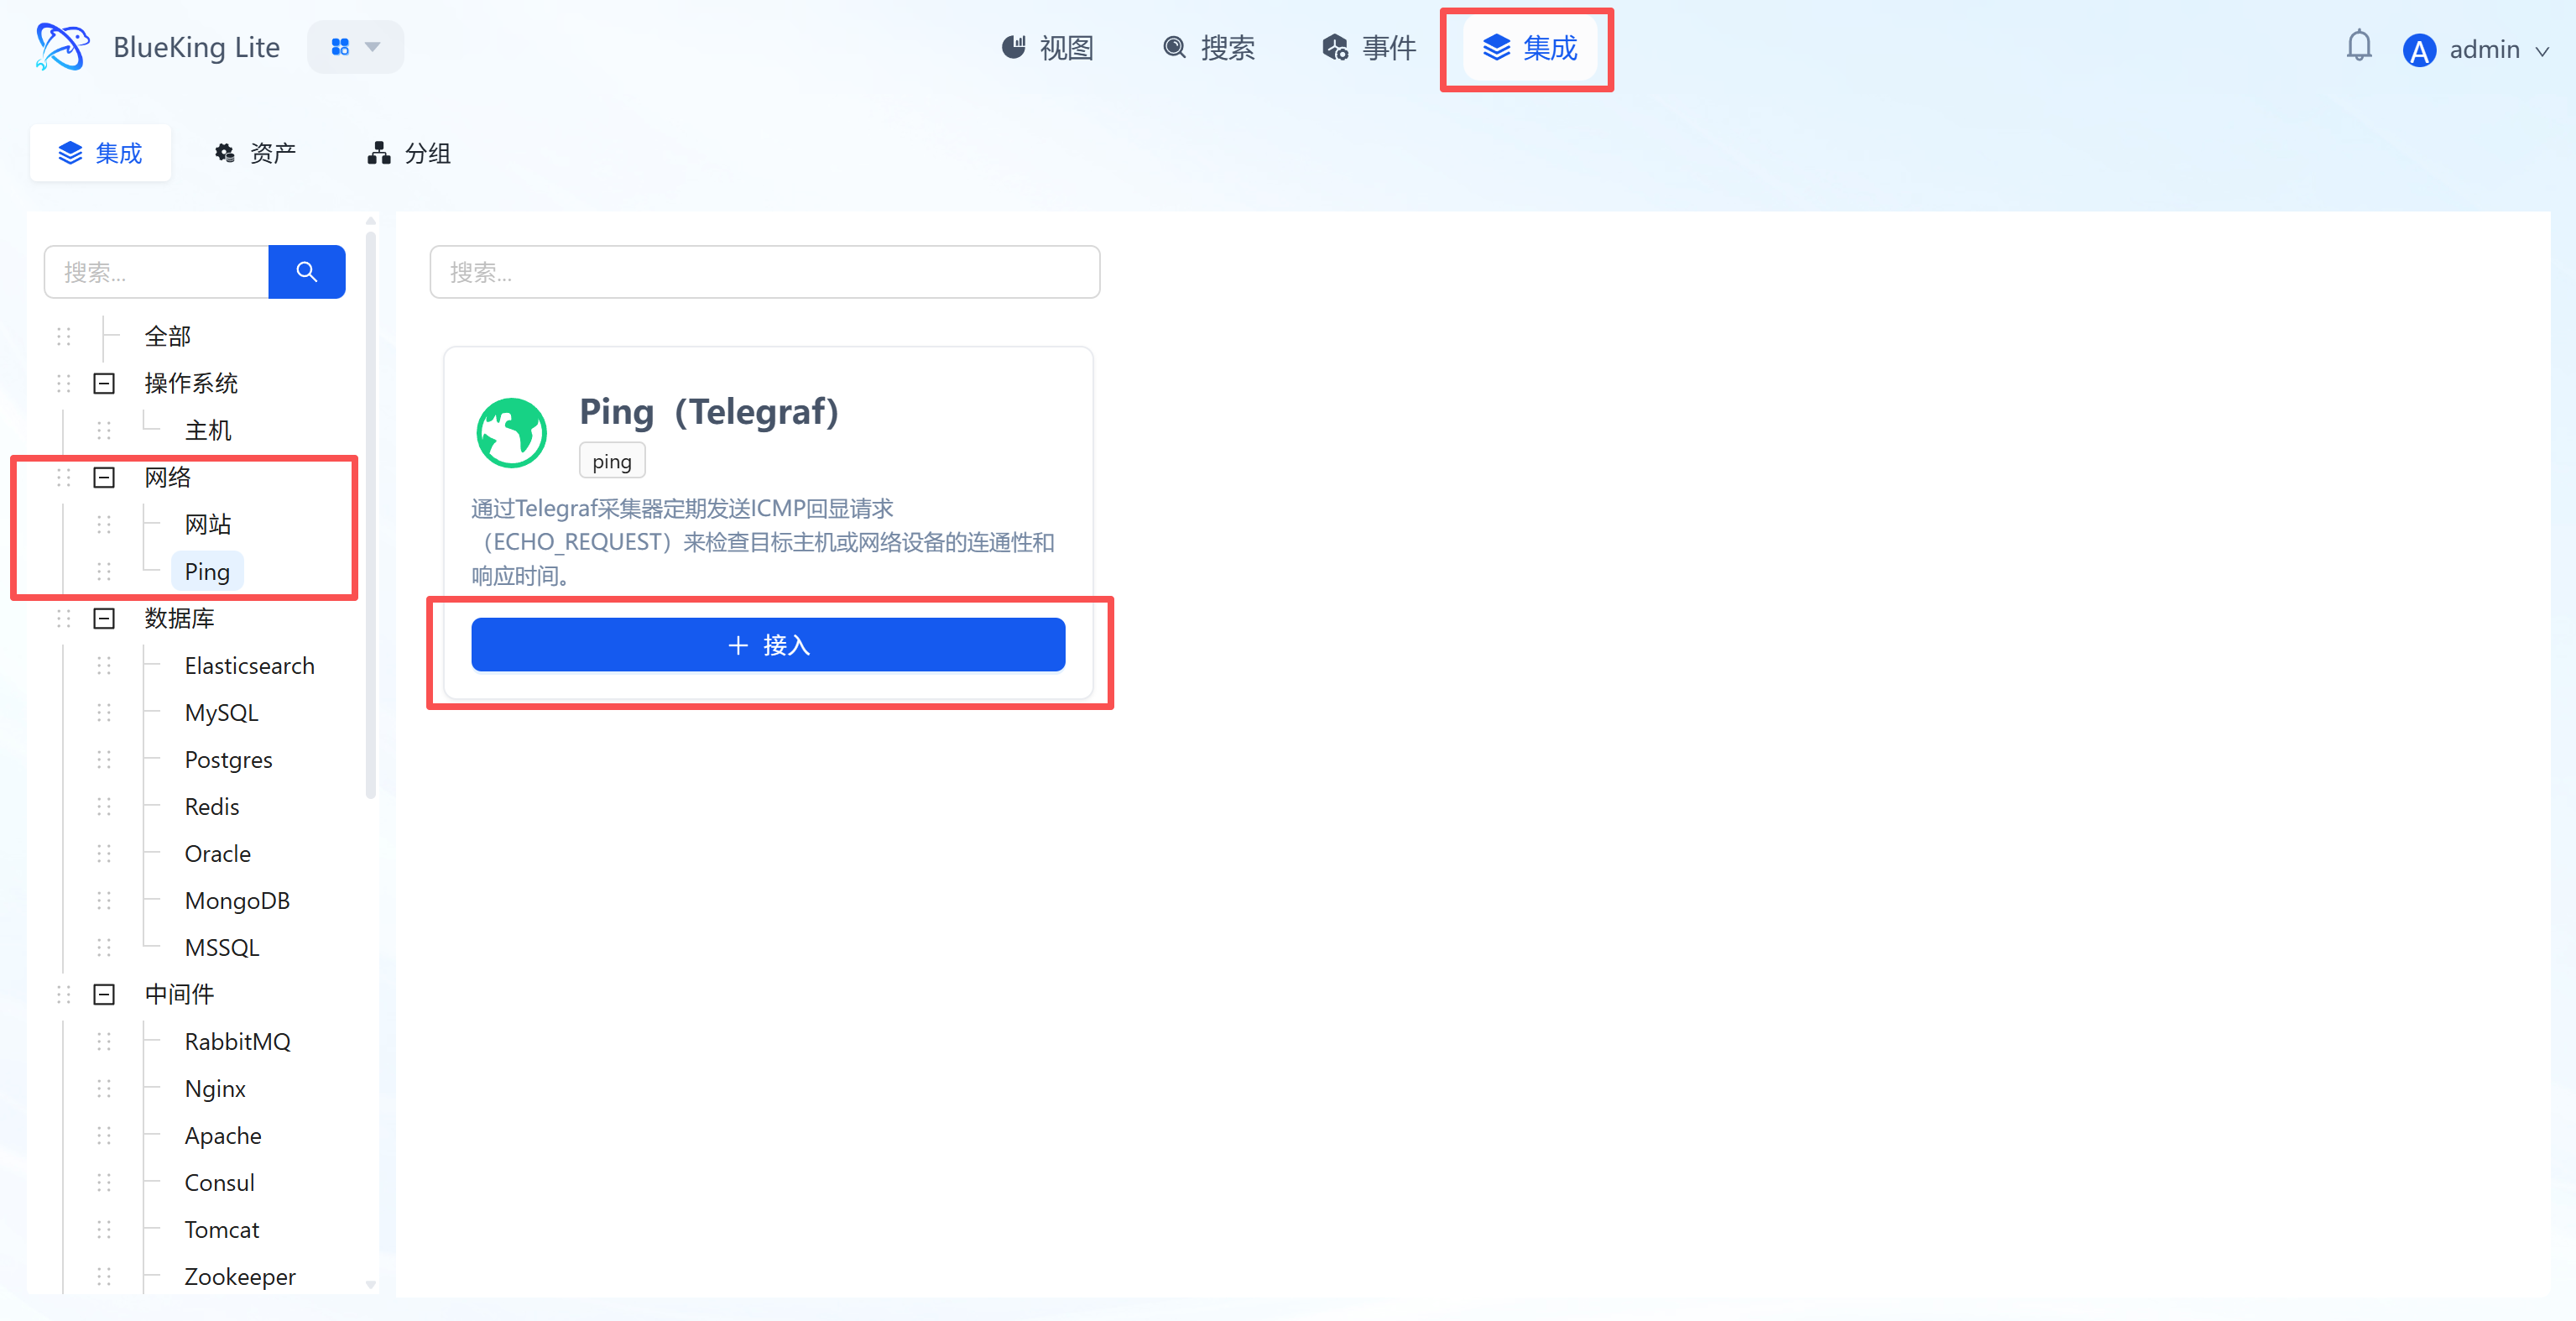
Step 1: Select an Integration Plugin
- Expand the "Network" category in the Monitor left menu.
- Click "Ping".
- Click "+ Integrate" at the top right of the list.
Screenshot Guide:
- Plugin description: This plugin uses Telegraf to send ICMP Echo Requests, suitable for detecting the connectivity status of servers, gateways, or network devices.
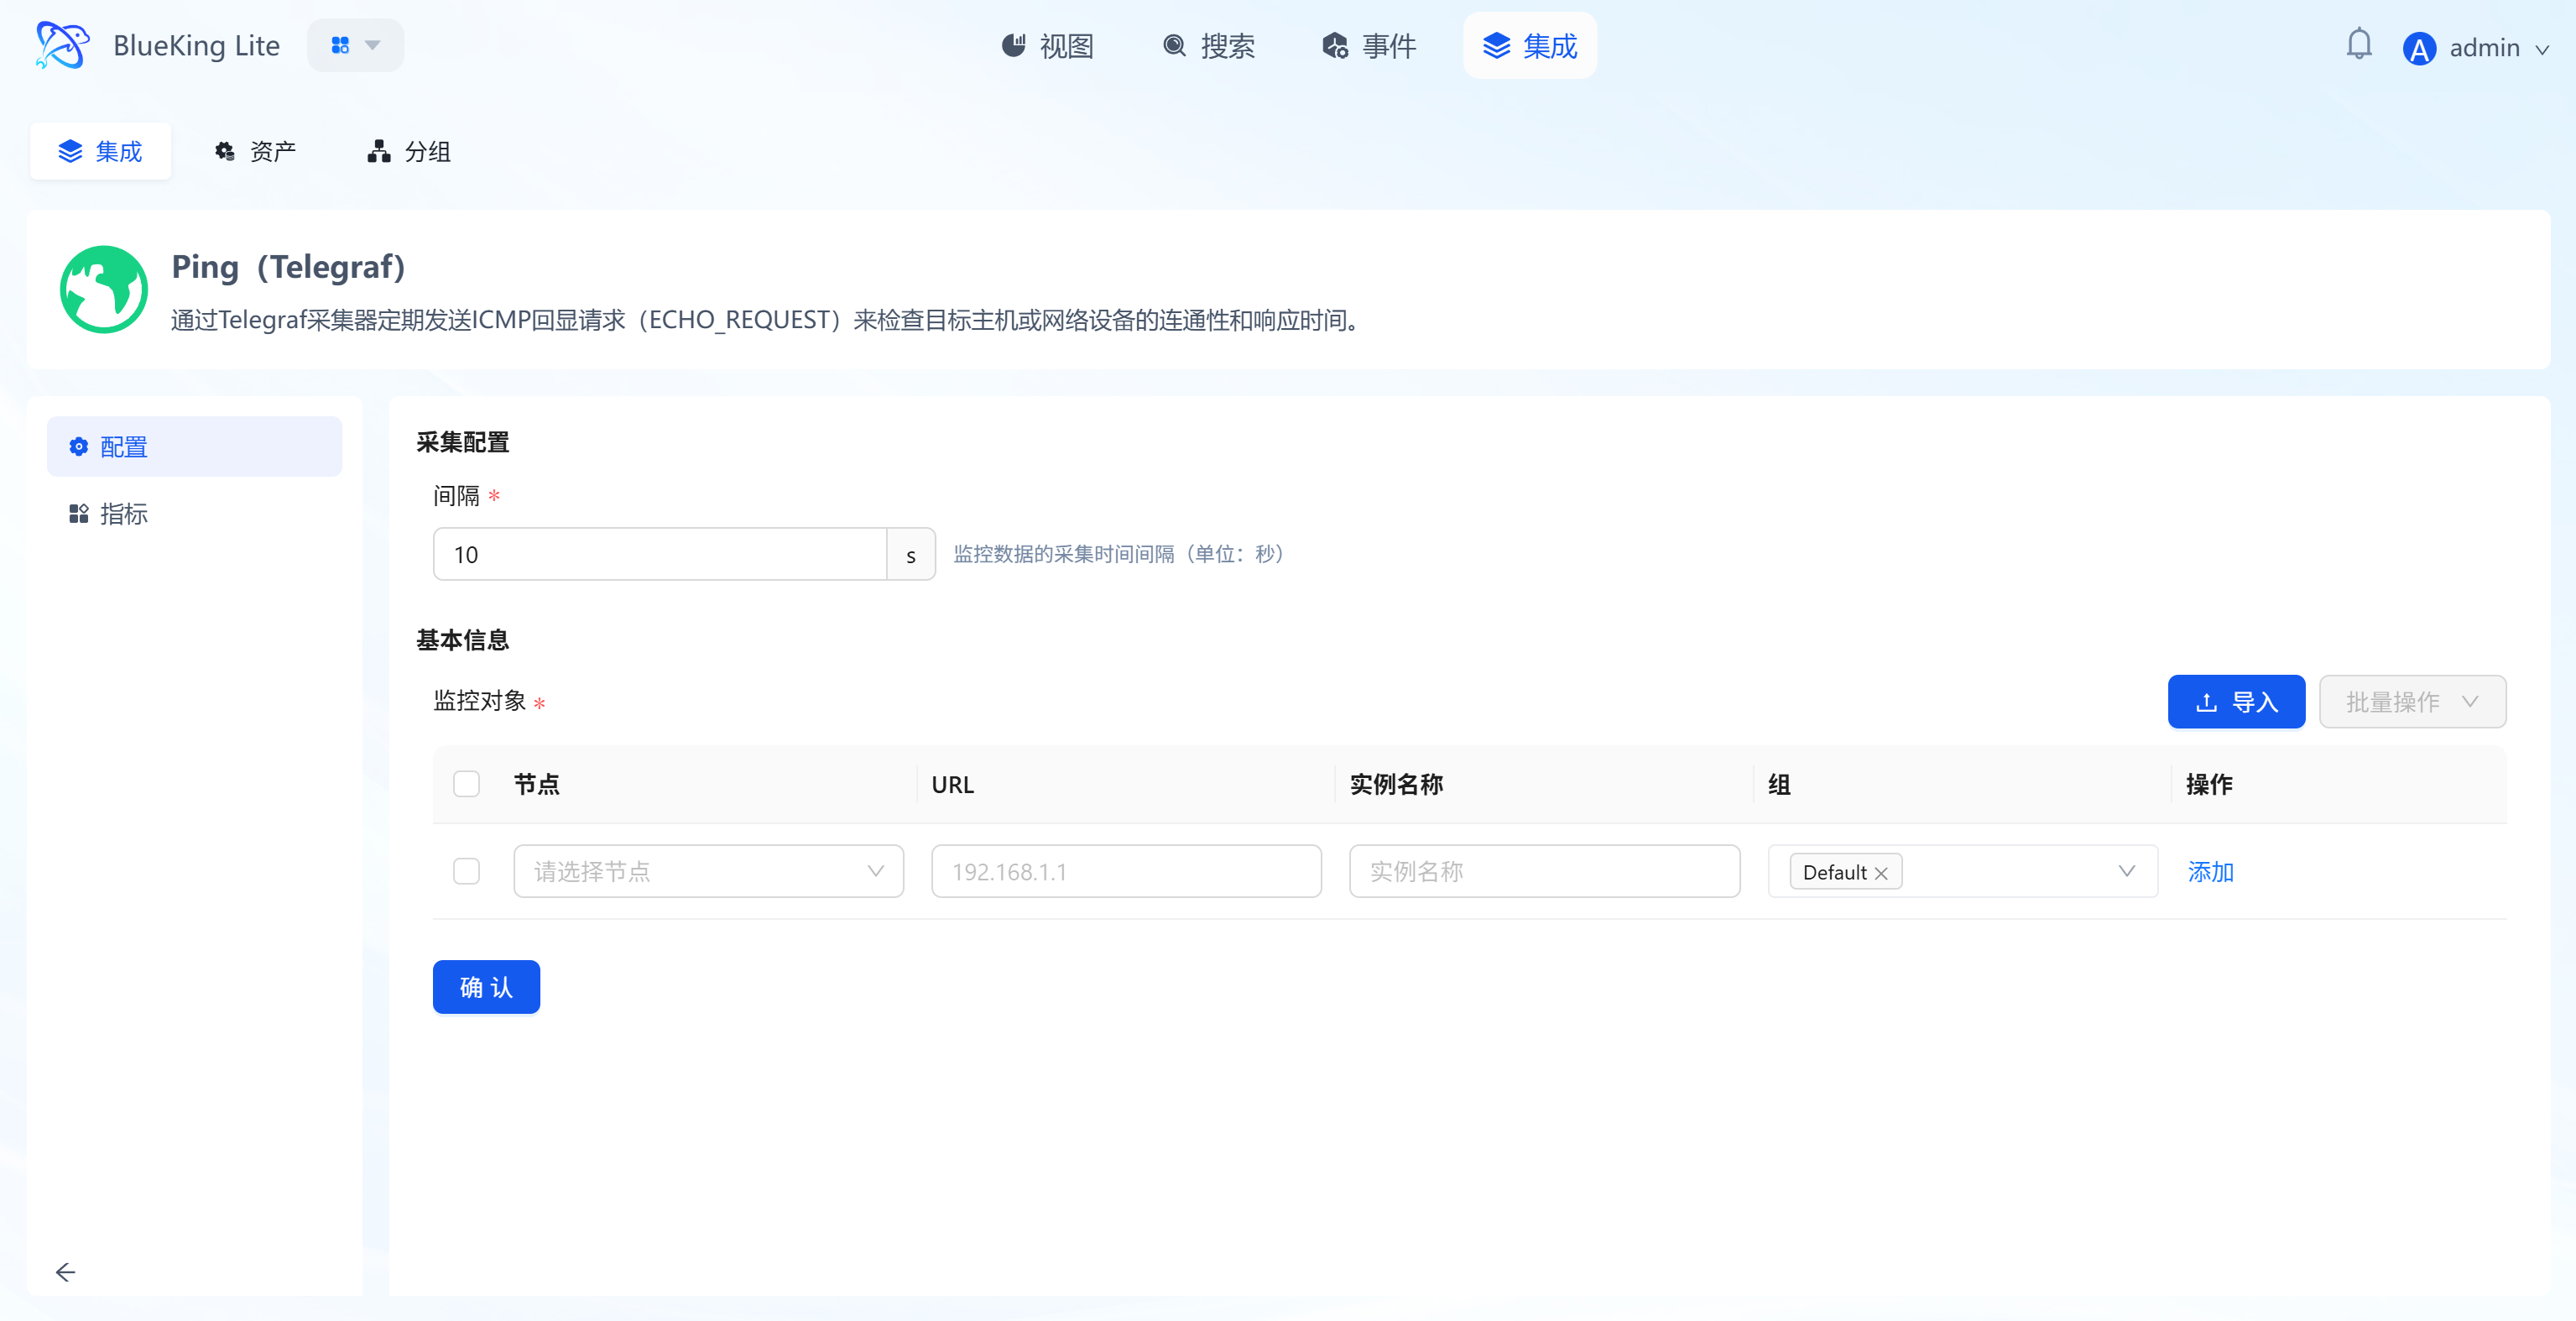
Step 2: Configure Collection Policy
In this step, you need to configure the packet source (node) and target address.
- Collection configuration:
- Interval: Default is
10s, meaning a Ping detection every 10 seconds.
- Interval: Default is
- Configure monitoring targets:
- Node: Select a managed host as the "packet source" (i.e., the machine that sends the Ping command).
- URL: Enter the target IP address or domain name to detect.
- Note: Although the interface displays "URL", for the Ping plugin, directly enter an IP (e.g.,
192.168.1.1) or domain name (e.g.,www.baidu.com), without thehttp://prefix.
- Note: Although the interface displays "URL", for the Ping plugin, directly enter an IP (e.g.,
- Instance name: It is recommended to name it "Ping-TargetIP" for easy identification.
- Click "Confirm".
Screenshot Guide:
- Configuration logic: The system controls the "node" to Ping the specified "URL (Target IP)".
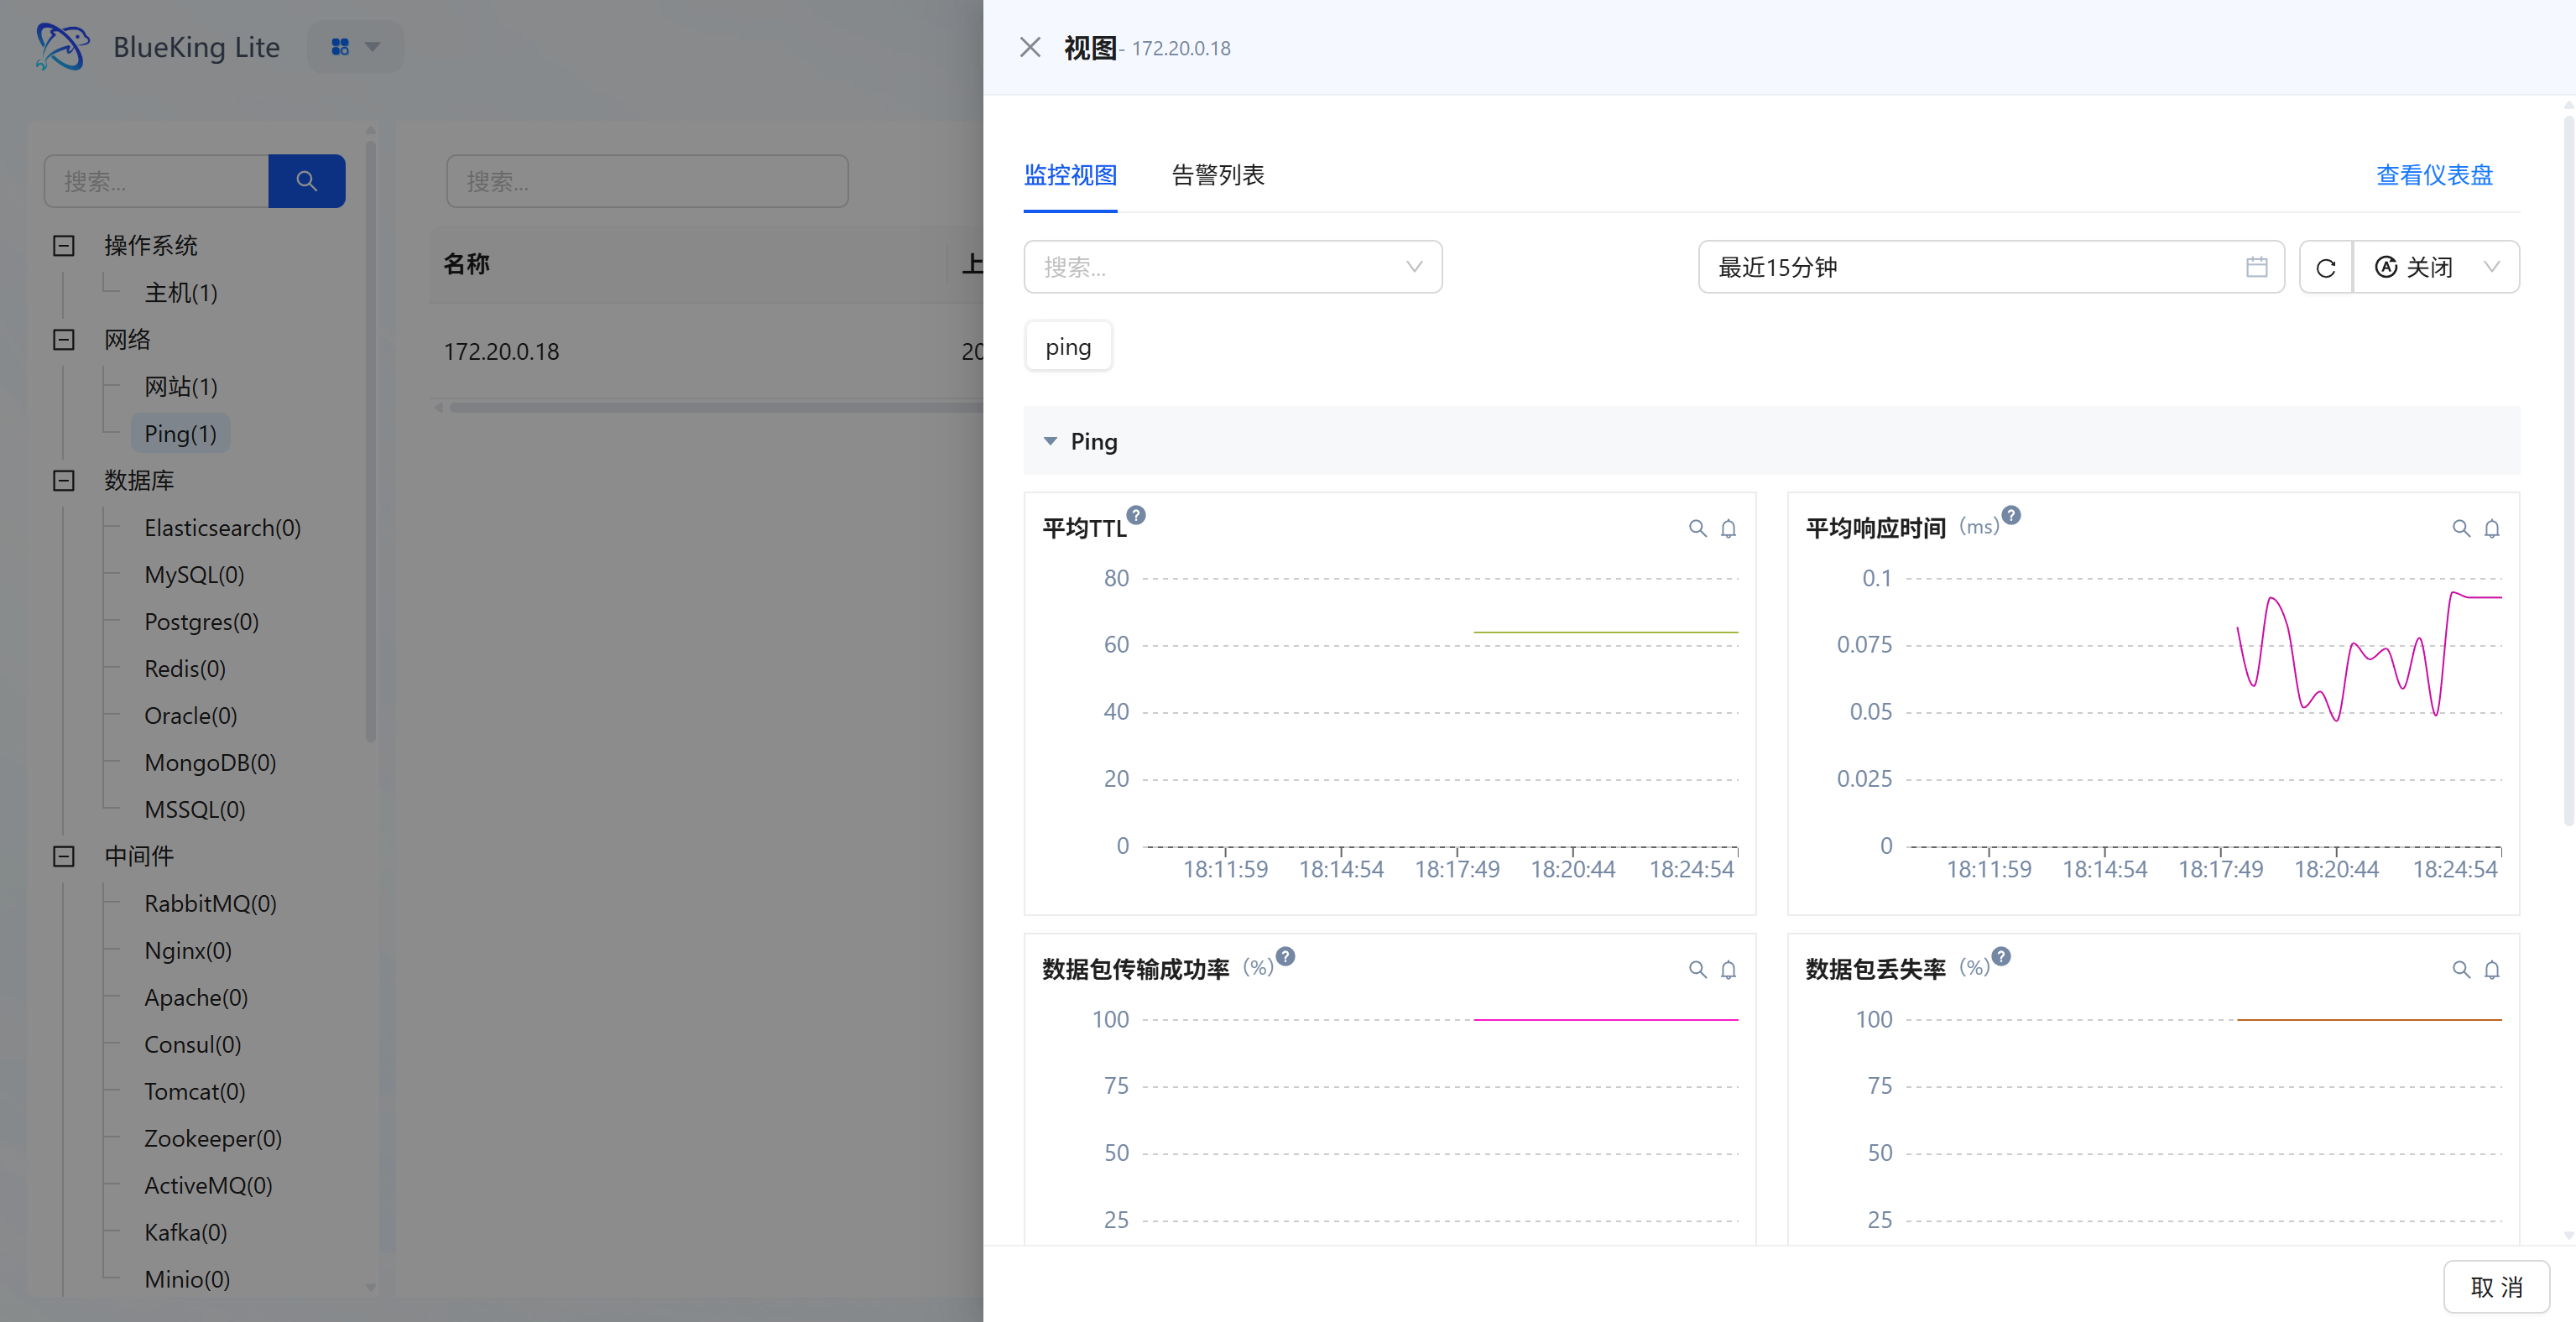
Step 3: Verify and Analyze
- After configuration is complete, click the "View" module at the top of the page.
- In the left resource category tree, expand "Network" -> "Ping" to enter the target list.
- Click to open the alert/monitoring properties panel for the instance you just created (e.g.,
172.20.0.18). - Data verification:
- Average response time (ms): View the network round-trip latency. As shown in the chart, very low values indicate extremely fast requests; if values are too large or fluctuate dramatically, it indicates network congestion.
- Packet transmission success rate (%): A core metric for measuring connectivity. A normal network environment should maintain a high success rate (e.g., 100%).
- Packet loss rate (%): If this metric is non-zero (showing peaks), it means the network is experiencing packet loss.
Screenshot Guide:
- Chart interpretation:
- Top right chart (Average response time): The curve shows millisecond-level latency fluctuations. The latency oscillates between 0.05ms and 0.1ms in the legend, which is normal network jitter.
- Bottom left chart (Transmission success rate): The pink line steadily maintains at the 100 mark, indicating good connectivity to the target IP with no packet loss.
Database Monitoring
This section covers the monitoring integration workflow for mainstream database components including Elasticsearch, MySQL, Redis, and more.
Integrating Elasticsearch
Connect to an Elasticsearch cluster via the Telegraf plugin to collect cluster health status, node performance, index statistics, and JVM memory usage.
Prerequisites
Before starting the integration, ensure the following conditions are met:
-
Version support
- ElasticSearch version:
6.8and above (recommended7.xor8.x) - Telegraf Agent: Installed and running on the designated collection node.
- ElasticSearch version:
-
Network connectivity
- Ensure the collection node server where Telegraf is installed can access the target ElasticSearch's HTTP/HTTPS port (default
9200, some environments may use custom ports such as39201). - If there are firewalls or security groups, please allow TCP traffic in advance.
- Ensure the collection node server where Telegraf is installed can access the target ElasticSearch's HTTP/HTTPS port (default
-
Create a dedicated monitoring account (Security best practice) To follow the principle of least privilege and avoid configuring the
elasticsuperadmin account in plaintext, it is recommended to create a read-only dedicated account via the REST API.Steps are as follows:
Note: If your ES cluster has HTTPS enabled with self-signed certificates (e.g., in an intranet environment), add the
-kparameter to the followingcurlcommands to skip certificate verification.a. Create a read-only role (Role) First, define a role named
read_only_rolewith only cluster monitoring and index read privileges. Replace the IP and port in the URL with actual values, and authenticate with the superadmin account.curl -k -u elastic:<superadmin_password> -X POST "https://<ES_Host_IP>:<port>/_security/role/read_only_role" \
-H "Content-Type: application/json" \
-d '{
"cluster": ["monitor"],
"indices": [
{
"names": [ "*" ],
"privileges": [ "read", "view_index_metadata" ]
}
]
}'b. Create a monitoring user (User) Create a user named
monitor_userand assign the read-only role created above.curl -k -u elastic:<superadmin_password> -X POST "https://<ES_Host_IP>:<port>/_security/user/monitor_user" \
-H "Content-Type: application/json" \
-d '{
"password": "<set_your_secure_password>",
"roles": [ "read_only_role" ],
"full_name": "Telegraf Monitor User"
}'c. Verify permissions Use the newly created account to access the cluster root. If version information is returned, the configuration is successful.
curl -k -u monitor_user:<your_secure_password> -X GET "https://<ES_Host_IP>:<port>/"Explanation:
cluster: ["monitor"]: Allows the collector to retrieve cluster-level health status and statistics (Cluster Stats).indices: ["read", "view_index_metadata"]: Allows the collector to read index-level statistics (Index Stats), but does not allow modifying or deleting data, thereby ensuring data security.
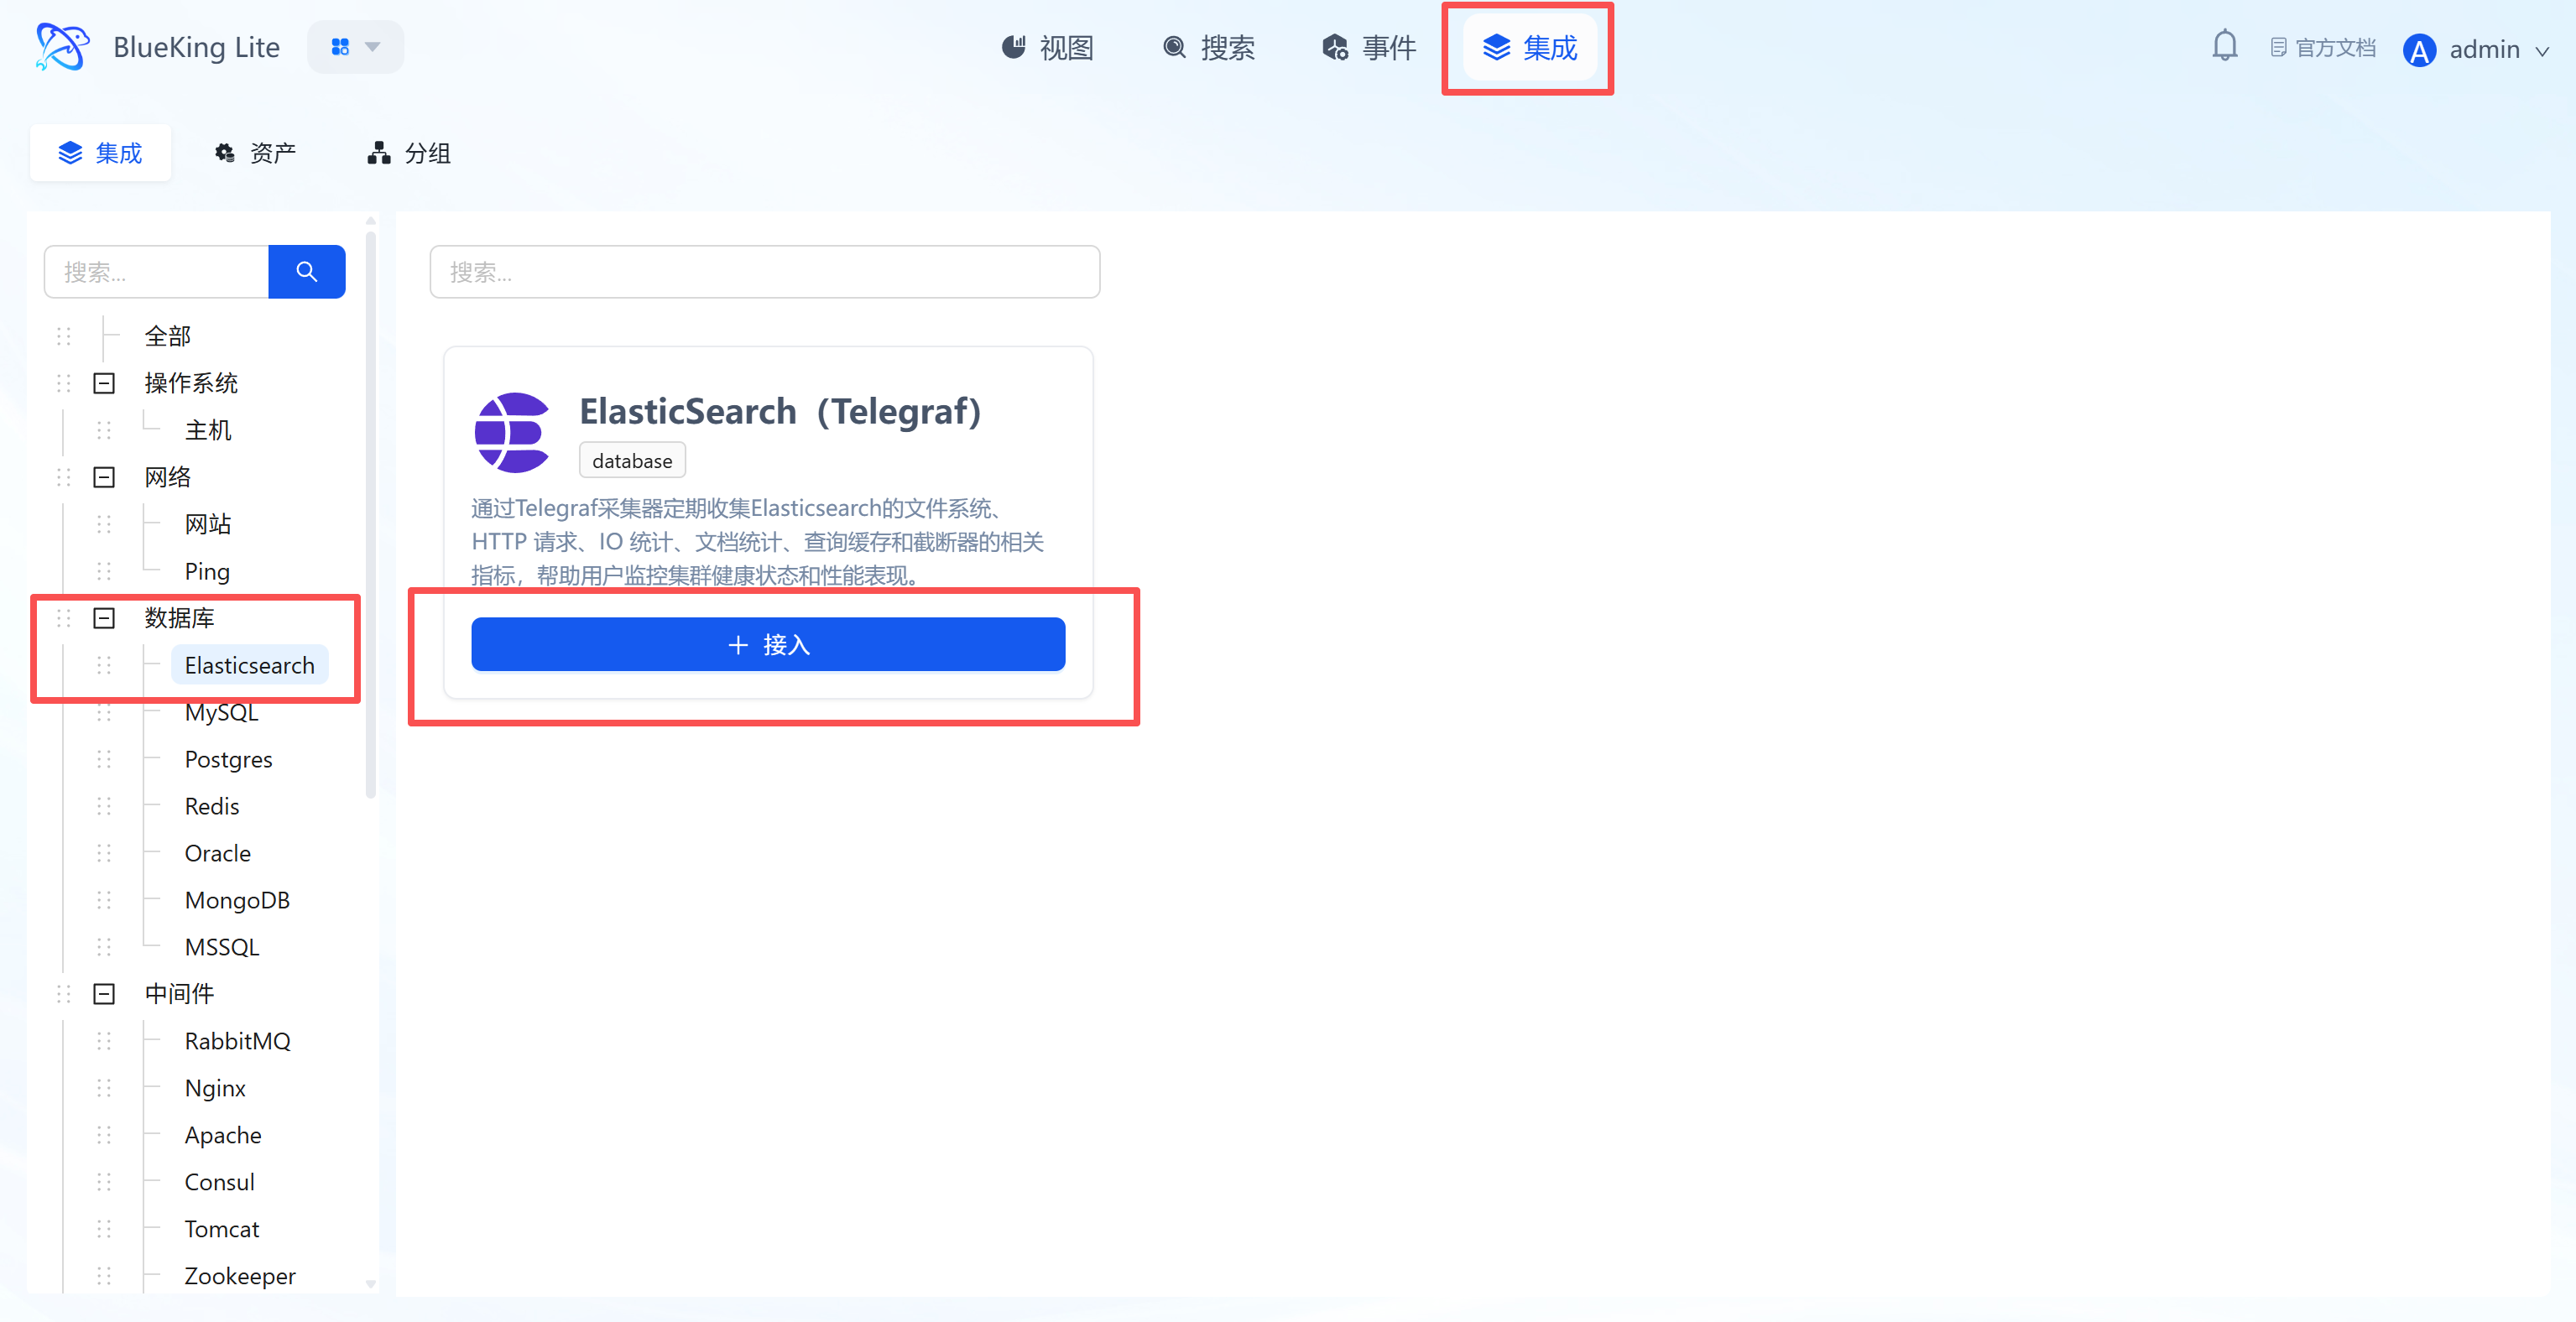
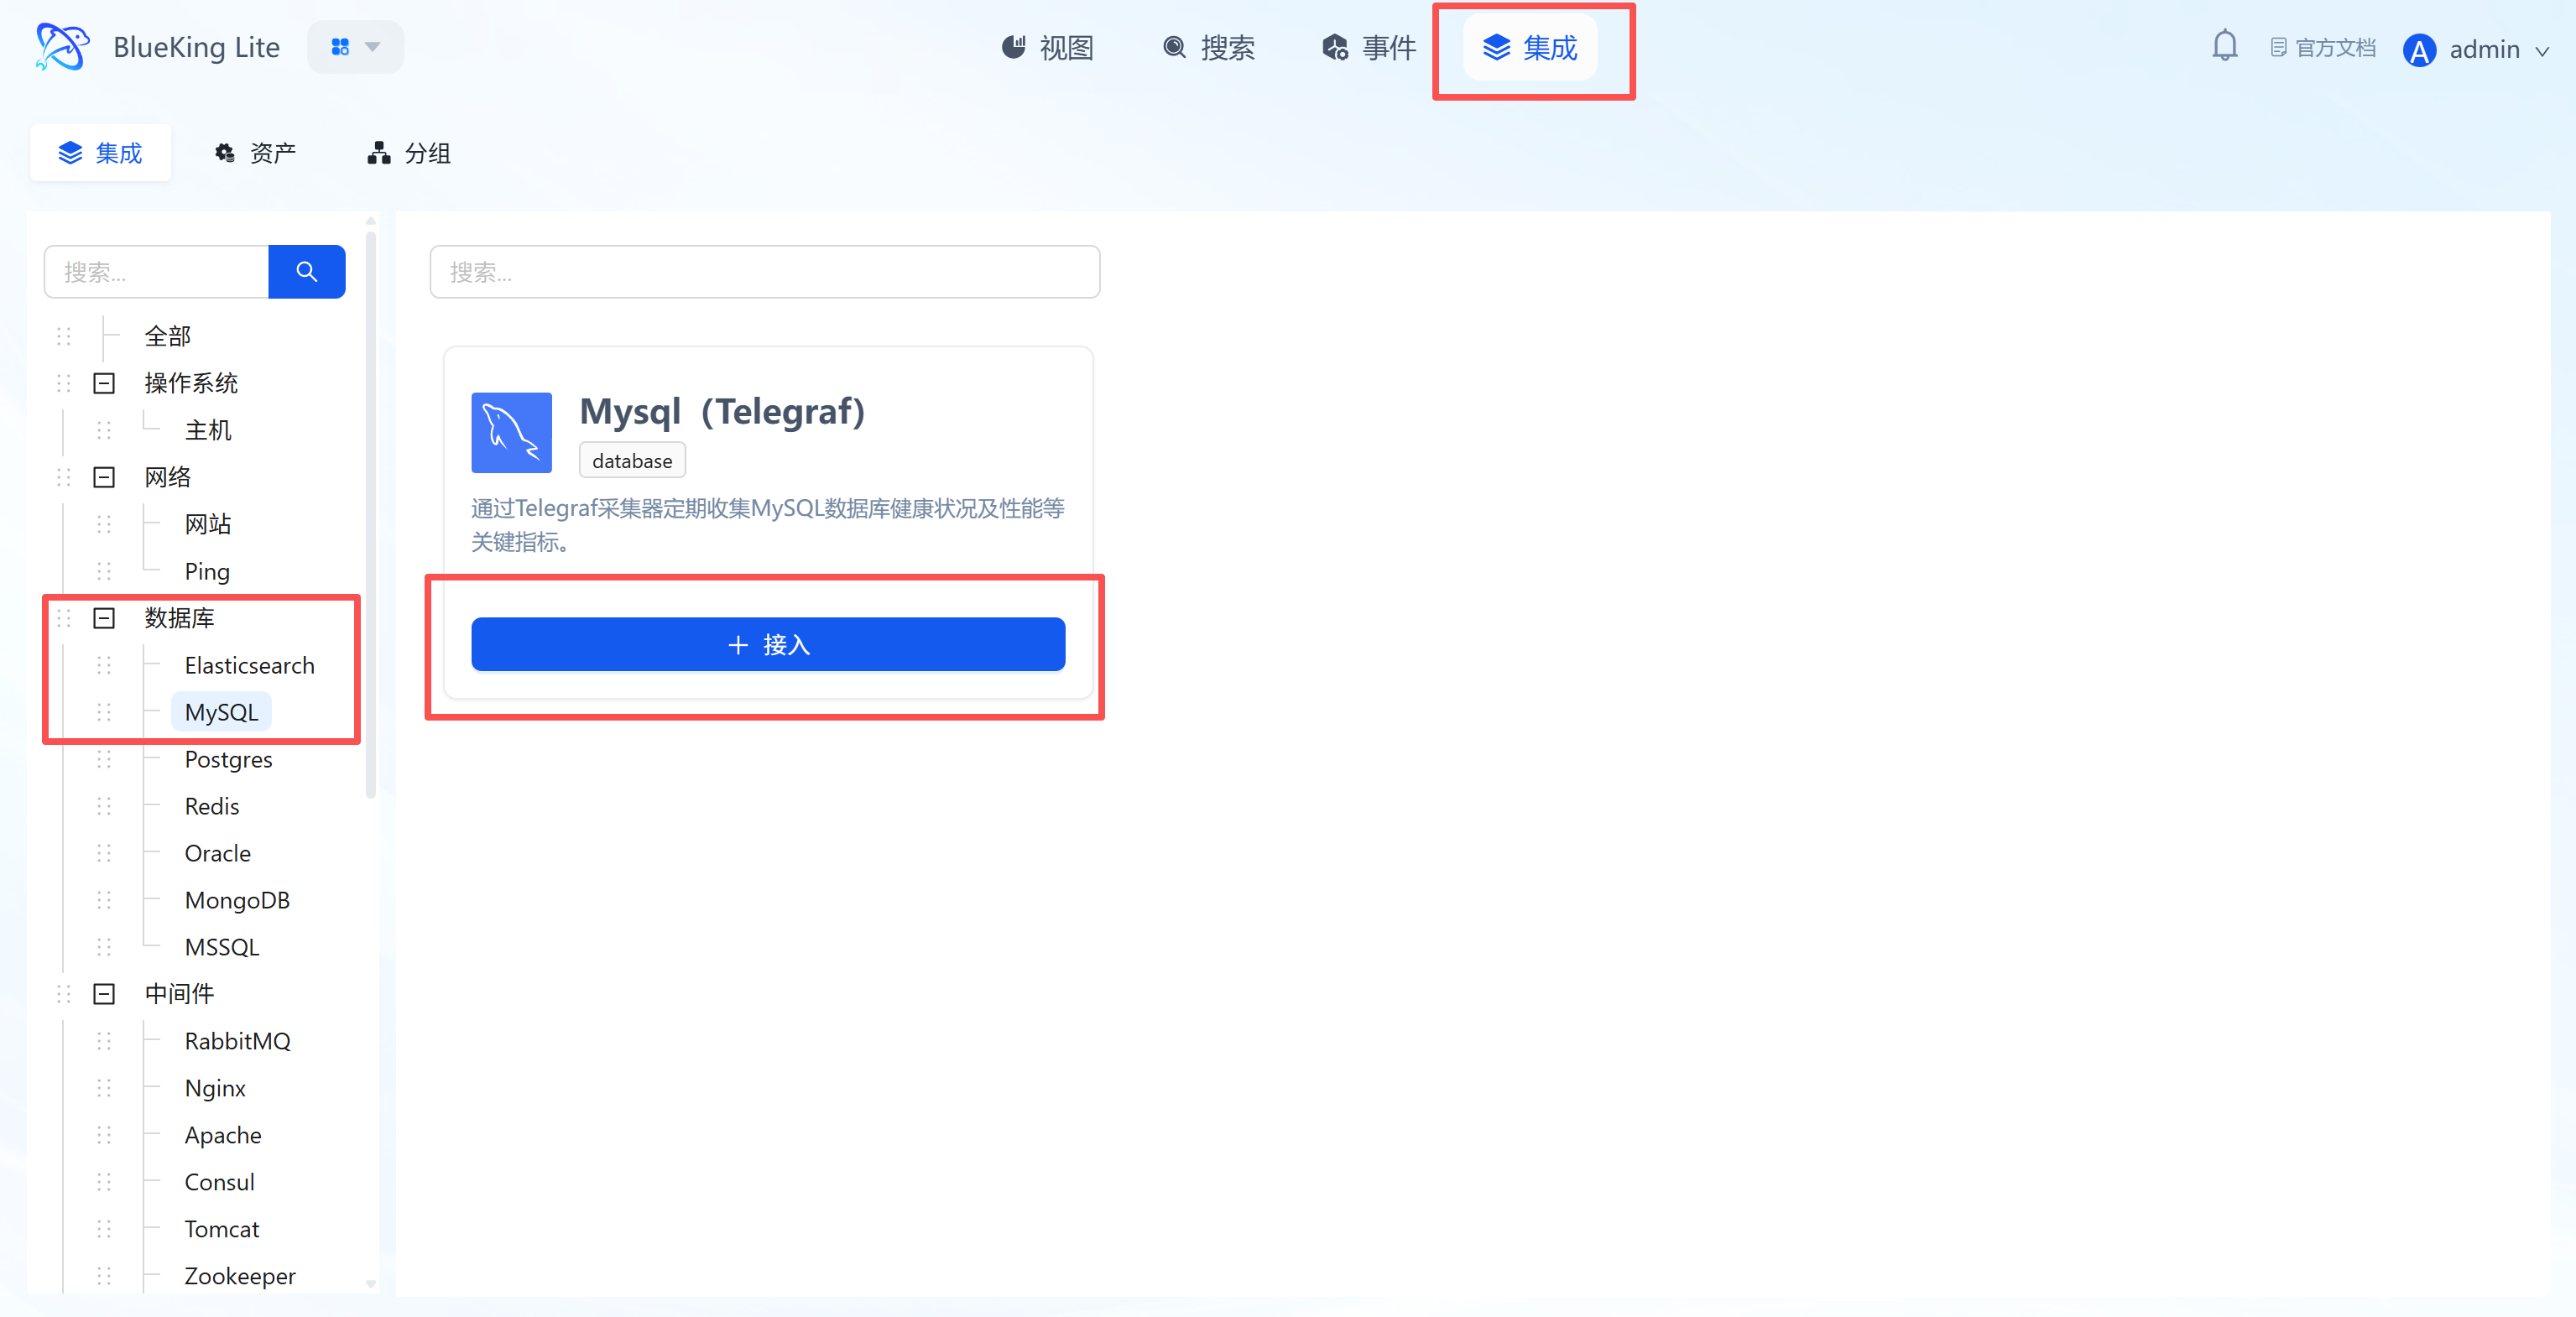
Step 1: Select an Integration Plugin
- After entering Monitor, click "Integration" in the top navigation bar.
- Select resource type:
- Expand the "Database" category in the left menu.
- Click "Elasticsearch".
- Click "+ Integrate" at the top right of the list.
Screenshot Guide:
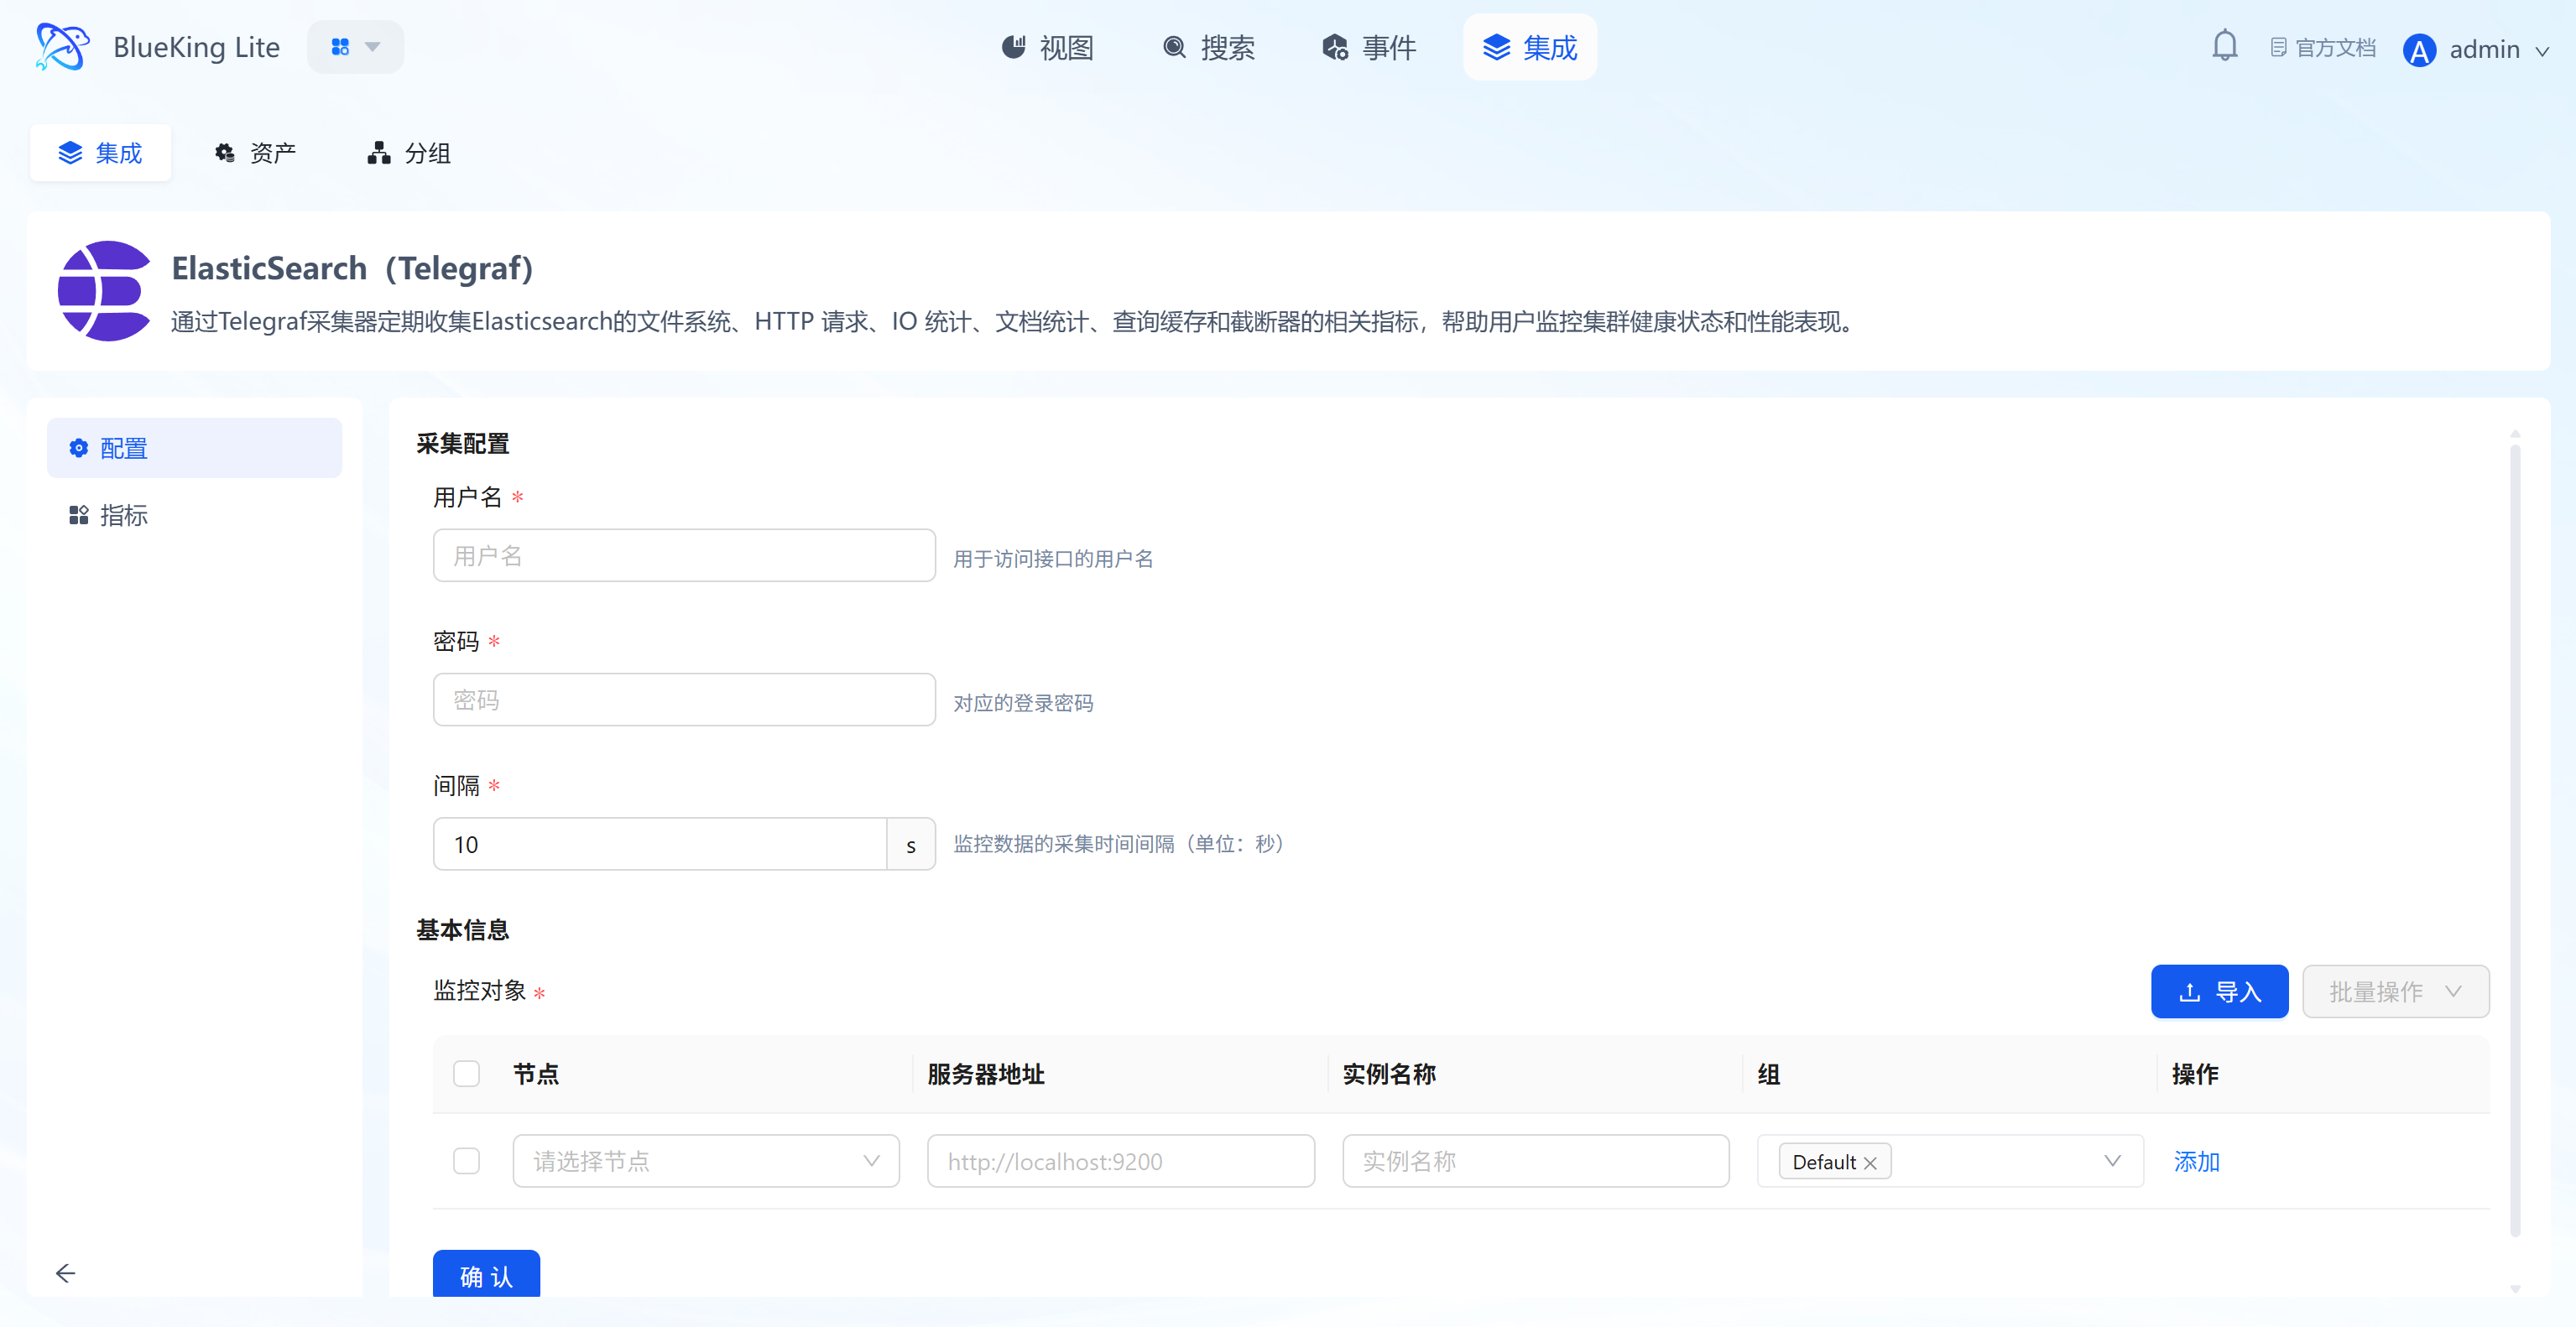
- Plugin description: Supports collecting core metrics such as file system, HTTP requests, IO statistics, and document statistics to help you monitor cluster health.
Step 2: Configure Collection Policy
In this step, you need to configure connection credentials and target address.
- Collection configuration (authentication information):
- Username/Password: If your ES cluster has security authentication enabled (X-Pack/Security), please fill in here; leave blank if no password is required.
- Interval: Default is
10s.
- Configure monitoring targets:
- Node: Select a node with the collector installed (typically the ES server itself, or a jump host that can connect to ES).
- Server address: Enter the ES access address.
- Example: For local collection, enter
http://localhost:9200; for remote collection, enterhttp://192.168.1.x:9200.
- Example: For local collection, enter
- Instance name: It is recommended to name it "ES-ClusterName".
- Click "Confirm".
Screenshot Guide:
- Server address: Make sure to include the protocol prefix (
http://orhttps://) and port number (default9200).
Step 3: Verify and Analyze
- Click the "View" module at the top of the page.
- In the left resource category tree, expand "Database" -> "Elasticsearch", and click the target instance to open the panel analysis view or enter the full panorama dashboard.
- Data verification:
- Cluster Health: Check the cluster health status (Green/Yellow/Red).
- Indices/Nodes: View the total number of indices and nodes.
- JVM Heap: Monitor heap memory usage to prevent OOM risks.
Integrating MySQL
Connect to a MySQL database via the Telegraf plugin to collect core performance metrics such as QPS, connections, slow queries, and traffic.
Prerequisites
Before starting the integration, ensure the following conditions are met:
-
Version support
- MySQL version:
5.6and above - MariaDB version:
10.1and above - Telegraf Agent: Installed and running on the designated collection node.
- MySQL version:
-
Network connectivity
- Ensure the collection node server where Telegraf is installed can access the target MySQL database's service port. If there is a firewall, please allow traffic in advance.
-
Create a dedicated monitoring account (Security best practice) To follow the principle of least privilege and avoid using the
rootaccount for monitoring, please create a dedicated low-privilege monitoring account in your MySQL database in advance.Steps are as follows:
a. Log in to MySQL as an administrator Use
rootor another high-privilege account to log in to the MySQL instance you want to monitor.mysql -h <your_MySQL_host_IP> -u root -pb. Create a monitoring user Execute the following SQL command to create a user named
monitor.CREATE USER 'monitor'@'%' IDENTIFIED BY 'your_secure_password';Note:
- Replace
'your_secure_password'with a strong password. '%'means connections from any IP are allowed. For enhanced security, you can replace it with the fixed IP address of the Telegraf collection node, e.g.,'monitor'@'10.10.27.31'.
c. Grant minimum monitoring privileges Execute the following SQL commands to grant the
monitoruser the minimum privileges required for collecting performance metrics.-- Grant privileges to view processes and replication status
GRANT PROCESS, REPLICATION CLIENT ON *.* TO 'monitor'@'%';
-- Grant read access to the performance metrics database
GRANT SELECT ON performance_schema.* TO 'monitor'@'%';
-- Grant read access to the metadata information database
GRANT SELECT ON information_schema.* TO 'monitor'@'%';
-- Flush privileges to take effect immediately
FLUSH PRIVILEGES;Explanation: This authorization scheme strictly limits the capabilities of the
monitoruser, allowing it to only read performance-related system data and preventing access to business data tables, thereby ensuring your database's business security. - Replace
Step 1: Select an Integration Plugin
- After entering Monitor, click "Integration" in the top navigation bar.
- Select resource type:
- Expand the "Database" category in the left menu.
- Click "MySQL".
- Click "+ Integrate" at the top right of the list.
Screenshot Guide:
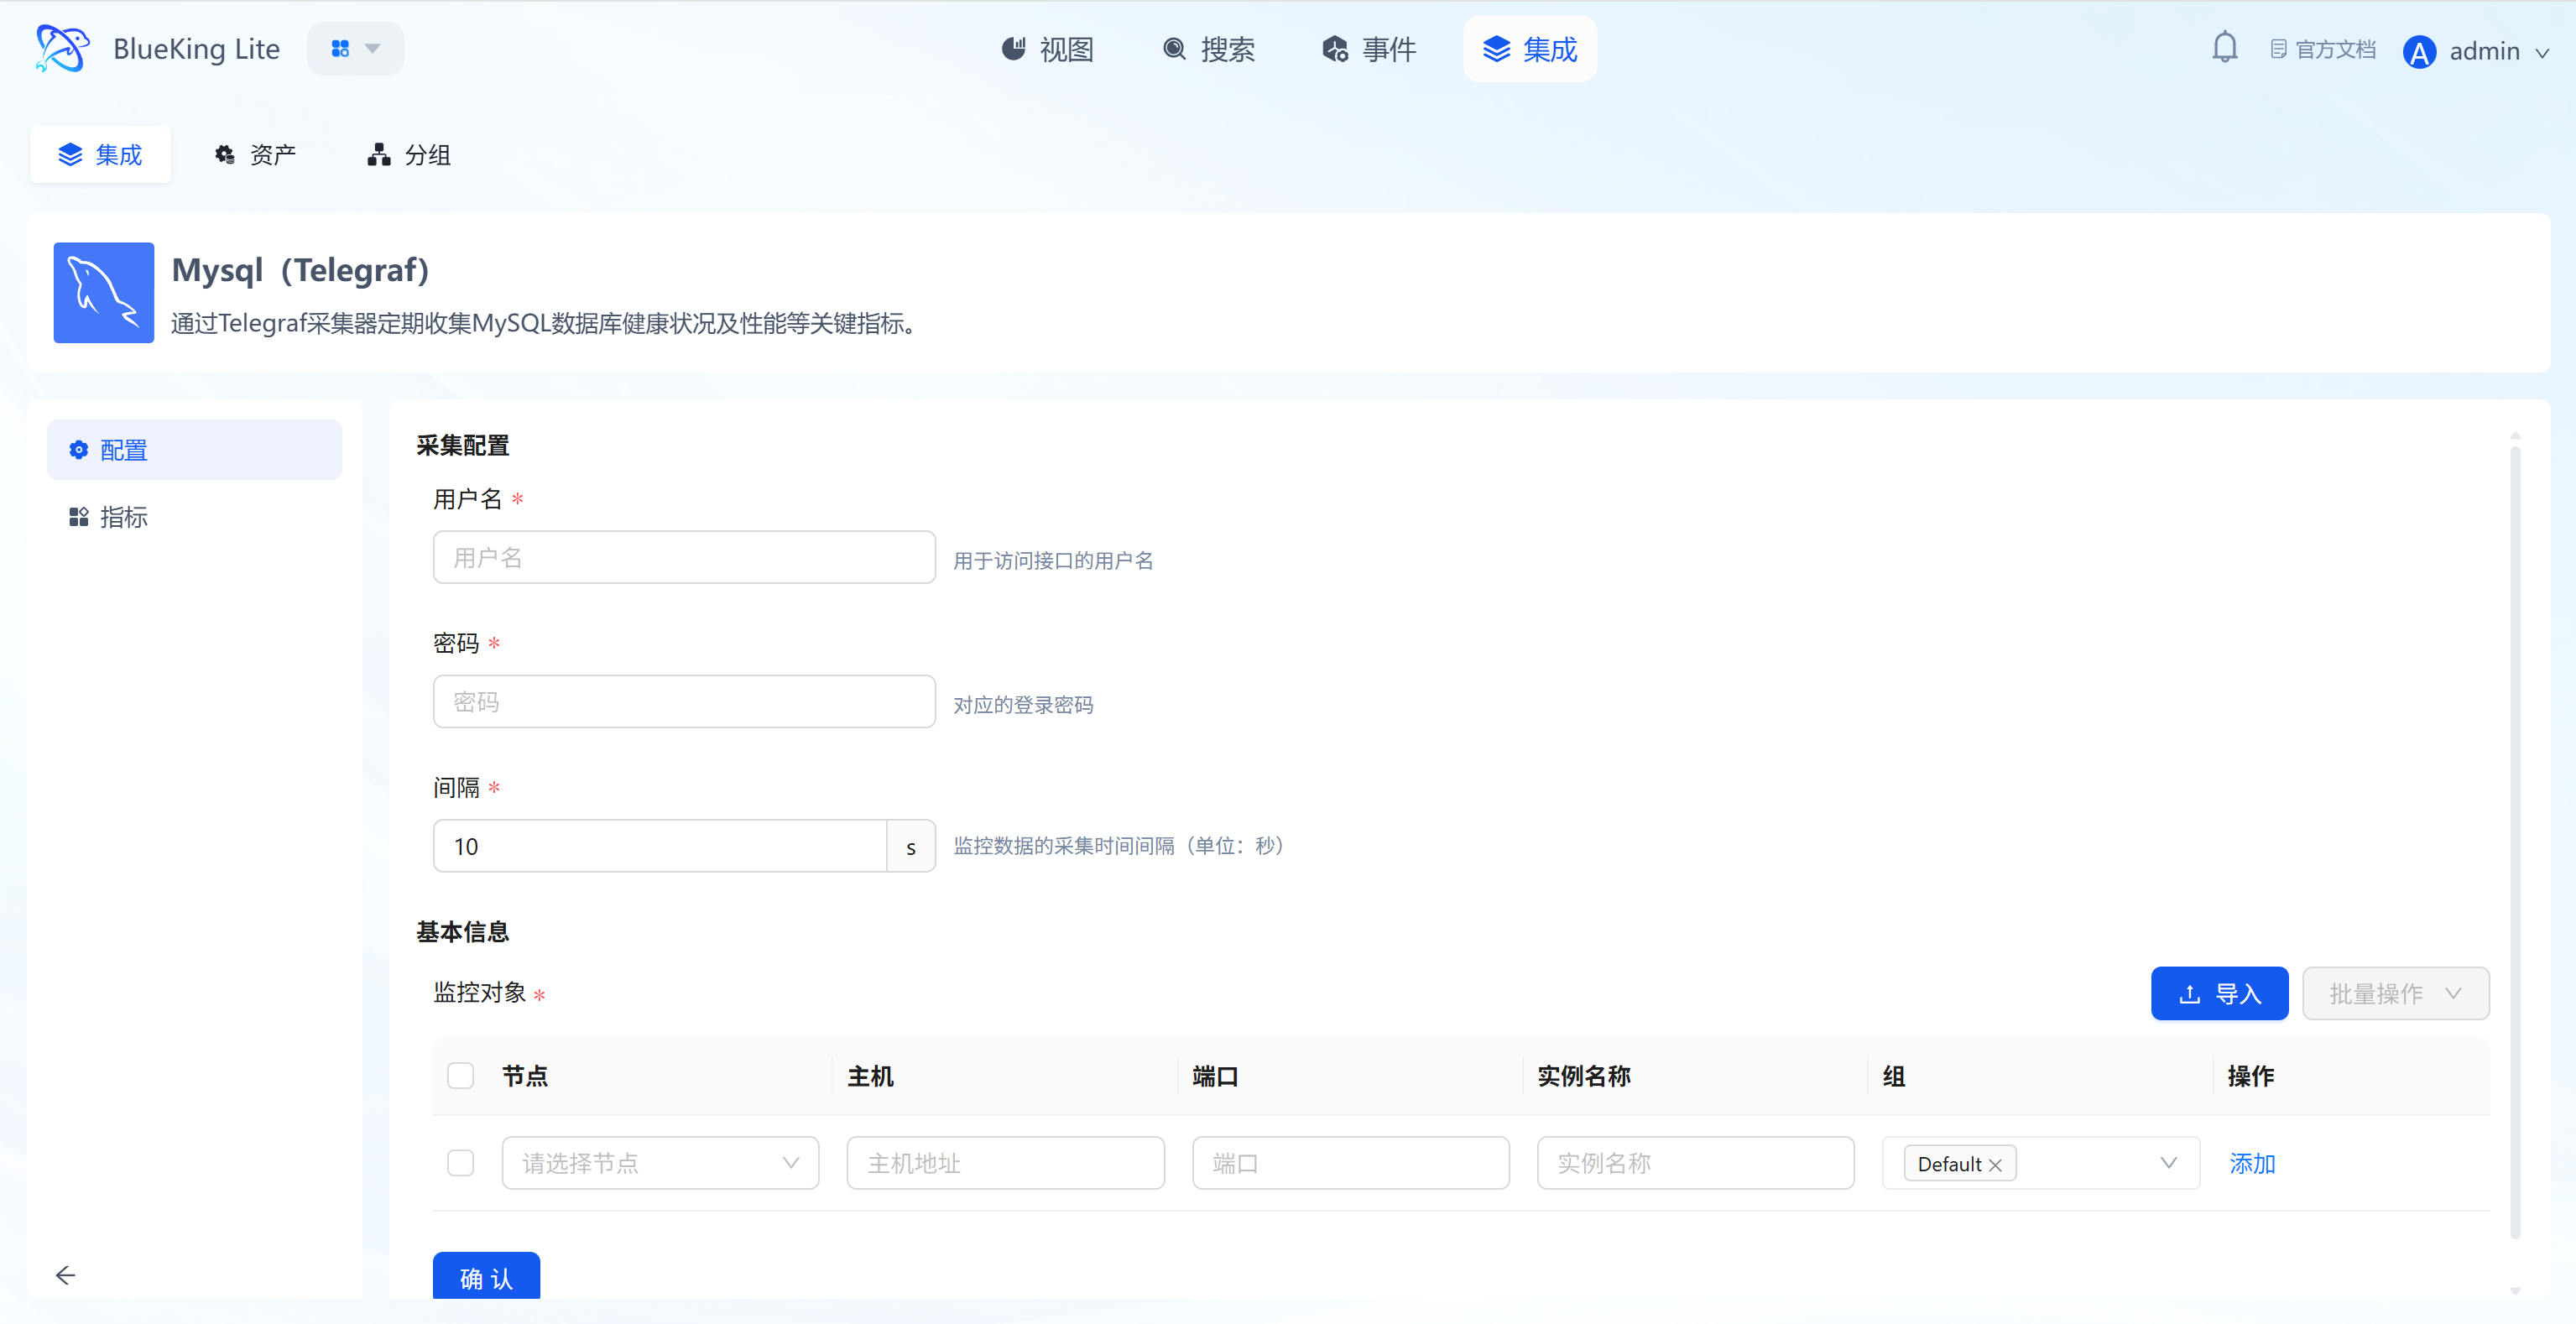
- Plugin description: Supports collecting health status and key performance metrics for MySQL databases.
Step 2: Configure Collection Policy
In this step, you need to configure the database connection account and target address.
- Collection configuration (authentication information):
- Username: Enter a MySQL account with monitoring privileges.
- Password: Enter the corresponding password.
- Interval: Default is
10s.
- Configure monitoring targets:
- Node: Select a managed host as the collector (can be the MySQL server itself or another machine on the same network segment).
- Host: Enter the MySQL server's IP address (e.g.,
127.0.0.1or a remote IP). - Port: Default is
3306. - Instance name: It is recommended to name it "MySQL-BusinessName" for easy identification.
- Click "Confirm".
Screenshot Guide:
- Collection principle: The system will control the selected "node" to connect to the target "host" and "port" using the provided account credentials.
Step 3: Verify and Analyze
- Click the "View" module at the top of the page.
- In the left resource category tree, expand "Database" -> "MySQL", and click to open the target instance resource data view.
- Data verification:
- Queries (QPS): Queries per second, reflecting database load.
- Connections: Current connection count; be cautious if approaching the maximum connection limit.
- Slow Queries: Slow query count, useful for identifying performance bottlenecks.
Integrating Postgres
Connect to a PostgreSQL database via the Telegraf plugin to collect key performance metrics such as transaction throughput, connections, cache hit rate, and deadlocks.
Prerequisites
Before starting the integration, ensure the following conditions are met:
-
Version support
- PostgreSQL version: Recommended
9.6and above (to use thepg_monitorrole) - Telegraf Agent: Installed and running on the designated collection node.
- PostgreSQL version: Recommended
-
Network connectivity
- Ensure the collection node server where Telegraf is installed can access the target PostgreSQL database's service port (default
5432). If there is a firewall, please allow traffic in advance.
- Ensure the collection node server where Telegraf is installed can access the target PostgreSQL database's service port (default
-
Create a dedicated monitoring account (Security best practice) To follow the principle of least privilege and avoid using
postgresor other superuser accounts for monitoring, please create a dedicated low-privilege monitoring role in your PostgreSQL instance in advance.Steps are as follows:
a. Log in to PostgreSQL as an administrator Use
postgresor another high-privilege account to log in to the PostgreSQL instance you want to monitor.# Example: psql -h <your_PG_host_IP> -p <port> -U <admin_user> -d <database>
psql -h 10.10.90.113 -p 5432 -U postgres -d postgresb. Create a monitoring user Execute the following SQL command to create a user named
telegraf_monitor.CREATE ROLE telegraf_monitor WITH LOGIN PASSWORD 'your_secure_password';Note:
- Replace
'your_secure_password'with a strong password. - Unlike MySQL, PostgreSQL's user access control is primarily managed by the server configuration file
pg_hba.conf, rather than specifying IPs when creating users.
c. Grant minimum monitoring privileges Execute the following SQL command to grant the
telegraf_monitoruser the minimum privileges required for collecting performance metrics.-- Grant the 'pg_monitor' predefined role — this is the best practice for secure monitoring
GRANT pg_monitor TO telegraf_monitor;Explanation:
pg_monitoris an official PostgreSQL predefined role that bundles all read-only permissions needed for monitoring, providing access to various statistics views (pg_stat_*). This authorization scheme strictly limits the capabilities of thetelegraf_monitoruser, allowing it to only read performance-related system data and preventing access to any business data tables, thereby ensuring your database's business security. - Replace
Note: Enable Remote Connections (Important)
Unlike many databases, PostgreSQL's default configuration is very strict and typically does not allow remote network connections. After creating the user, you will likely need to modify the server-side configuration files for the new account to successfully log in remotely.
Please log in to the PostgreSQL server machine and check/modify the following two files:
-
postgresql.conf- Purpose: Allow PostgreSQL to listen for network connections.
- Action: Find the
listen_addressesconfiguration item and ensure its value is not'localhost'. It should typically be modified to:listen_addresses = '*'
-
pg_hba.conf- Purpose: Add an "admission rule" to allow the monitoring user to connect remotely from a specified IP.
- Action: Add a new rule at the end of the file.
# Format: TYPE  DATABASE   USER                ADDRESS/MASK            METHOD
# Allow connections from any IP (lower security)
host    all        telegraf_monitor    0.0.0.0/0               scram-sha-256

# Or, only allow connections from the Telegraf node (more secure)
# host    all        telegraf_monitor    10.10.27.31/32          scram-sha-256
After modifying the above files, you must restart or reload the PostgreSQL service for the configuration to take effect.
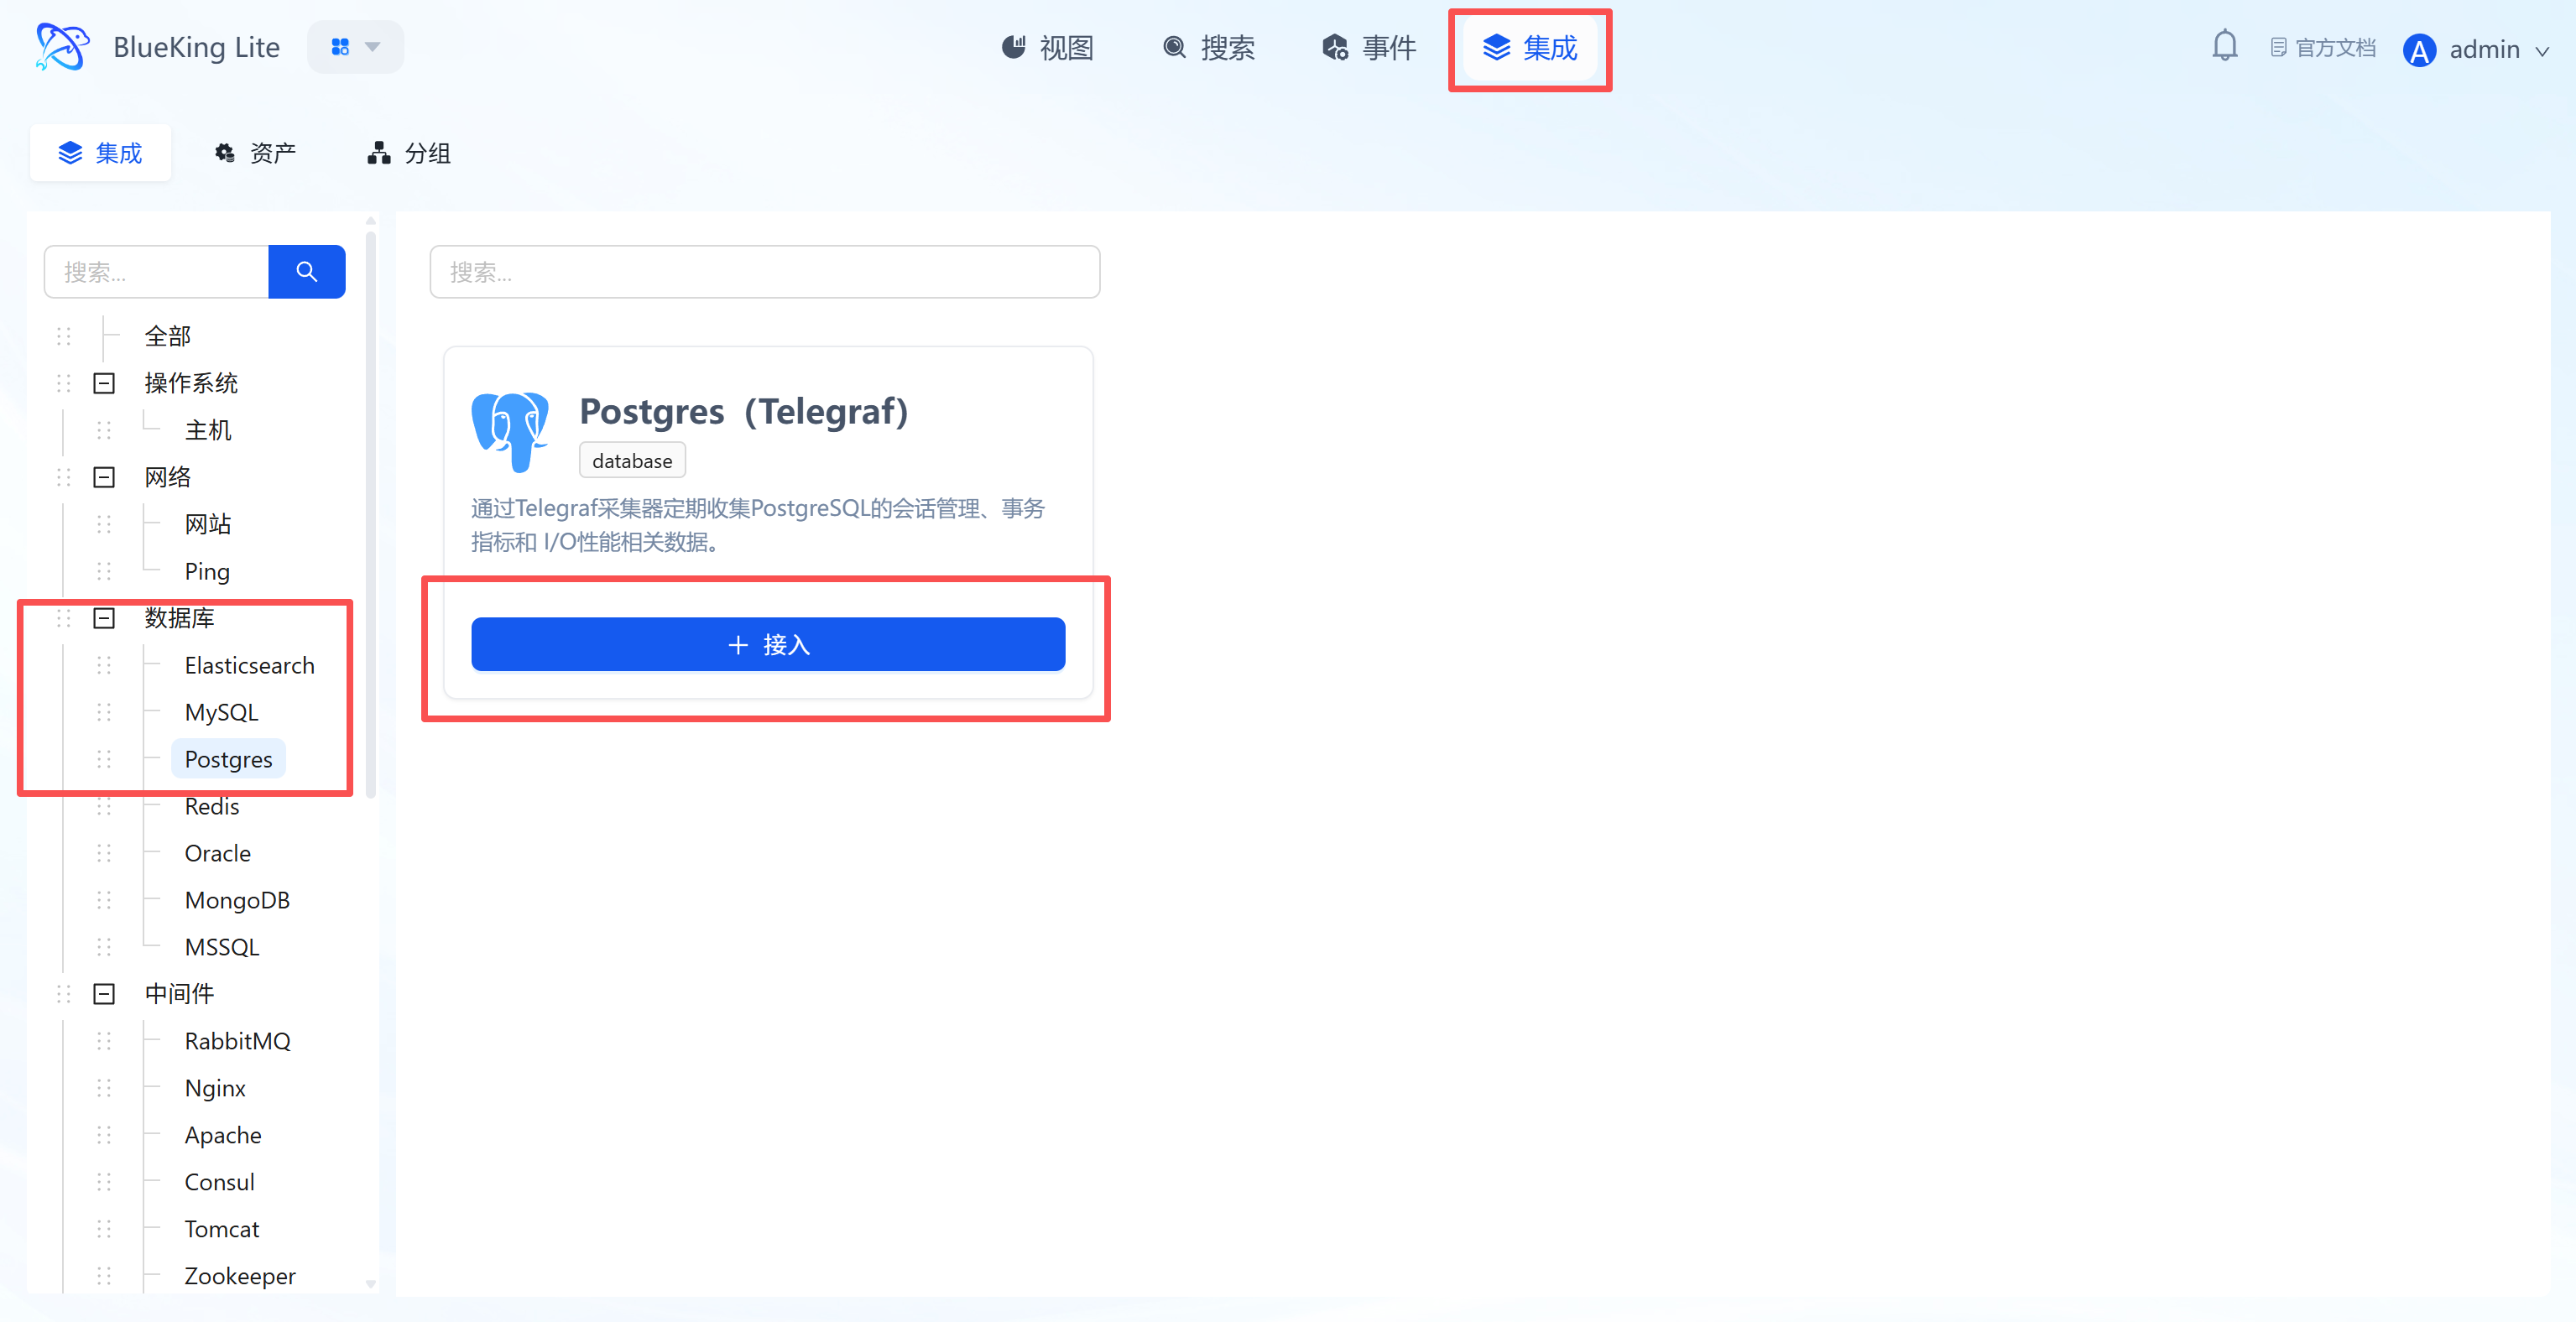
Step 1: Select an Integration Plugin
- After entering Monitor, click "Integration" in the top navigation bar.
- Select resource type:
- Expand the "Database" category in the left menu.
- Click "Postgres".
- Click "+ Integrate" at the top right of the list.
Screenshot Guide:
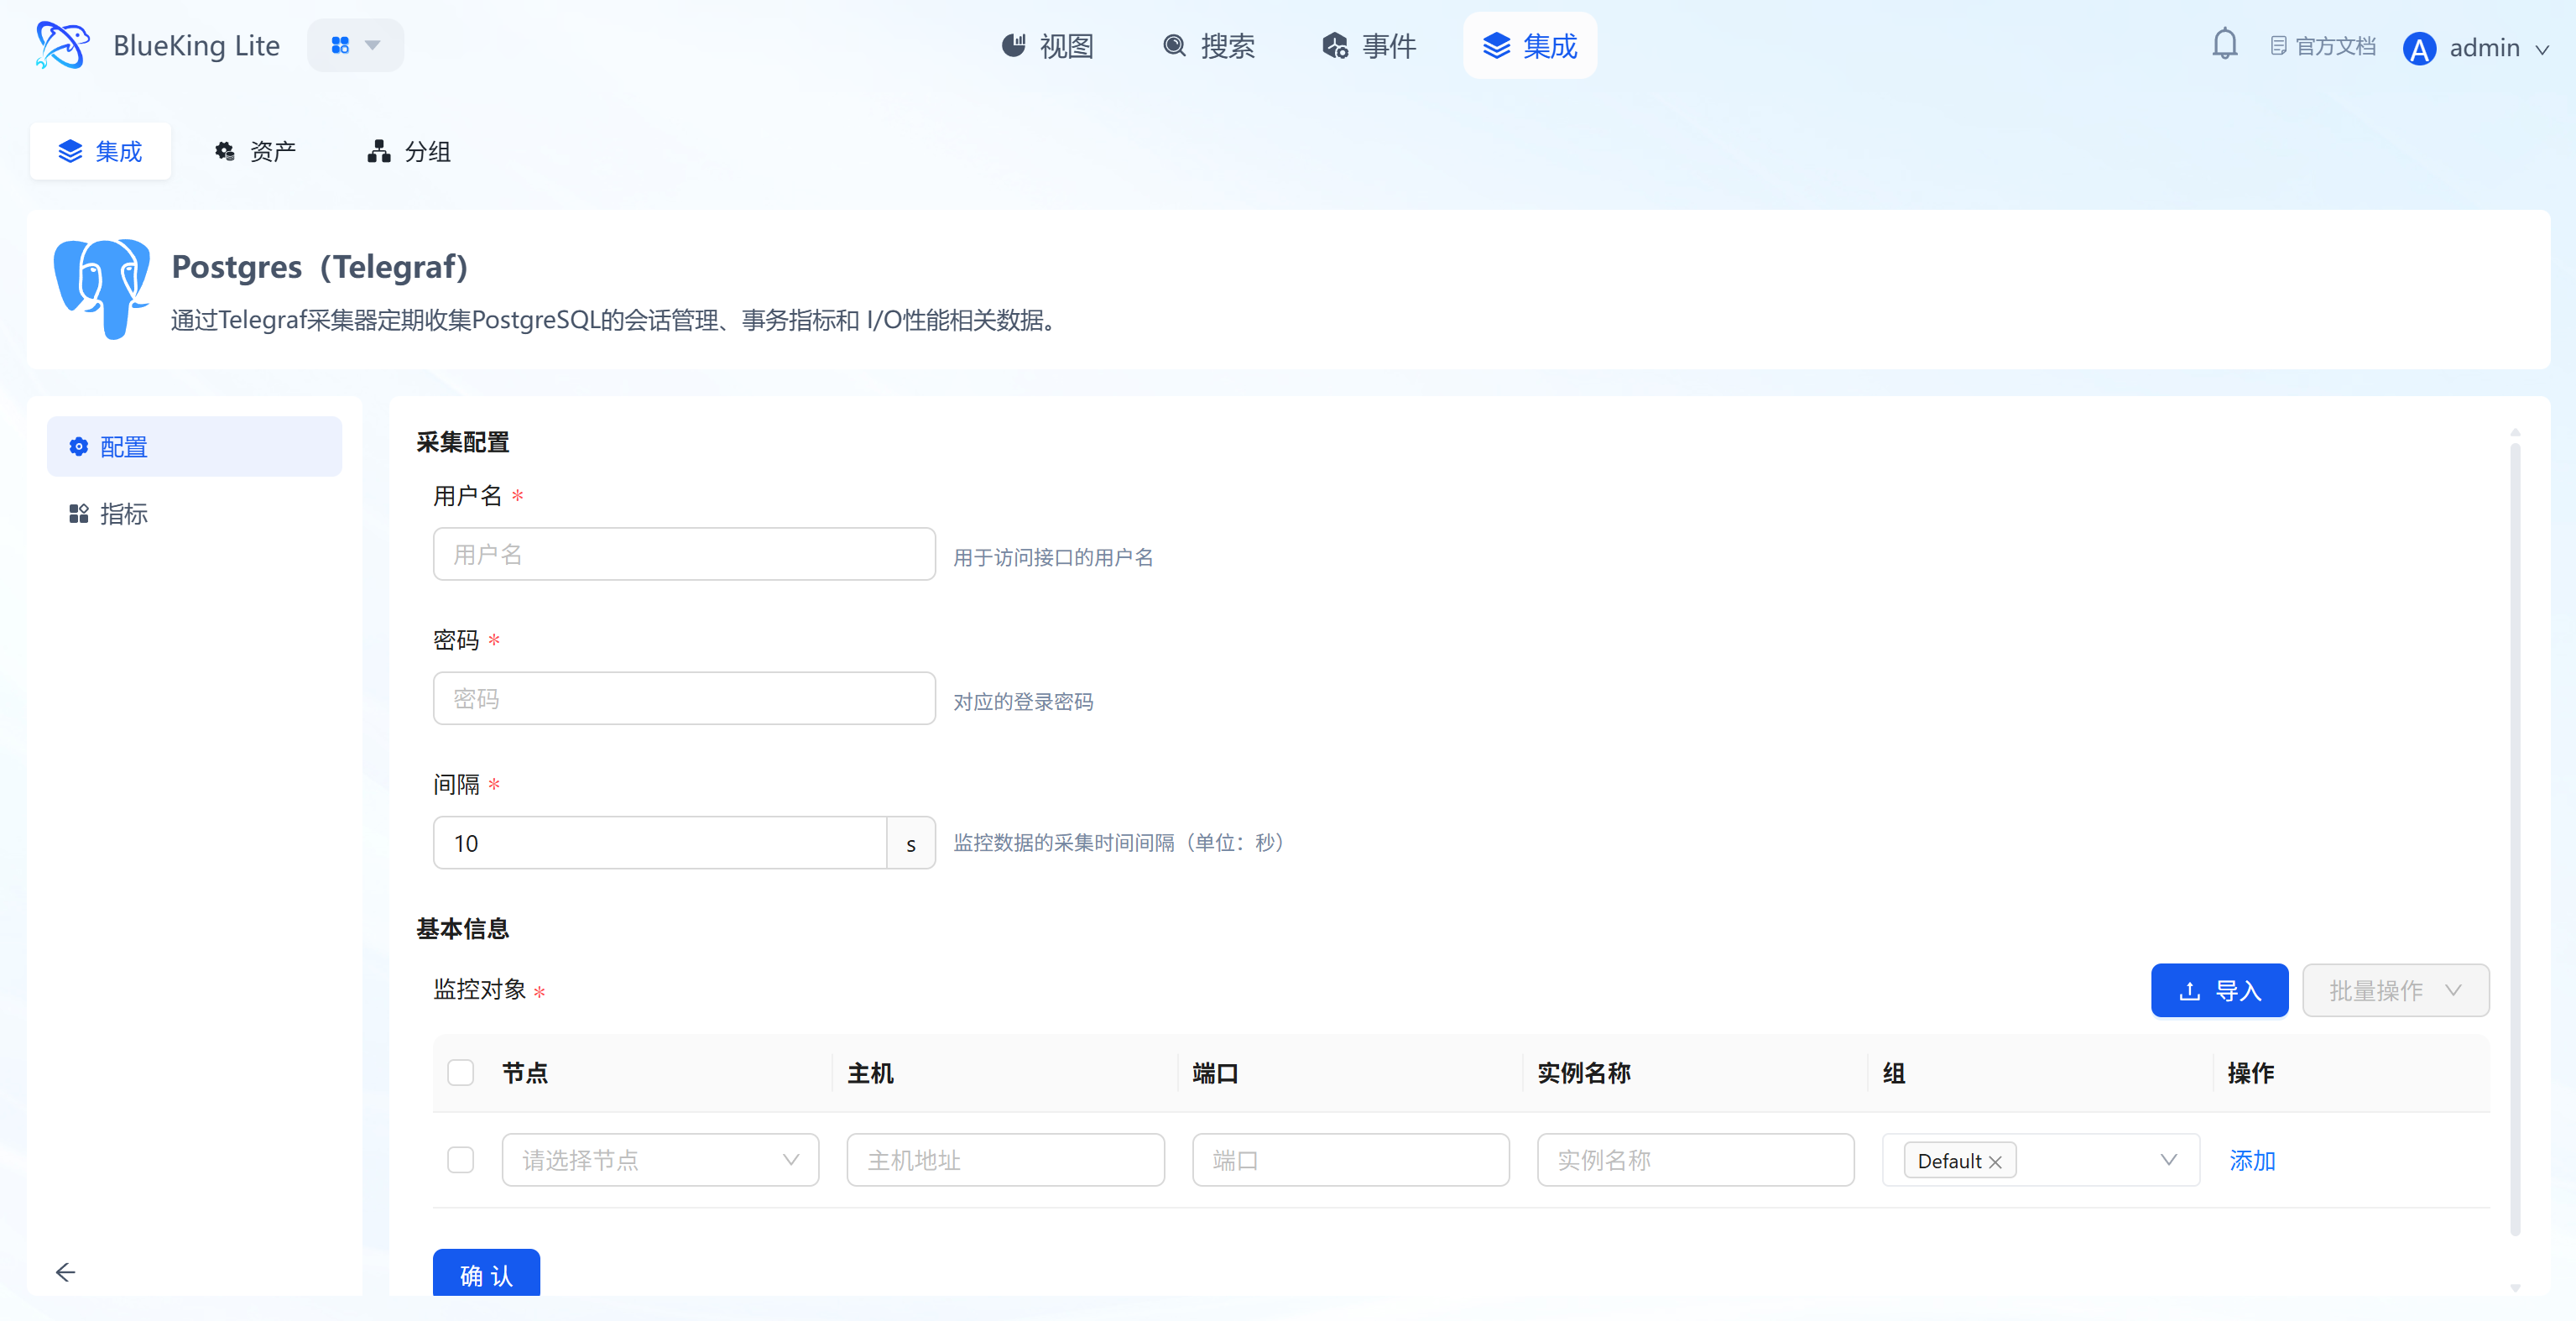
- Plugin description: Supports collecting PostgreSQL session management, transaction metrics, and I/O performance data.
Step 2: Configure Collection Policy
In this step, you need to configure the database connection account and target address.
- Collection configuration (authentication information):
- Username: Enter a Postgres account with monitoring privileges (recommended to have the
pg_monitorrole or read-only permissions). - Password: Enter the corresponding password.
- Interval: Default is
10s.
- Username: Enter a Postgres account with monitoring privileges (recommended to have the
- Configure monitoring targets:
- Node: Select a managed host as the collector (recommended to use the database server itself or a machine on the same network segment).
- Host: Enter the Postgres server's IP address.
- Port: Default is
5432. - Instance name: It is recommended to name it "PG-BusinessName" for easy identification later.
- Click "Confirm".
Screenshot Guide:
- Configuration logic: The system will use the provided account credentials to initiate a connection from the selected "node" to the target "host" and collect data.
Step 3: Verify and Analyze
- Click the "View" module at the top of the page.
- In the left resource category tree, expand "Database" -> "Postgres", and click the instance to expand details or view the panel on the right.
- Data verification:
- Transactions: View the number of committed and rolled-back transactions per second to assess business load.
- Connections: Monitor active connection count to prevent connection pool exhaustion.
- Cache Hit Rate: Check the buffer cache hit rate; ideally it should be close to 99%.
- DB Size: Monitor database file size growth trends.
Integrating Redis
Connect to a Redis database via the Telegraf plugin to collect key performance metrics such as hit rate, memory usage, client connections, and command throughput.
Prerequisites
Before starting the integration, ensure you have completed the following preparations, which are the foundation for smooth monitoring and data security.
-
Version support
- Redis version:
2.8and above (your current version7meets the requirement). - Telegraf Agent: Installed and running on the designated collection node.
- Redis version:
-
Network connectivity
- According to your table, the target Redis host is
10.10.90.113, port6379. - Ensure the collection node server where Telegraf is installed can access this host's service port. If there is a firewall, please configure allow rules in advance.
- According to your table, the target Redis host is
-
Create a dedicated monitoring account (Security best practice for Redis 6.0+) To follow the principle of least privilege, for Redis 6.0 and above, it is strongly recommended to create a dedicated, low-privilege monitoring account.
Steps are as follows:
a. Log in to Redis as an administrator Use the
redis-clitool to connect to your target instance with the existing password.# -h host, -p port, -a password
redis-cli -h 10.10.90.113 -p 6379 -a weopsb. Execute the following command to create a low-privilege user After a successful connection (
10.10.90.113:6379>prompt), execute the following ACL command to create a dedicated monitoring account namedtelegraf_monitor.ACL SETUSER telegraf_monitor on >Telegraf_pw_3035! +info +client +cluster +slowlog +config +ping +echo -@allExplanation:
ACL SETUSER telegraf_monitor: Creates a new user.>Telegraf_pw_3035!: Sets an independent, strong password for this new user.+info ...: Grants a series of read-only, monitoring-specific command permissions to this user.-@all: Prohibits this user from executing all other commands (such asGET,SET,DEL, etc.), ensuring it cannot read or write any business data.
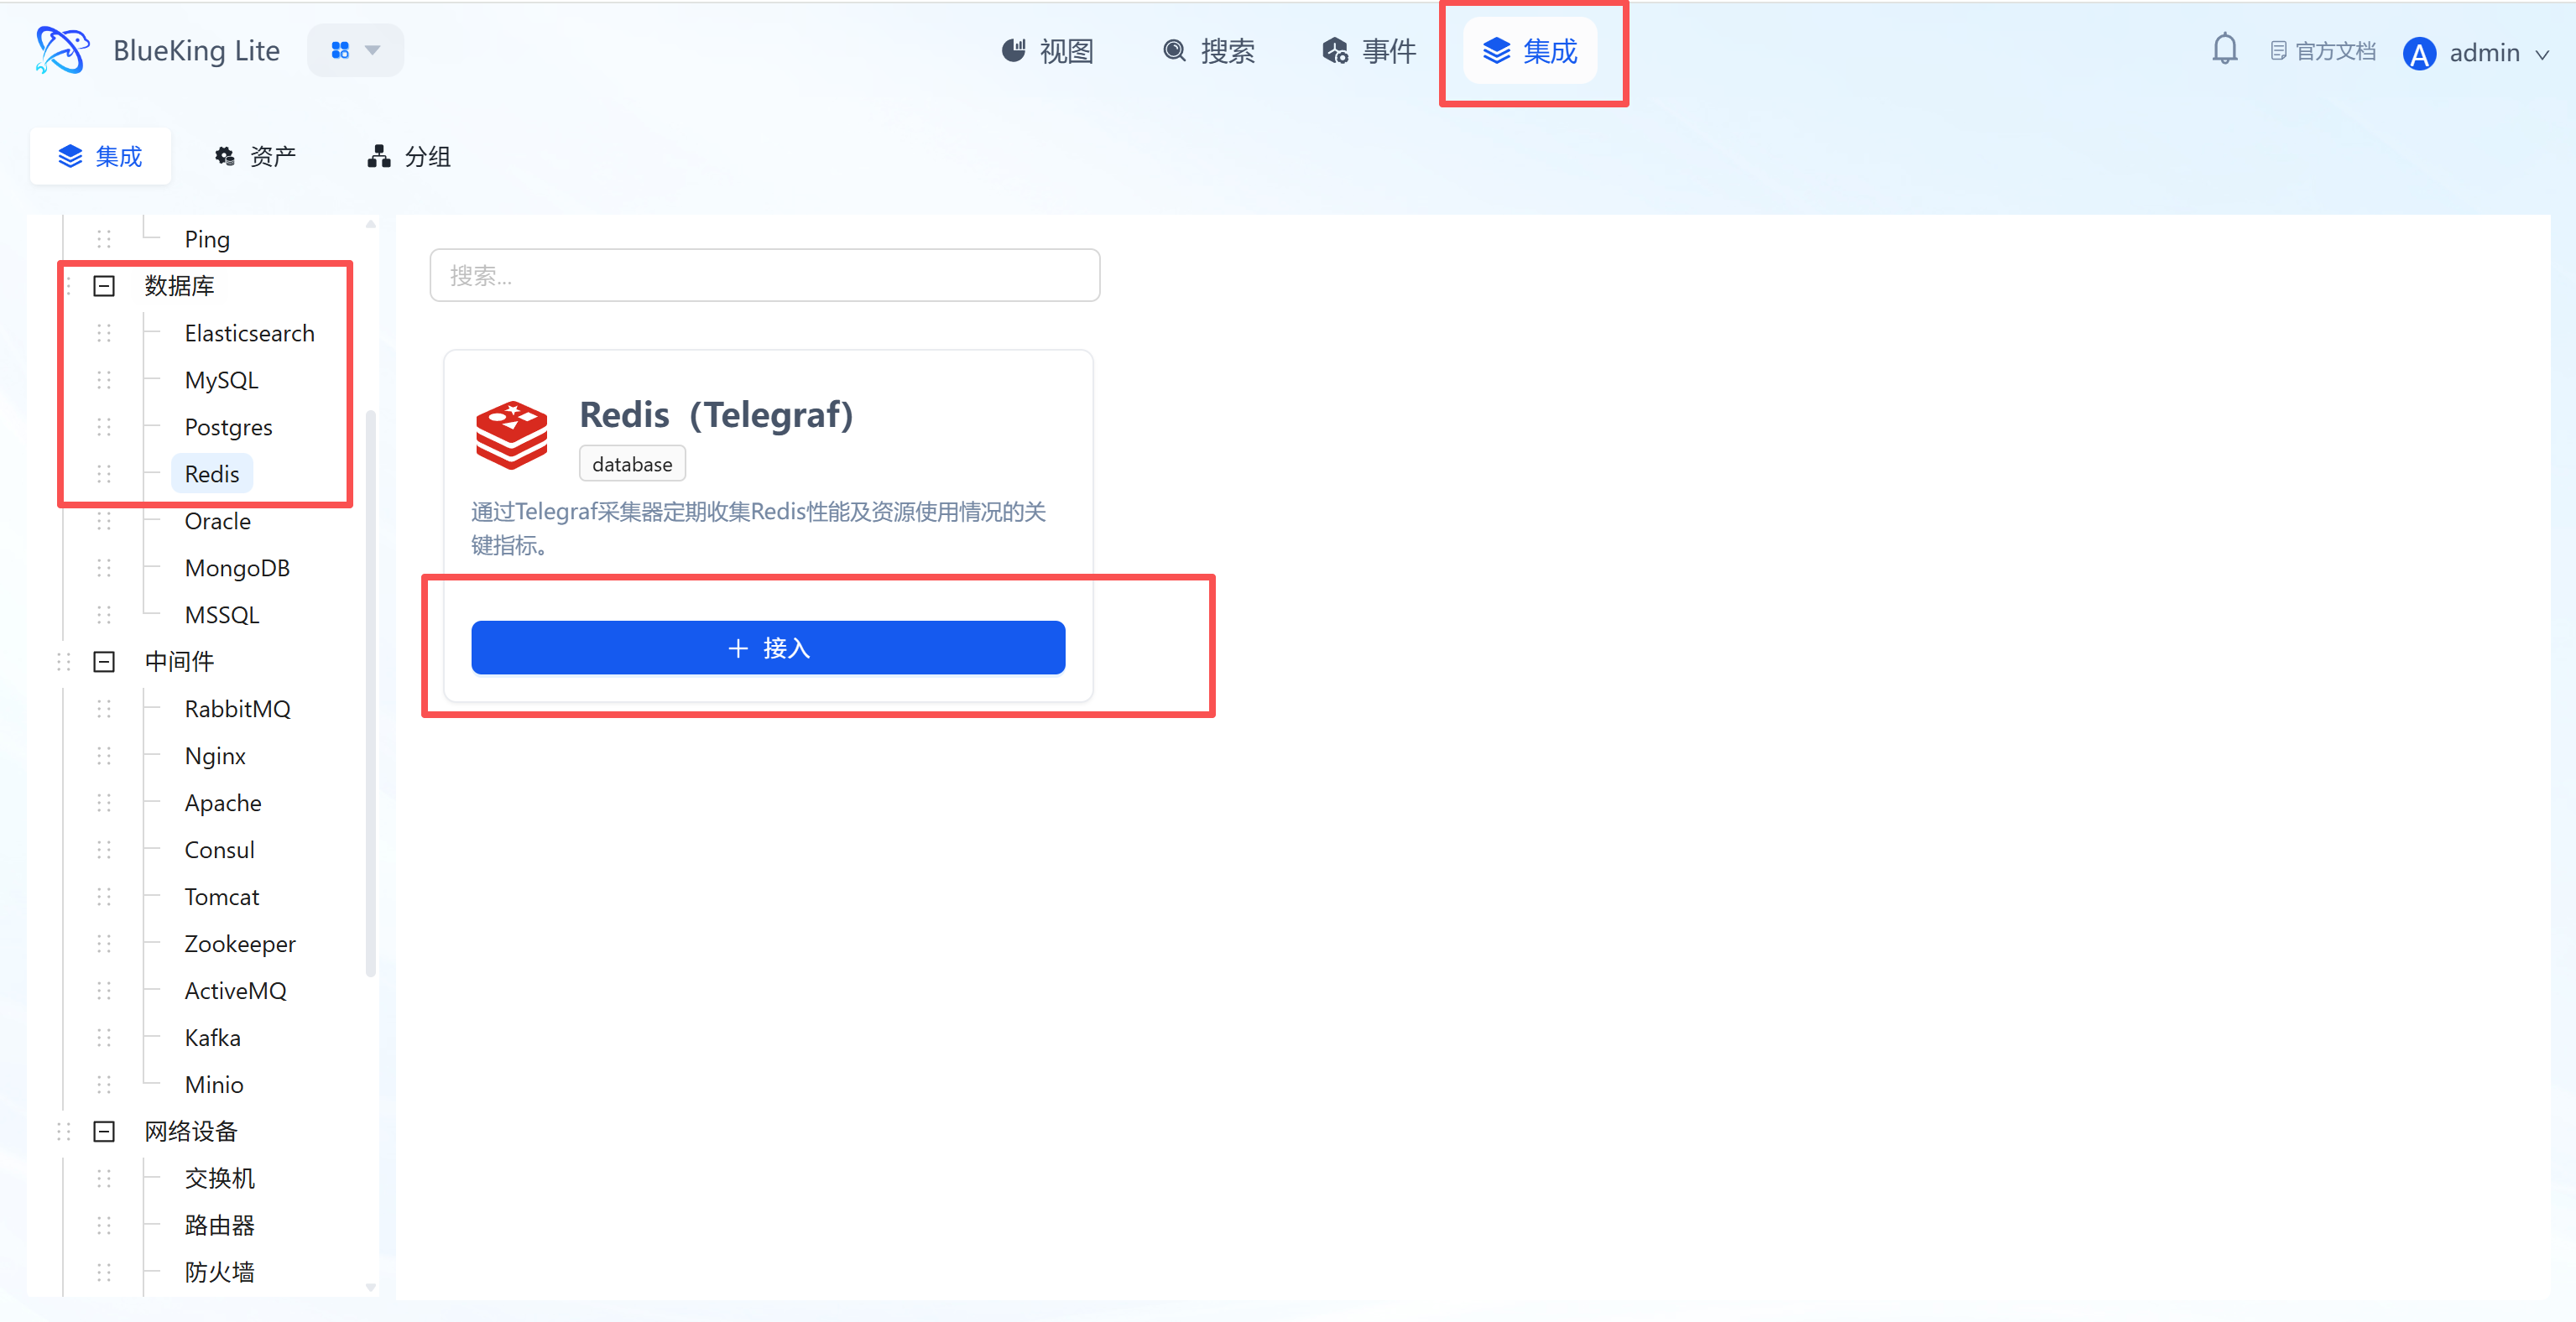
Step 1: Select an Integration Plugin
- After entering Monitor, click "Integration" in the top navigation bar.
- Select resource type:
- Expand the "Database" category in the left menu.
- Click "Redis".
- Click "+ Integrate" at the top right of the list.
Screenshot Guide:
- Plugin description: Supports collecting Redis performance and resource usage to help identify cache bottlenecks.
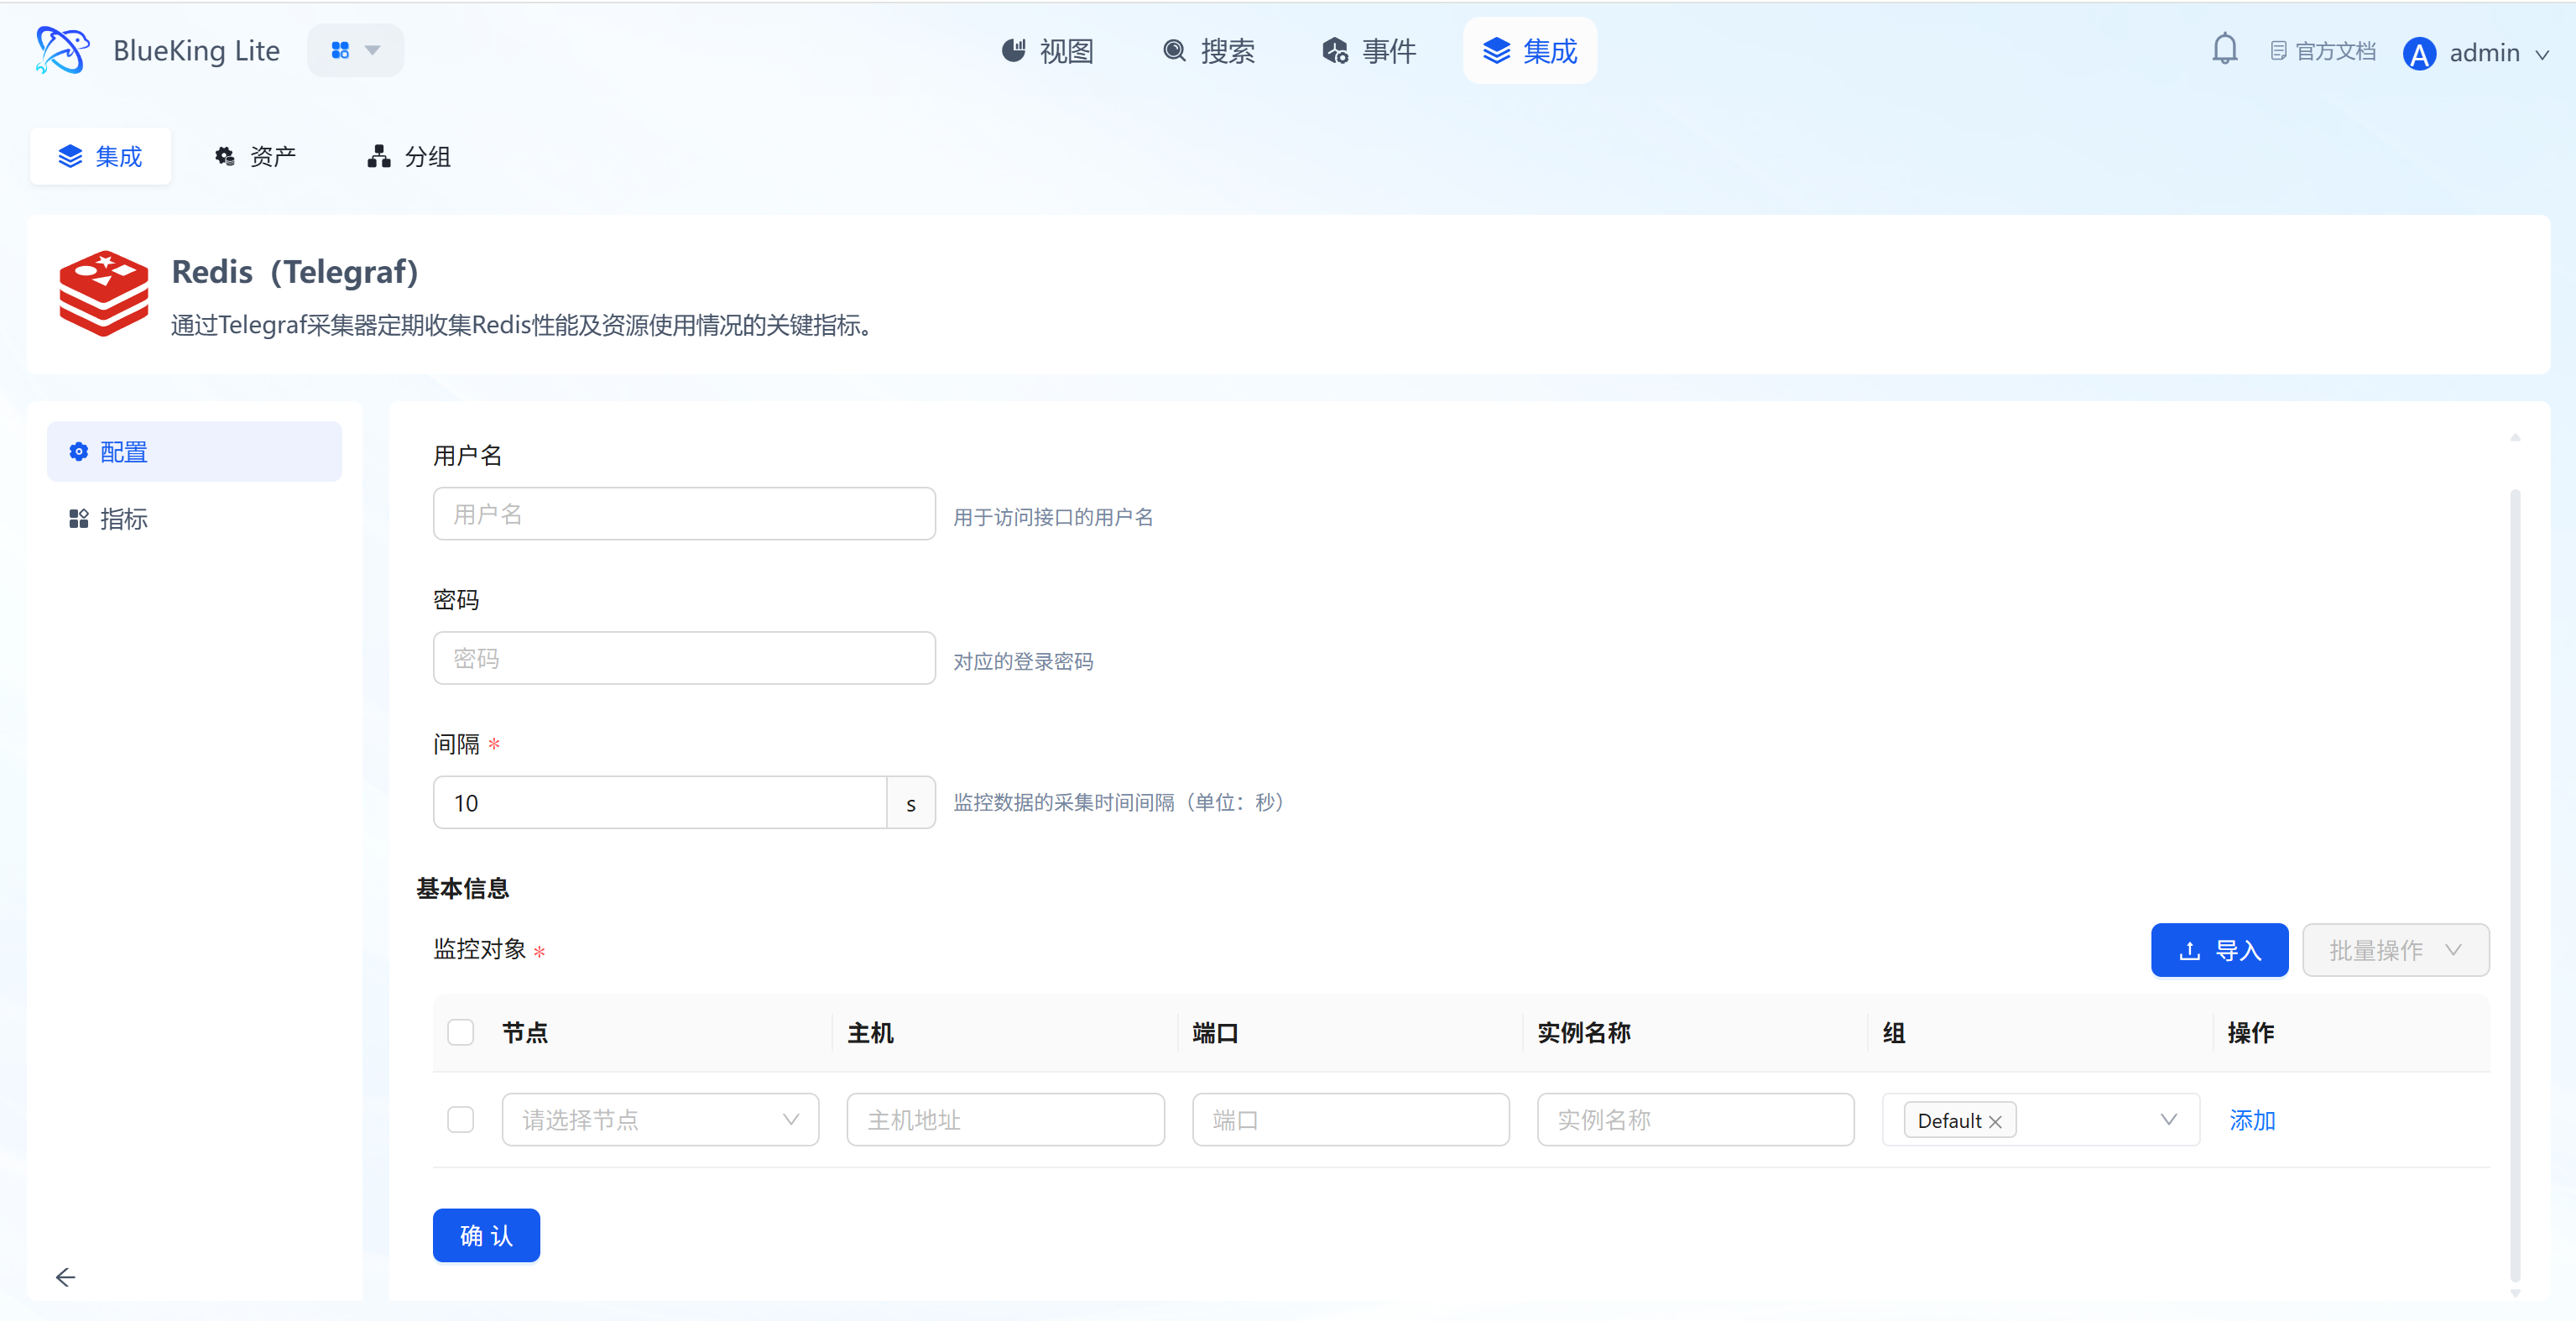
Step 2: Configure Collection Policy
In this step, you need to configure the database connection account and target address.
- Collection configuration (authentication information):
- Username: Leave blank for Redis versions before 6.0; fill in the username if using ACL authentication.
- Password: Enter the Redis connection password (
requirepass). - Interval: Default is
10s.
- Configure monitoring targets:
- Node: Select a managed host as the collector (recommended to use the Redis server itself or a machine on the same network segment).
- Host: Enter the Redis server's IP address.
- Port: Default is
6379. - Instance name: It is recommended to name it "Redis-BusinessName".
- Click "Confirm".
Screenshot Guide:
- Configuration logic: The system will use the provided password to initiate a connection from the selected "node" to the target "host" and collect statistics returned by the
INFOcommand.
Step 3: Verify and Analyze
- Click the "View" module at the top of the page.
- In the left resource category tree, expand "Database" -> "Redis", and click the instance to open the analysis view panel.
- Data verification:
- Hit Rate: Check the cache hit rate (Keyspace Hits / (Hits + Misses)); the ideal value should be above 80%.
- Used Memory: Monitor memory usage to prevent memory overflow causing data eviction.
- Clients: View the number of connected clients.
- Commands/s: View the number of commands processed per second (QPS).
Integrating Oracle
Since Oracle monitoring relies on a dedicated collection driver, you need to manually install the Exporter component on the target node before integration.
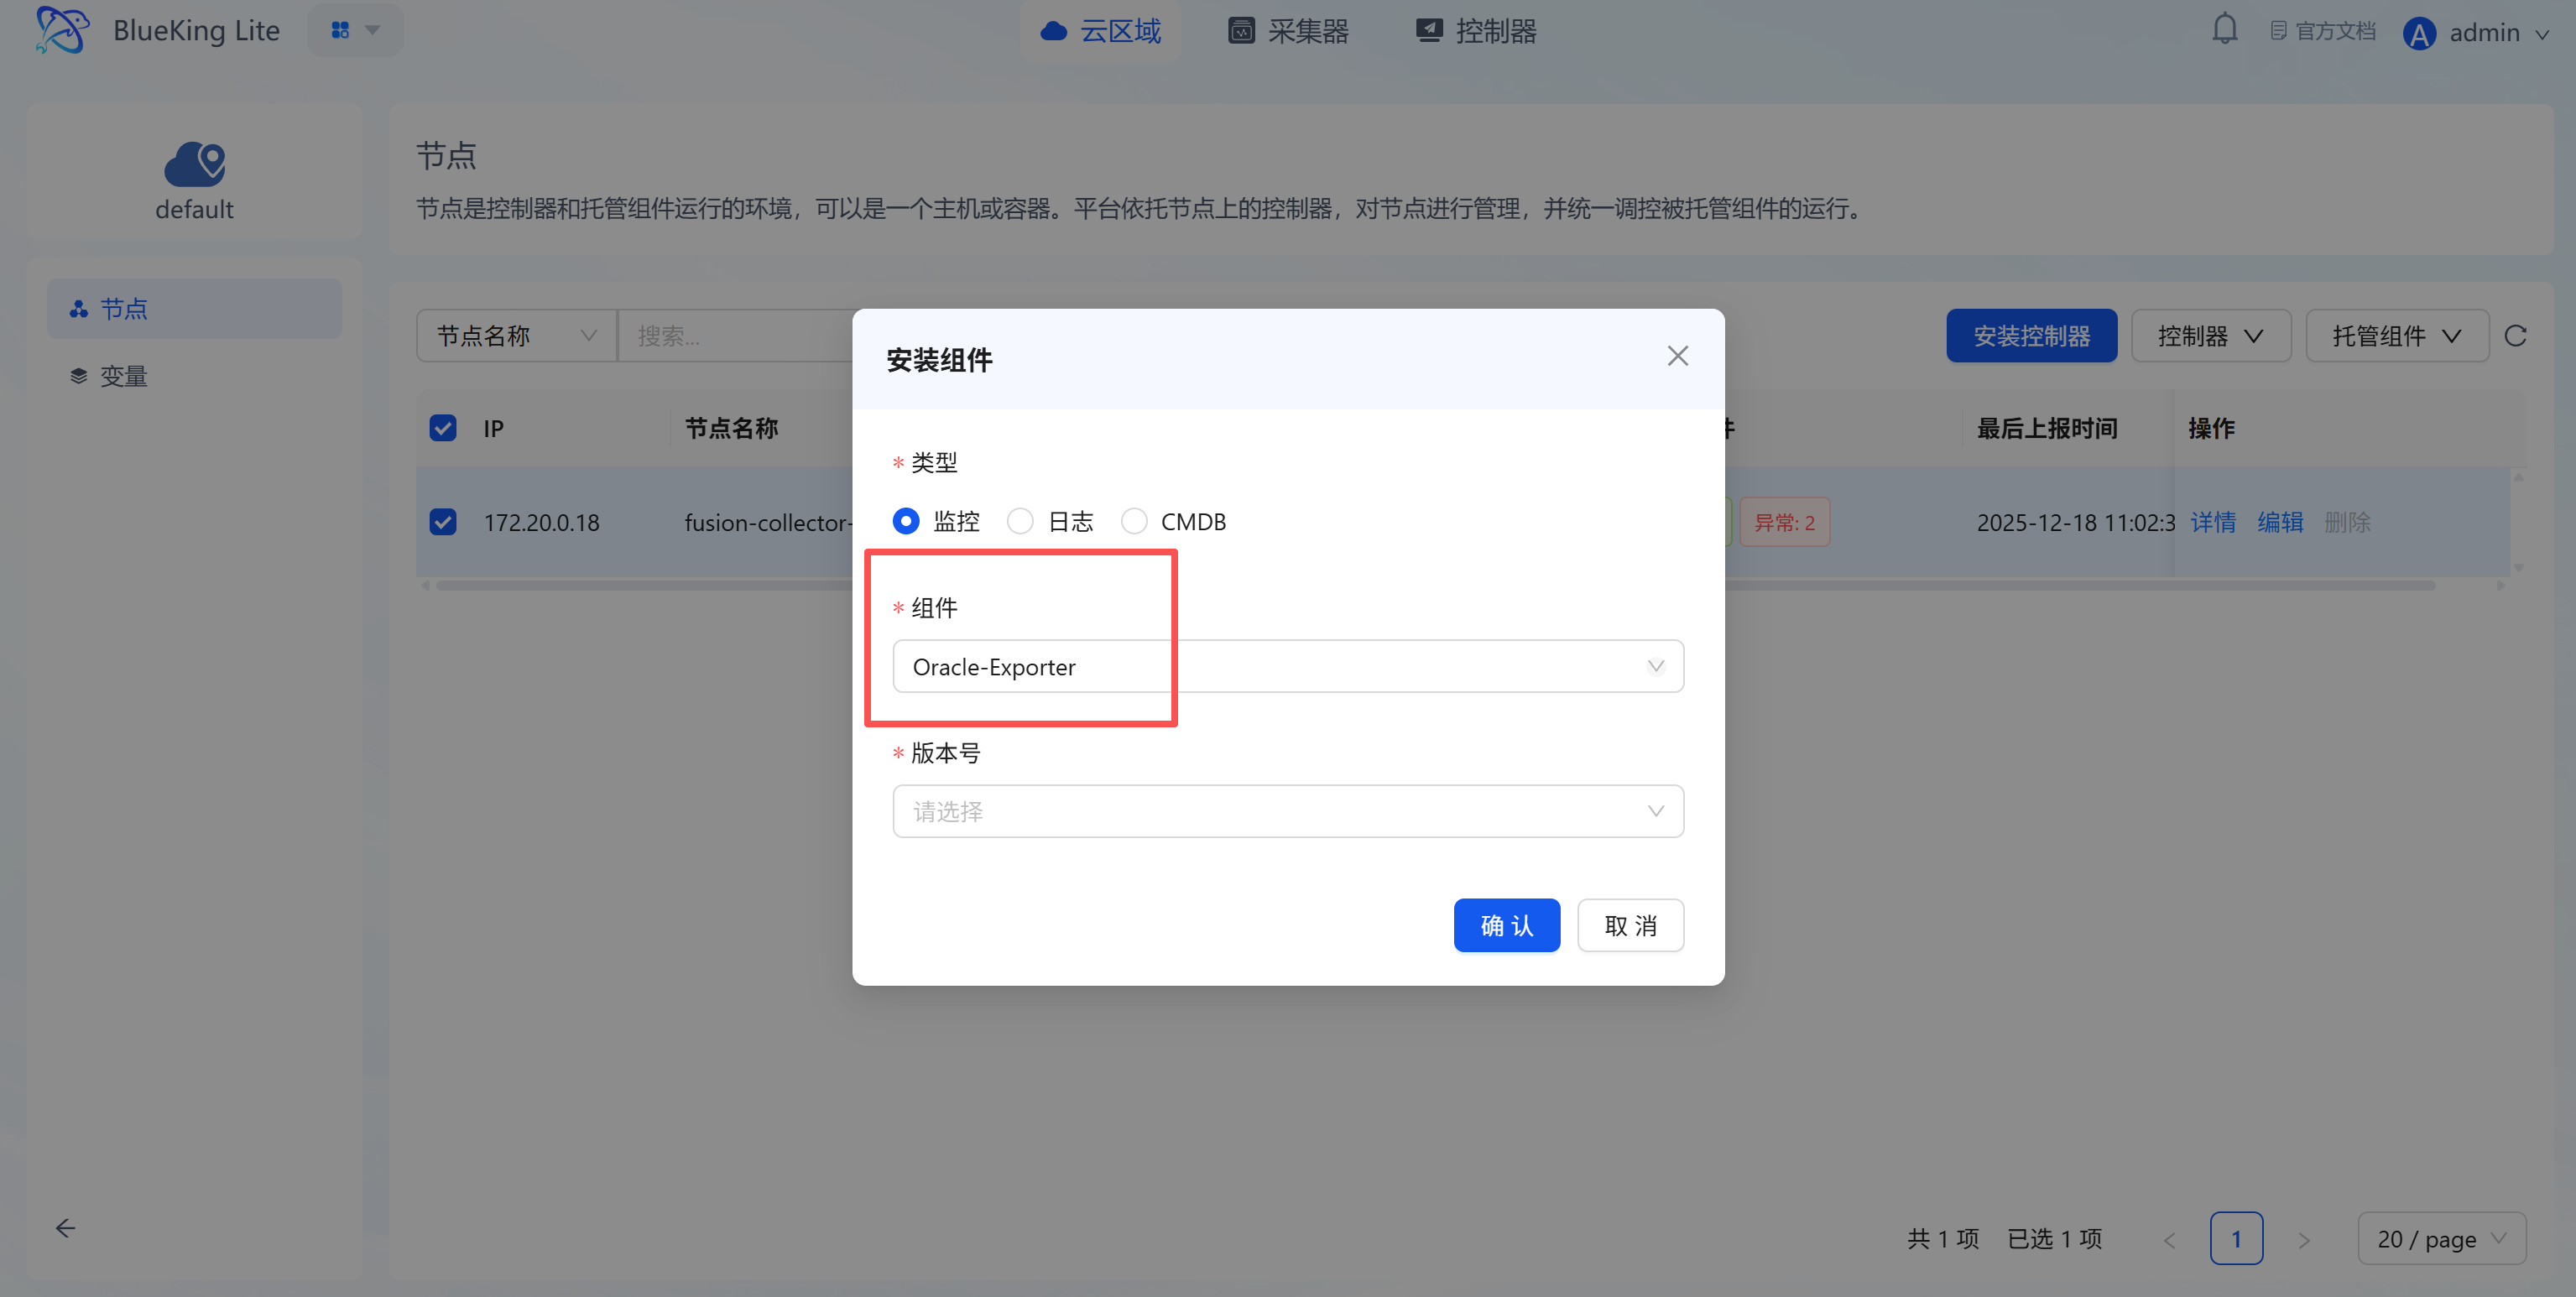
Preliminary Step: Install Collection Component
Before configuring monitoring, go to the "Node Management" module to deploy the Oracle collector.
- Enter the "Node" module and click "Node Management" on the left.
- Select target node:
- In the node list, check the server you plan to use for running monitoring tasks (collector node).
- Click the "Manage Components" button above the list.
- Then click the "Install Component" button.
- Install component:
- Type: Select
Monitoring. - Component: Select
Oracle-Exporterfrom the dropdown. - Version: Select the latest version.
- Type: Select
- Click "Confirm" and wait for the installation status to change to "Installation Successful".
Screenshot Guide:

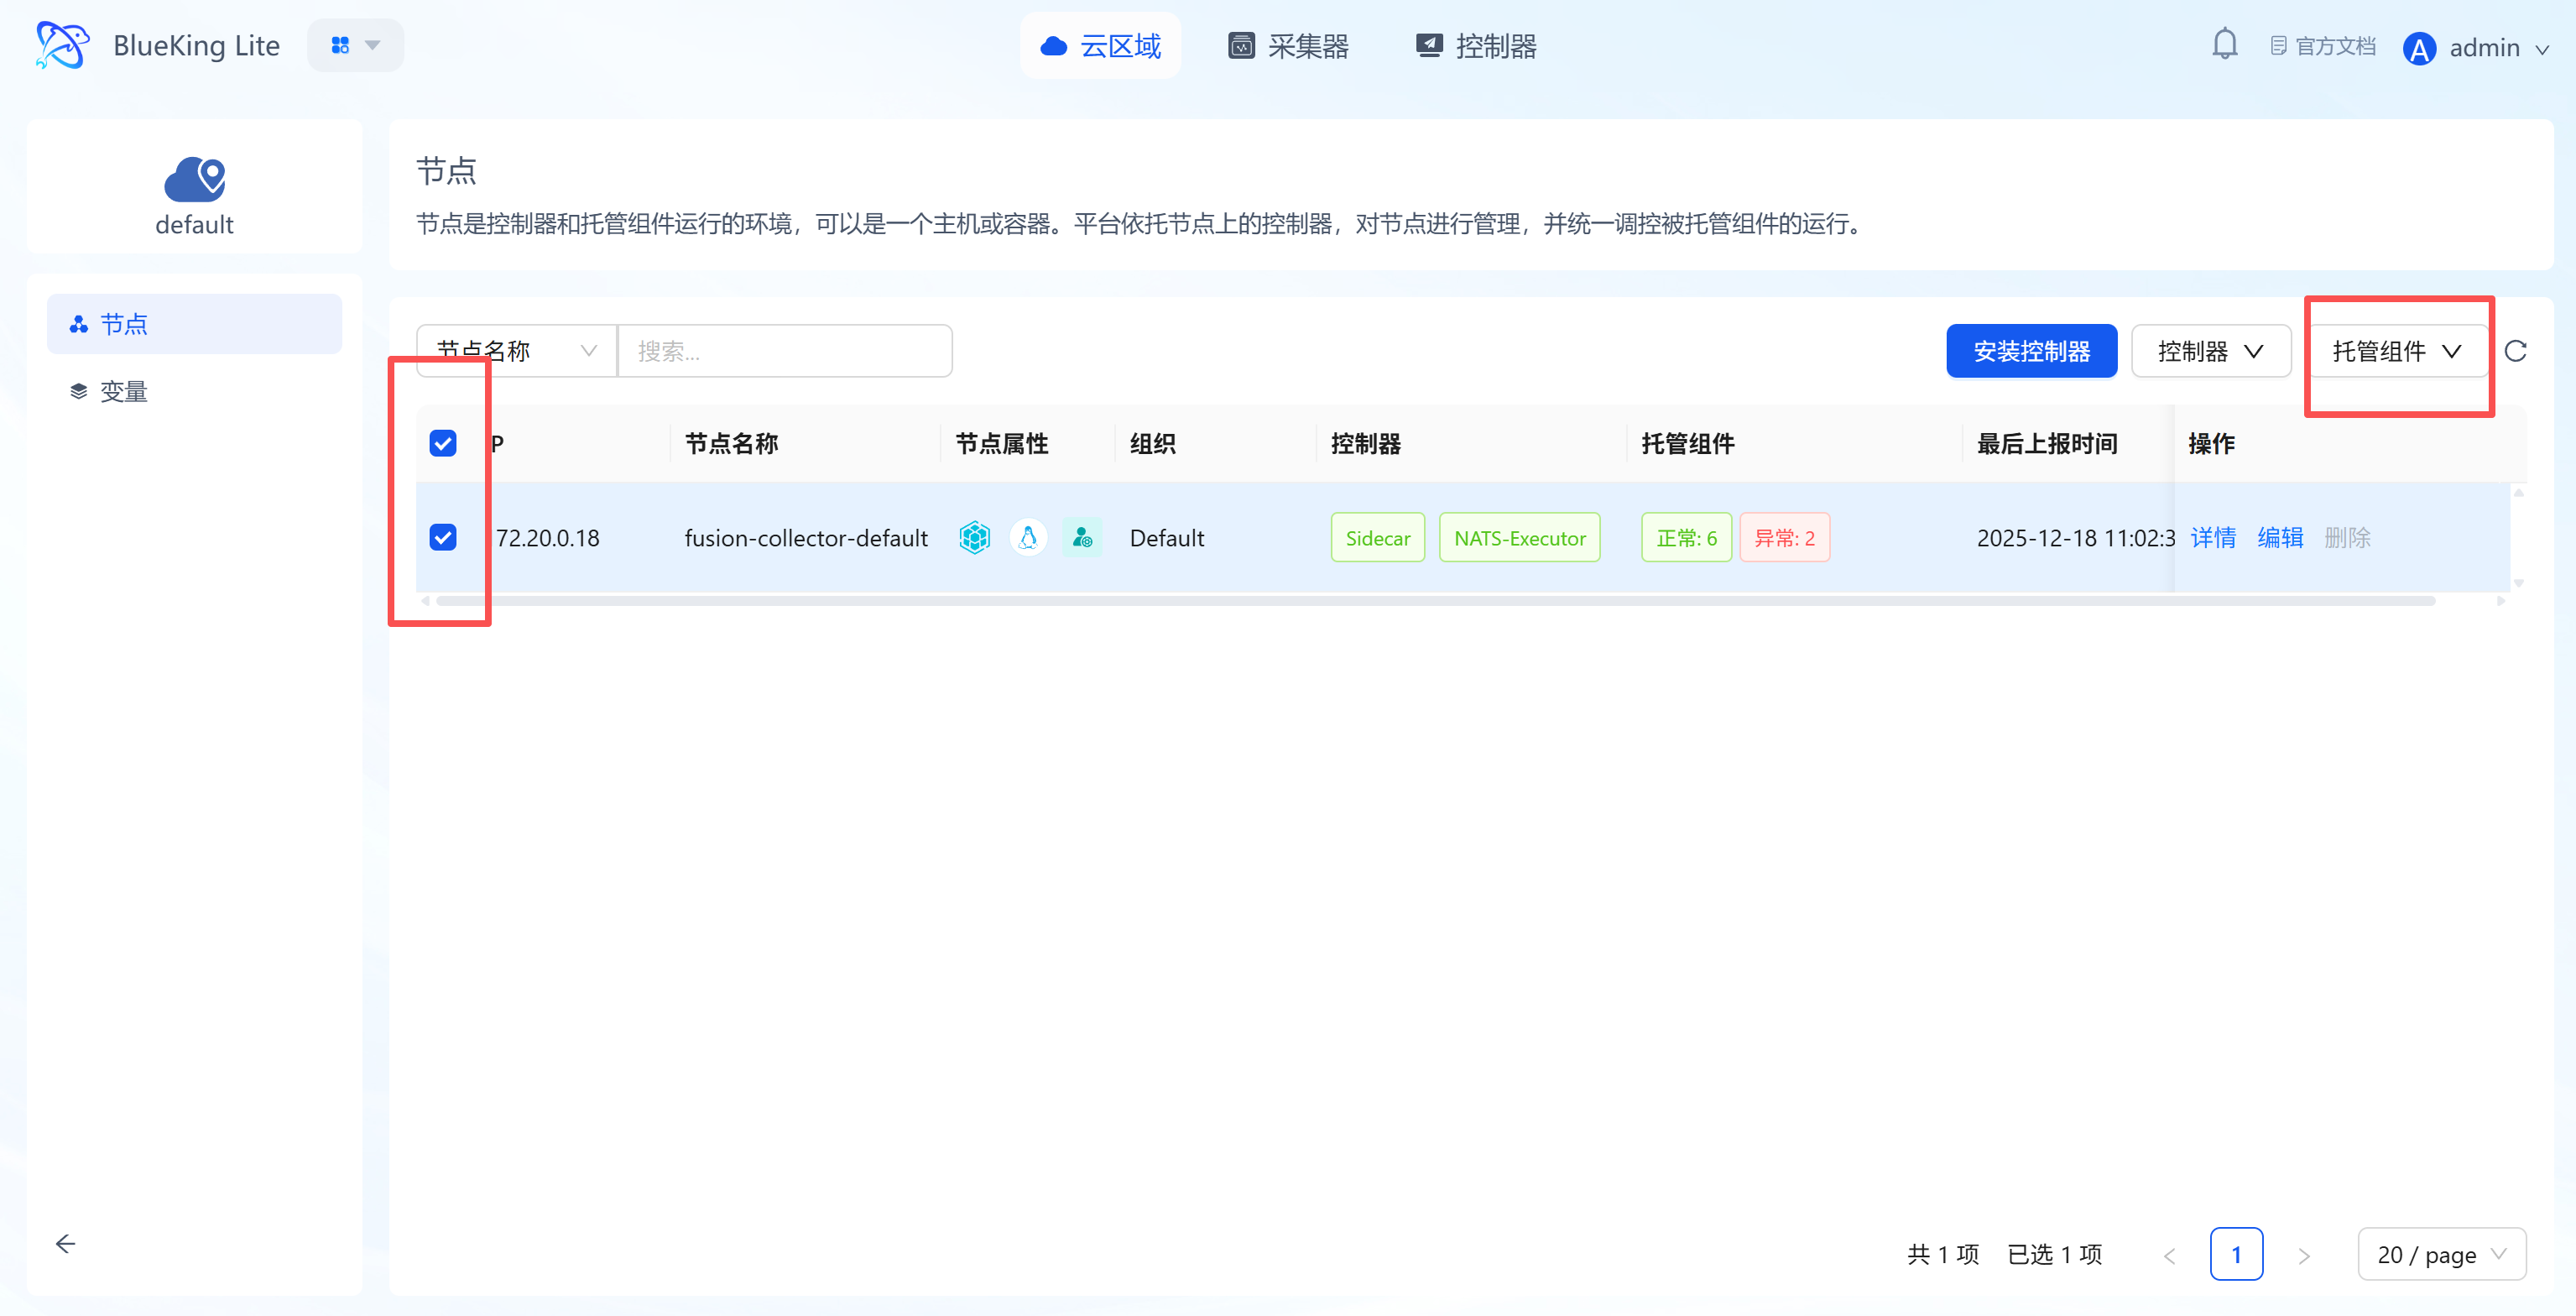
- Operation logic: Oracle monitoring requires a dedicated driver program. This step is equivalent to "installing a driver" for your collector.
Step 1: Select an Integration Plugin
After the component installation is complete, return to the monitoring module for configuration.
- After entering Monitor, click "Integration" in the top navigation bar.
- Expand "Database" in the left menu and click "Oracle".
- Click "+ Integrate" at the top right of the list.
Screenshot Guide:
- Plugin description: Collects metrics such as tablespace usage, session count, lock waits, and throughput via Oracle Exporter.

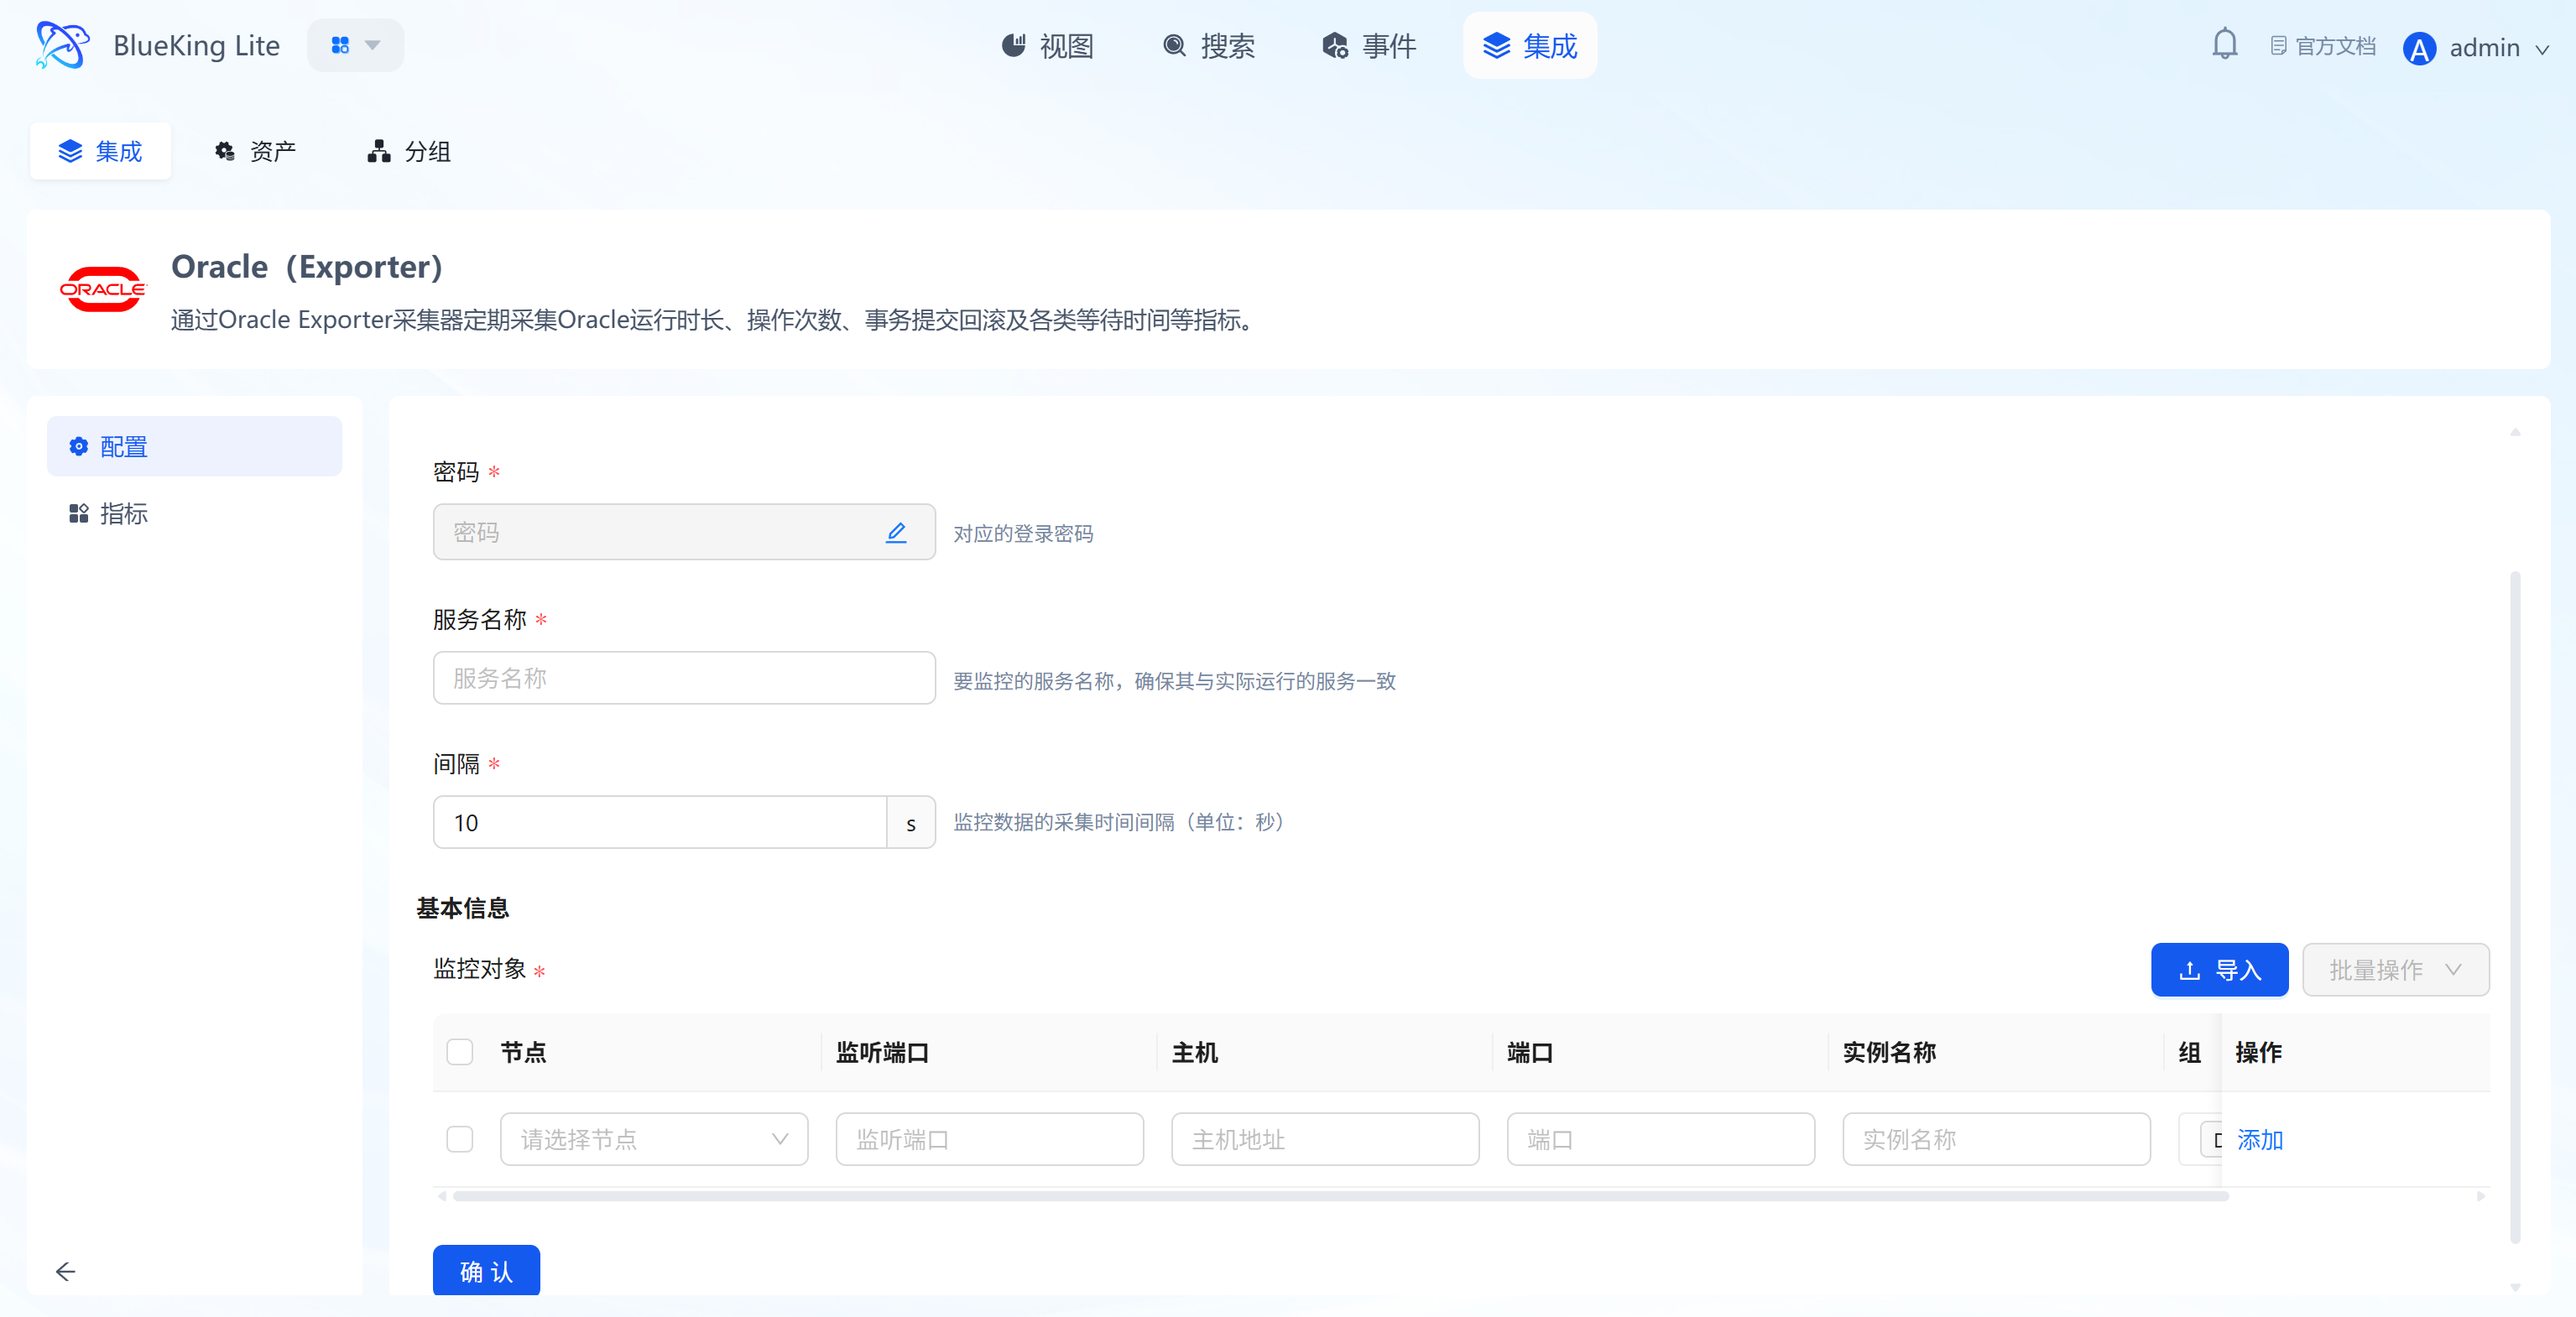
Step 2: Configure Collection Policy
- Collection configuration:
- Password: Enter the Oracle database connection password.
- Service name: Enter the Oracle Service Name (e.g.,
ORCLorPDB1). - Interval: Default is
10s.
- Configure monitoring targets:
- Node: Must select the node where the Oracle-Exporter component was just installed.
- Listener port: Default is
1521. - Host: Enter the Oracle database IP address.
- Instance name: It is recommended to name it "Oracle-BusinessName".
- Click "Confirm".
Screenshot Guide:
- Important note: In the "Node" dropdown, you can only select machines that have the Oracle component installed; otherwise, the task will fail to start.
Step 3: Verify and Analyze
- Enter the "View" module and select the "Oracle" category.
- Data verification:
- Tablespace Used: Monitor tablespace usage to prevent space exhaustion.
- Sessions: View active session count and maximum connection limits.
- Wait Time: Check database lock wait times to analyze performance bottlenecks.
Integrating MongoDB
Connect to a MongoDB database via the Telegraf plugin to collect key metrics such as read/write activity, command execution, connections, network traffic, and lock status.
Prerequisites
Before starting the integration, ensure you have completed the following preparations, which are the foundation for smooth monitoring and data security.
-
Version support
- MongoDB Server version:
3.2and above (based on actual connections, your current version is4.4). - Telegraf Agent: Installed and running on the designated collection node.
- MongoDB Server version:
-
Network connectivity
- Ensure the collection node server where Telegraf is installed can access this host's service port. If there is a firewall, please configure allow rules in advance.
-
Create a dedicated monitoring account (Security best practice) To follow the principle of least privilege, it is strongly recommended to avoid using
rootor other high-privilege accounts for monitoring. Please create a dedicated, low-privilege monitoring account in your MongoDB instance in advance.Steps are as follows:
a. (If needed) Install a matching Mongo Shell on the collection machine To avoid compatibility issues, it is recommended to install a Mongo Shell matching the server version on the Telegraf collection machine. For example, for a MongoDB 4.4 server on CentOS/RHEL:
# 1. Add the MongoDB 4.4 software repository
sudo tee /etc/yum.repos.d/mongodb-org-4.4.repo <<EOF
[mongodb-org-4.4]
name=MongoDB Repository
baseurl=https://repo.mongodb.org/yum/redhat/7/mongodb-org/4.4/x86_64/
gpgcheck=1
enabled=1
gpgkey=https://www.mongodb.org/static/pgp/server-4.4.asc
EOF

# 2. Install Mongo Shell
sudo yum install -y mongodb-org-shell
b. Log in to MongoDB as an administrator Use the
rootaccount or any account with administrator privileges to connect to your target instance via themongoshell.# Use interactive prompt for password input, which is more secure
mongo --host 10.10.90.115 --port 27017 -u root -p --authenticationDatabase adminc. Execute the following command to create a low-privilege user After a successful connection (
>prompt), execute the following command. It will create a dedicated monitoring account namedtelegraf_monitor.// Ensure operating in the admin database (specified at login)
// Create user and grant minimum monitoring privileges
db.createUser({
user: "telegraf_monitor",
pwd: "Telegraf_pw_12345", // Set a strong password for the new user
roles: [
{ role: "clusterMonitor", db: "admin" },
{ role: "read", db: "local" }
]
});Explanation:
clusterMonitor: A MongoDB built-in role designed specifically for monitoring tools, providing read-only monitoring permissions across the cluster.readonlocal: Allows reading thelocaldatabase, which is necessary for collecting replica set status and latency information.- This scheme strictly limits the capabilities of the
telegraf_monitoruser, allowing it to only read monitoring and diagnostic data, and preventing access to any collections and documents in business databases.
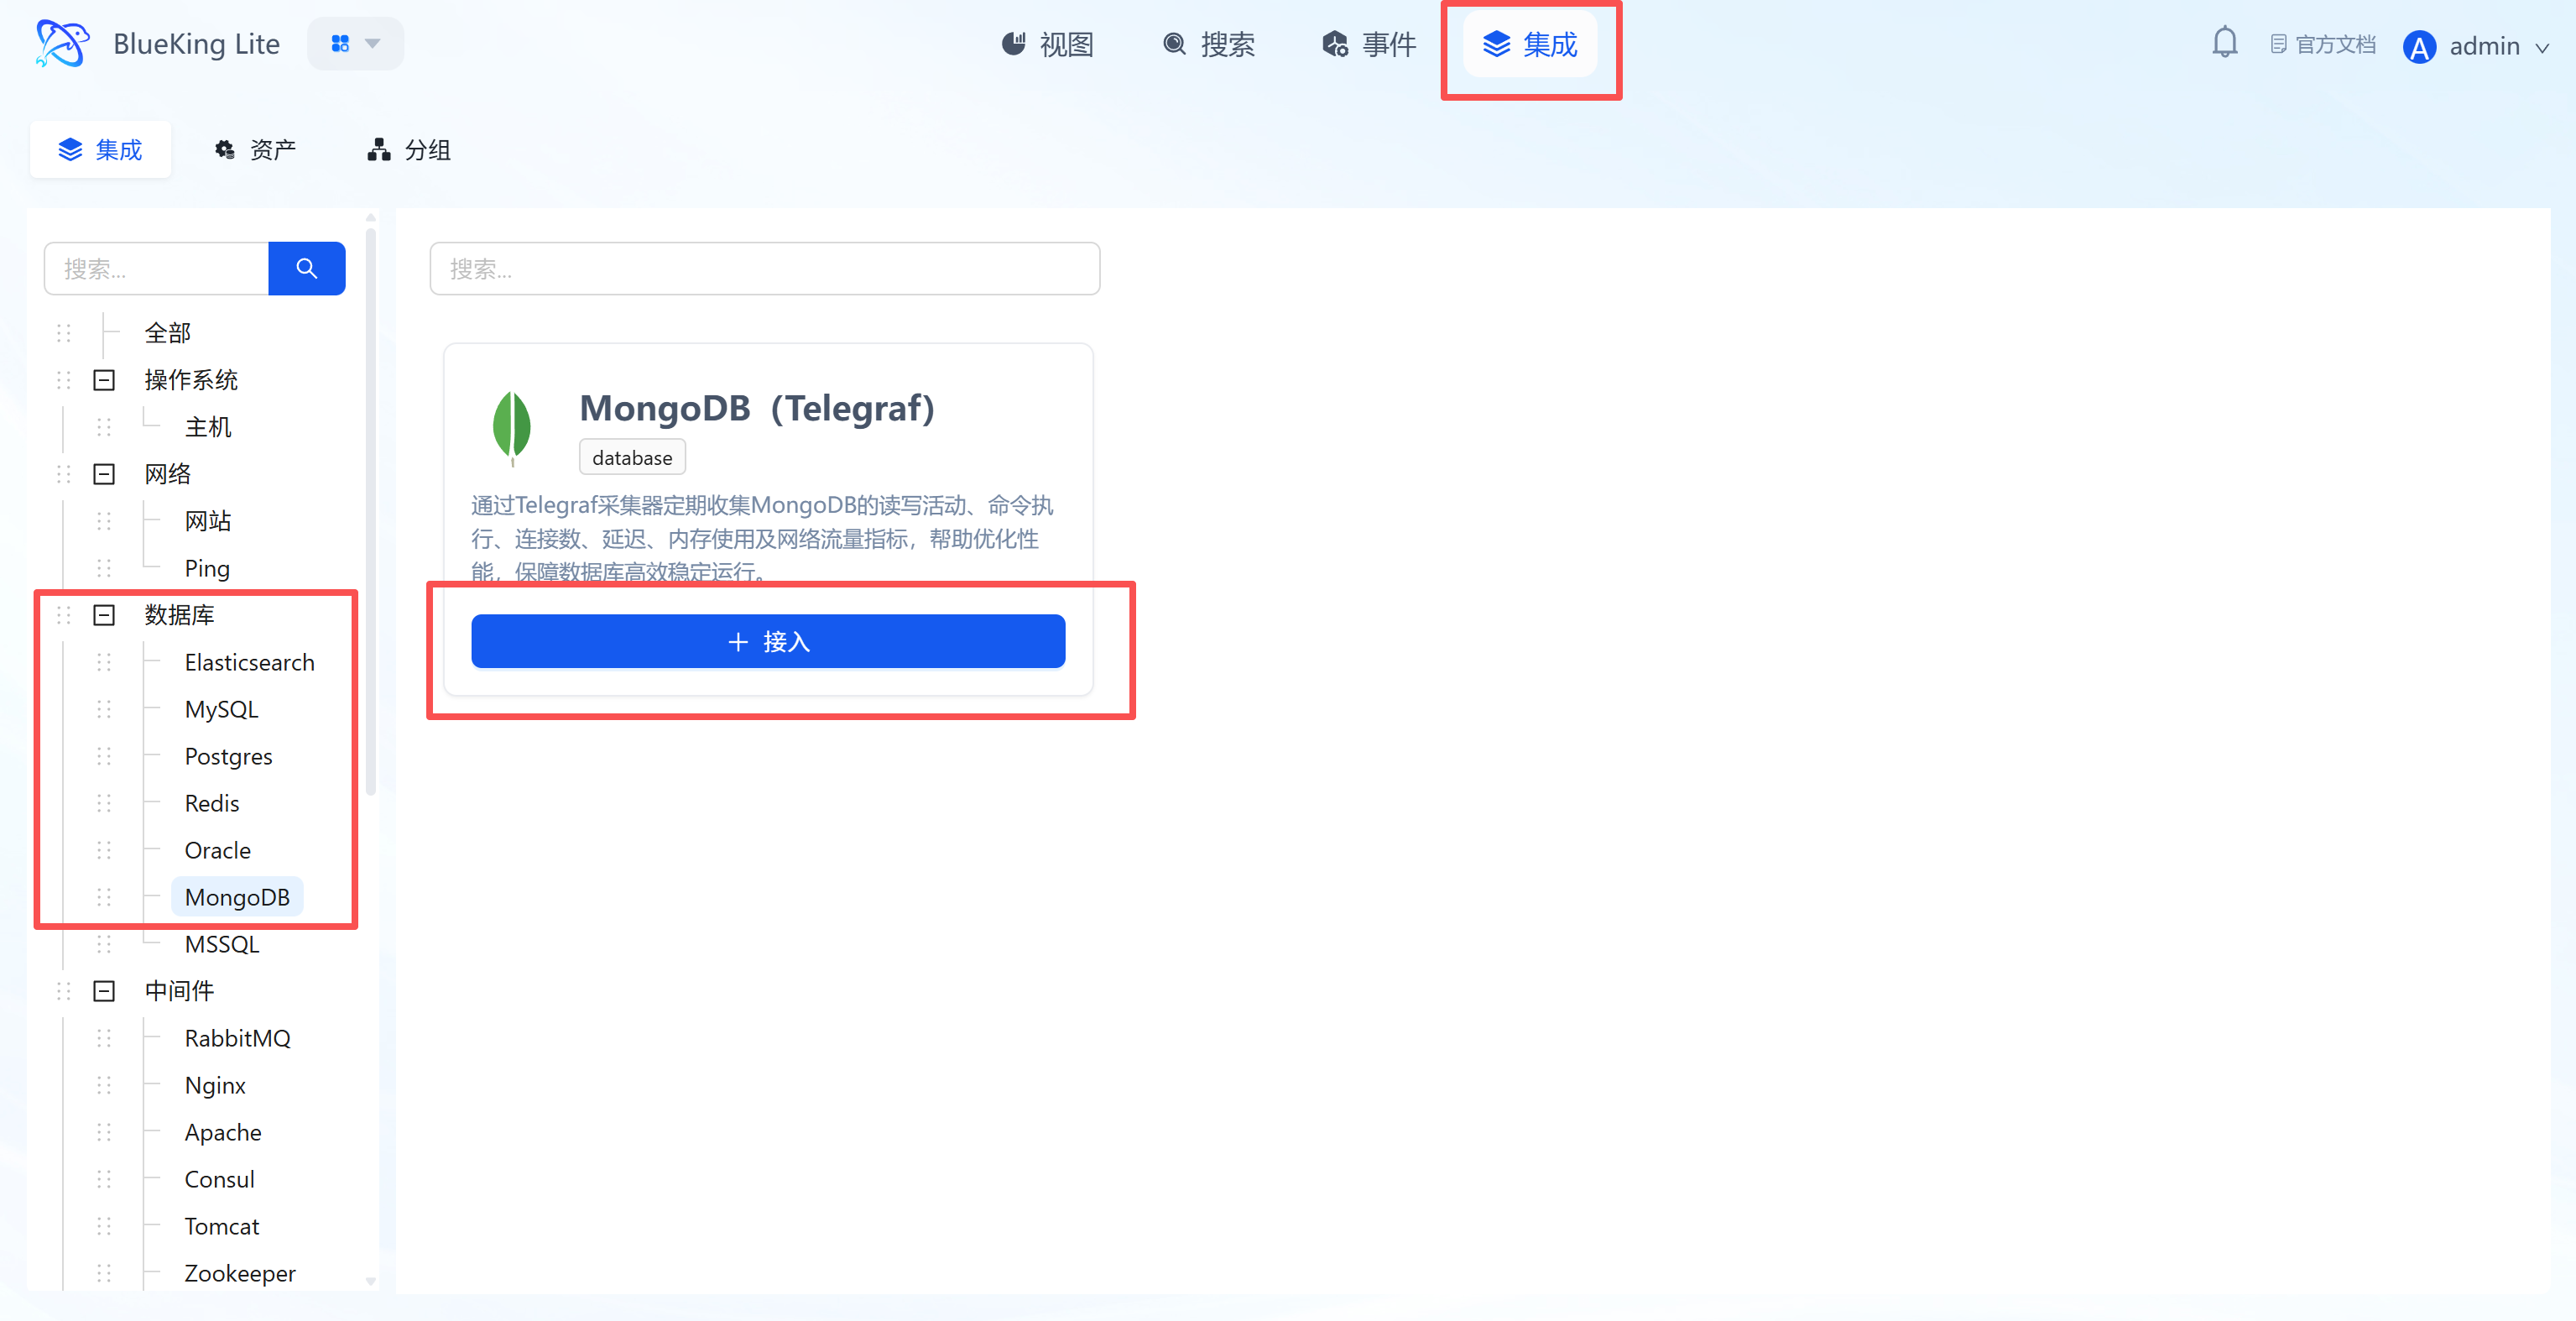
Step 1: Select an Integration Plugin
- After entering Monitor, click "Integration" in the top navigation bar.
- Select resource type:
- Expand the "Database" category in the left menu.
- Click "MongoDB".
- Click "+ Integrate" at the top right of the list.
Screenshot Guide:
- Plugin description: Supports collecting MongoDB performance, resource usage, and replica set status to ensure efficient and stable database operation.
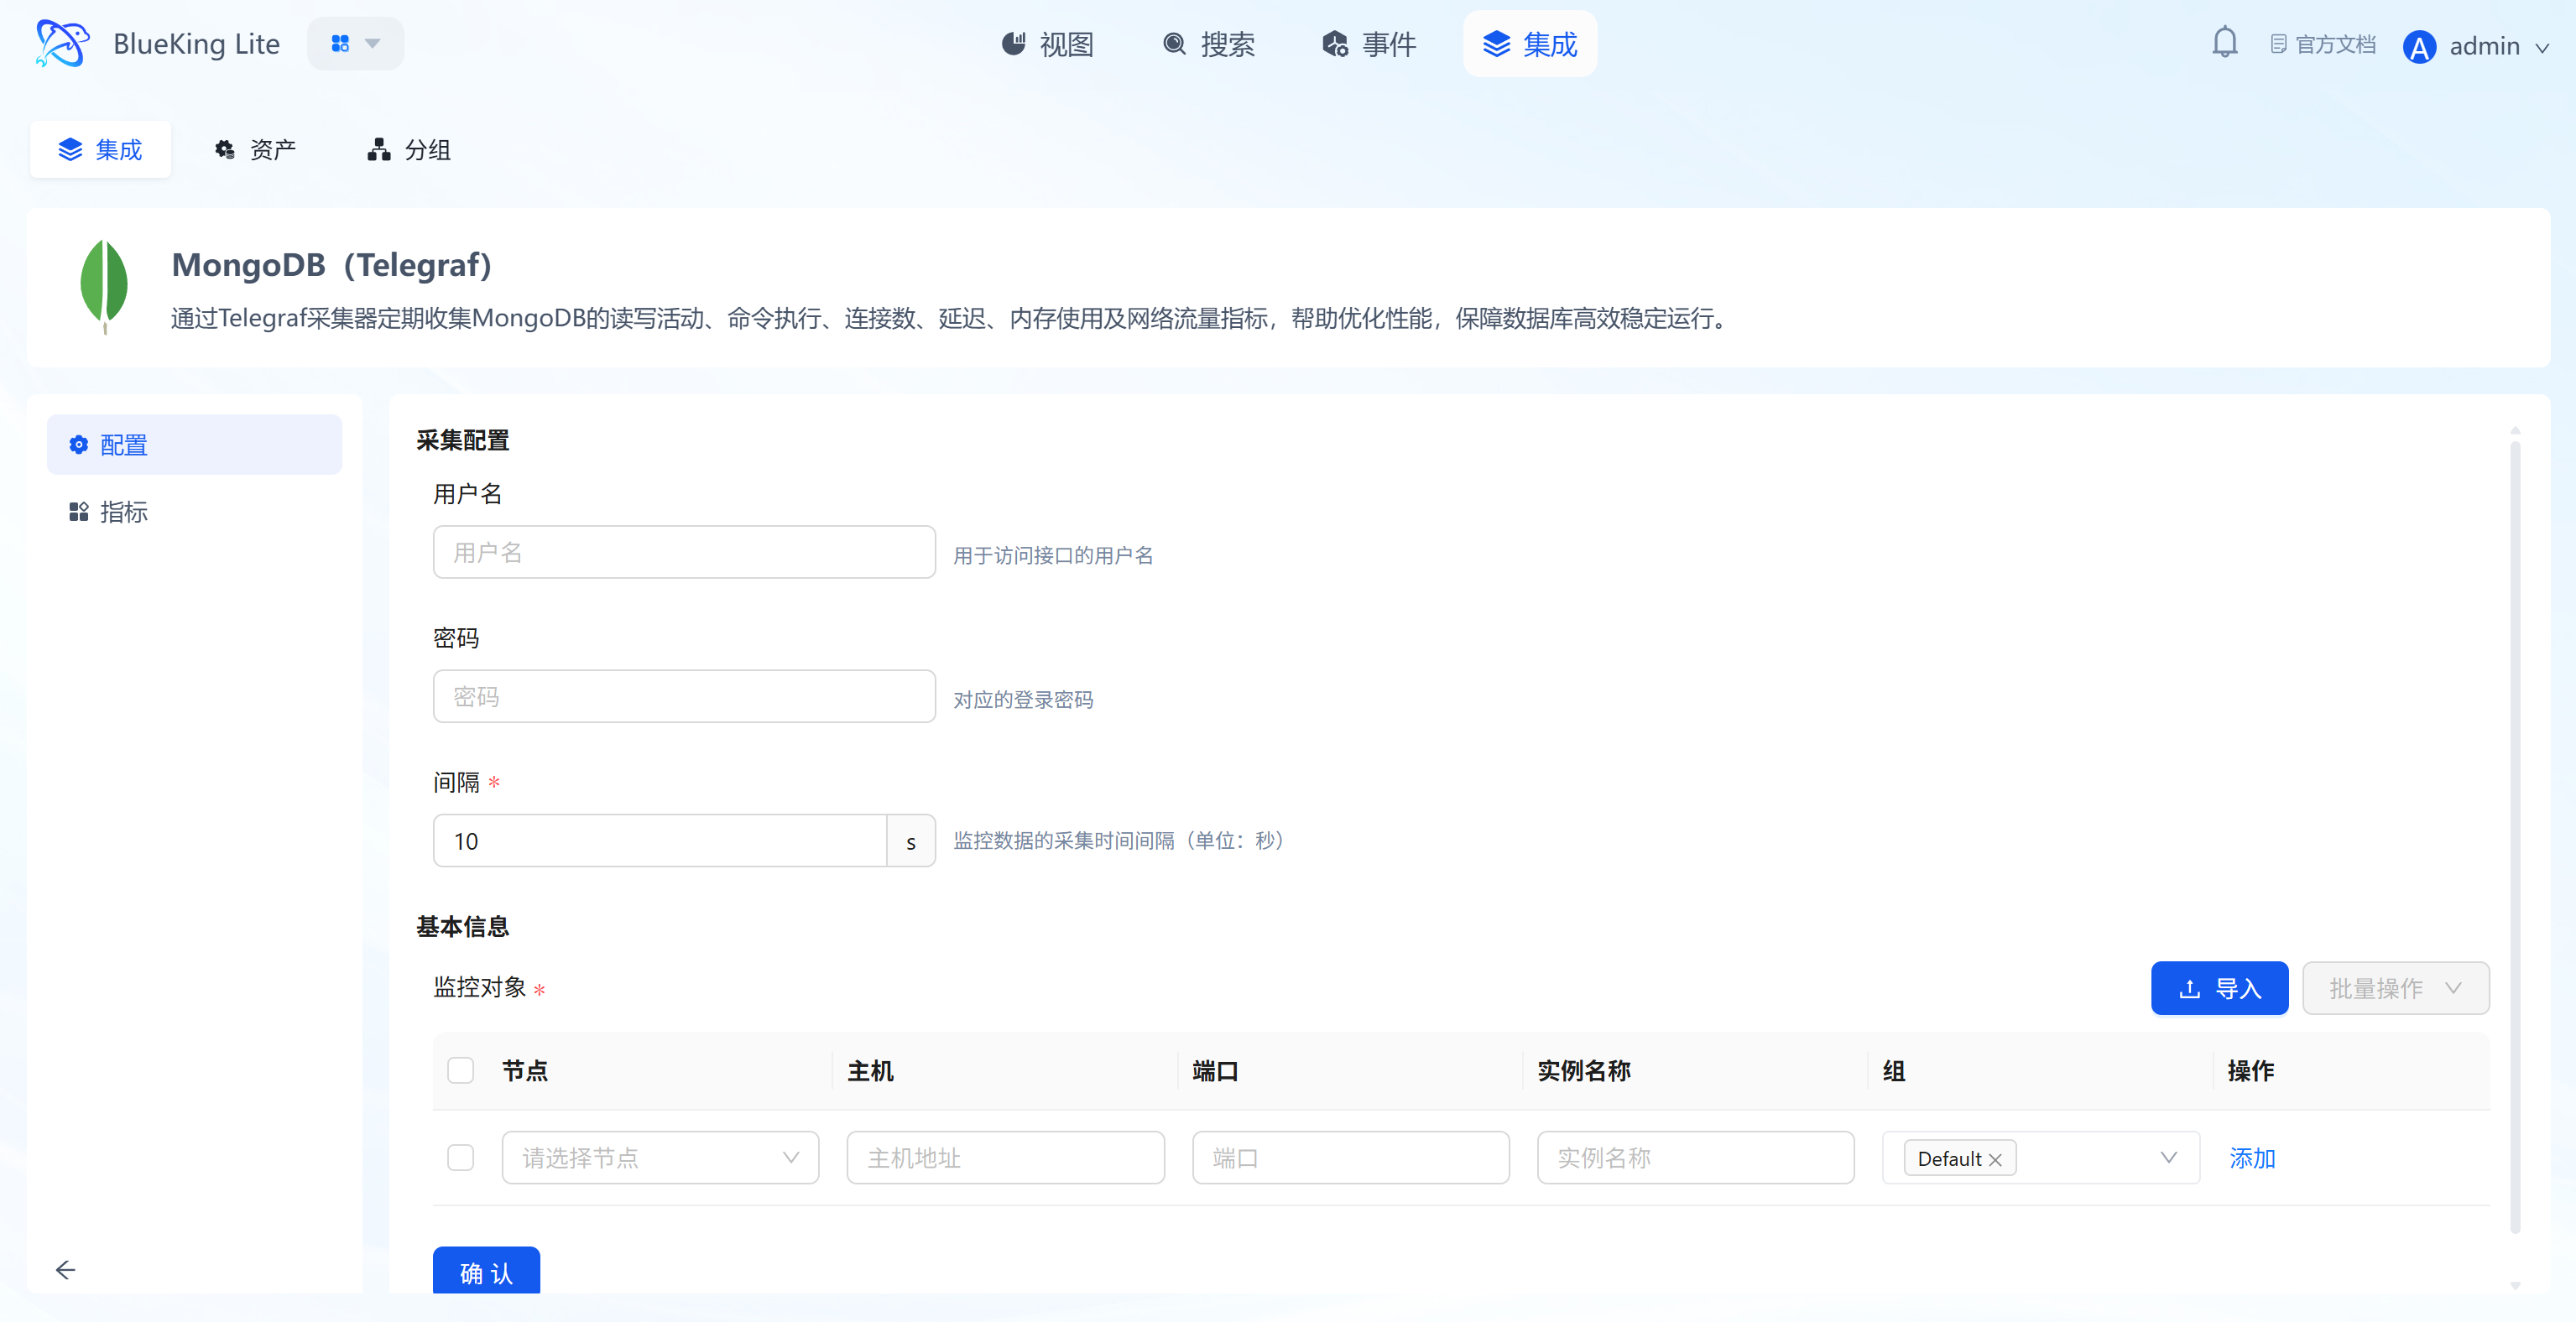
Step 2: Configure Collection Policy
In this step, you need to configure the database connection authentication and target address.
- Collection configuration (authentication information):
- Username: Enter a MongoDB account with
clusterMonitoror equivalent privileges. - Password: Enter the corresponding password.
- Interval: Default is
10s.
- Username: Enter a MongoDB account with
- Configure monitoring targets:
- Node: Select a managed host as the collector (recommended to use the MongoDB server itself or a machine on the same network segment).
- Host: Enter the MongoDB server's IP address.
- Port: Default is
27017. - Instance name: It is recommended to name it "Mongo-BusinessName".
- Click "Confirm".
Screenshot Guide:
- Collection principle: The collector will simulate a client connection to the target MongoDB and execute
serverStatusanddbStatscommands to retrieve data.
Step 3: Verify and Analyze
- Click the "View" module at the top of the page.
- In the left resource category tree, expand "Database" -> "MongoDB", enter the list and click the target instance to drill down into the view.
- Data verification:
- Operations: View the number of insert, query, update, and delete operations per second.
- Connections: Check the current active connection count to assess concurrency pressure.
- Network I/O: Monitor network traffic in/out (Bytes In/Out).
- Queues: Check read/write queue lengths; queue backlog indicates performance bottlenecks.
Integrating MSSQL
Connect to a Microsoft SQL Server database via the Telegraf plugin to collect key metrics such as performance counters, IO statistics, wait times, and memory status.
Prerequisites
Before starting the integration, ensure you have completed the following preparations, which are the foundation for smooth monitoring and data security.
-
Version support
- SQL Server version:
2008and above. - Telegraf Agent: Installed and running on the designated collection node.
- SQL Server version:
-
Network connectivity
- Ensure the collection node server where Telegraf is installed can access the target SQL Server database's service port (default
1433). - If there are firewalls (whether server or network firewalls), please configure allow rules for this port in advance.
- Ensure the collection node server where Telegraf is installed can access the target SQL Server database's service port (default
-
Create a dedicated monitoring account (Security best practice) To follow the principle of least privilege, it is strongly recommended to avoid using
saor other high-privilege accounts for monitoring. Please create a dedicated, low-privilege monitoring account in your SQL Server instance in advance.Steps are as follows:
a. Log in to SQL Server as an administrator Use
saor another account with administrator privileges to connect to your target instance via SQL Server Management Studio (SSMS) or the command-line tool (sqlcmd).b. Execute the following script to create a low-privilege user Execute the following T-SQL commands to create a dedicated monitoring account named
telegraf_monitorand grant it the minimum privileges required for collecting performance metrics.-- Step 1: Create a brand new, dedicated low-privilege login for monitoring
CREATE LOGIN [telegraf_monitor]
WITH PASSWORD = N'your_secure_password!', -- Important: Replace this password with your own strong password
DEFAULT_DATABASE = [master],
CHECK_EXPIRATION = OFF,
CHECK_POLICY = OFF;
GO
-- Step 2: Grant the minimum monitoring-only privileges to the new user
-- Allow viewing server performance status (core privilege)
GRANT VIEW SERVER STATE TO [telegraf_monitor];
GO
-- Allow viewing object definitions (supplementary privilege for retrieving database size and other metadata)
GRANT VIEW ANY DEFINITION TO [telegraf_monitor];
GOExplanation:
VIEW SERVER STATE: Allows the user to query Dynamic Management Views (DMVs) to obtain most performance metrics, which is the core for monitoring SQL Server.VIEW ANY DEFINITION: Allows the user to view metadata information of database objects.- This scheme strictly limits the capabilities of the
telegraf_monitoruser, allowing it to only read server-level status and metadata, and preventing access to any business data in user databases, thereby ensuring your database's business security.
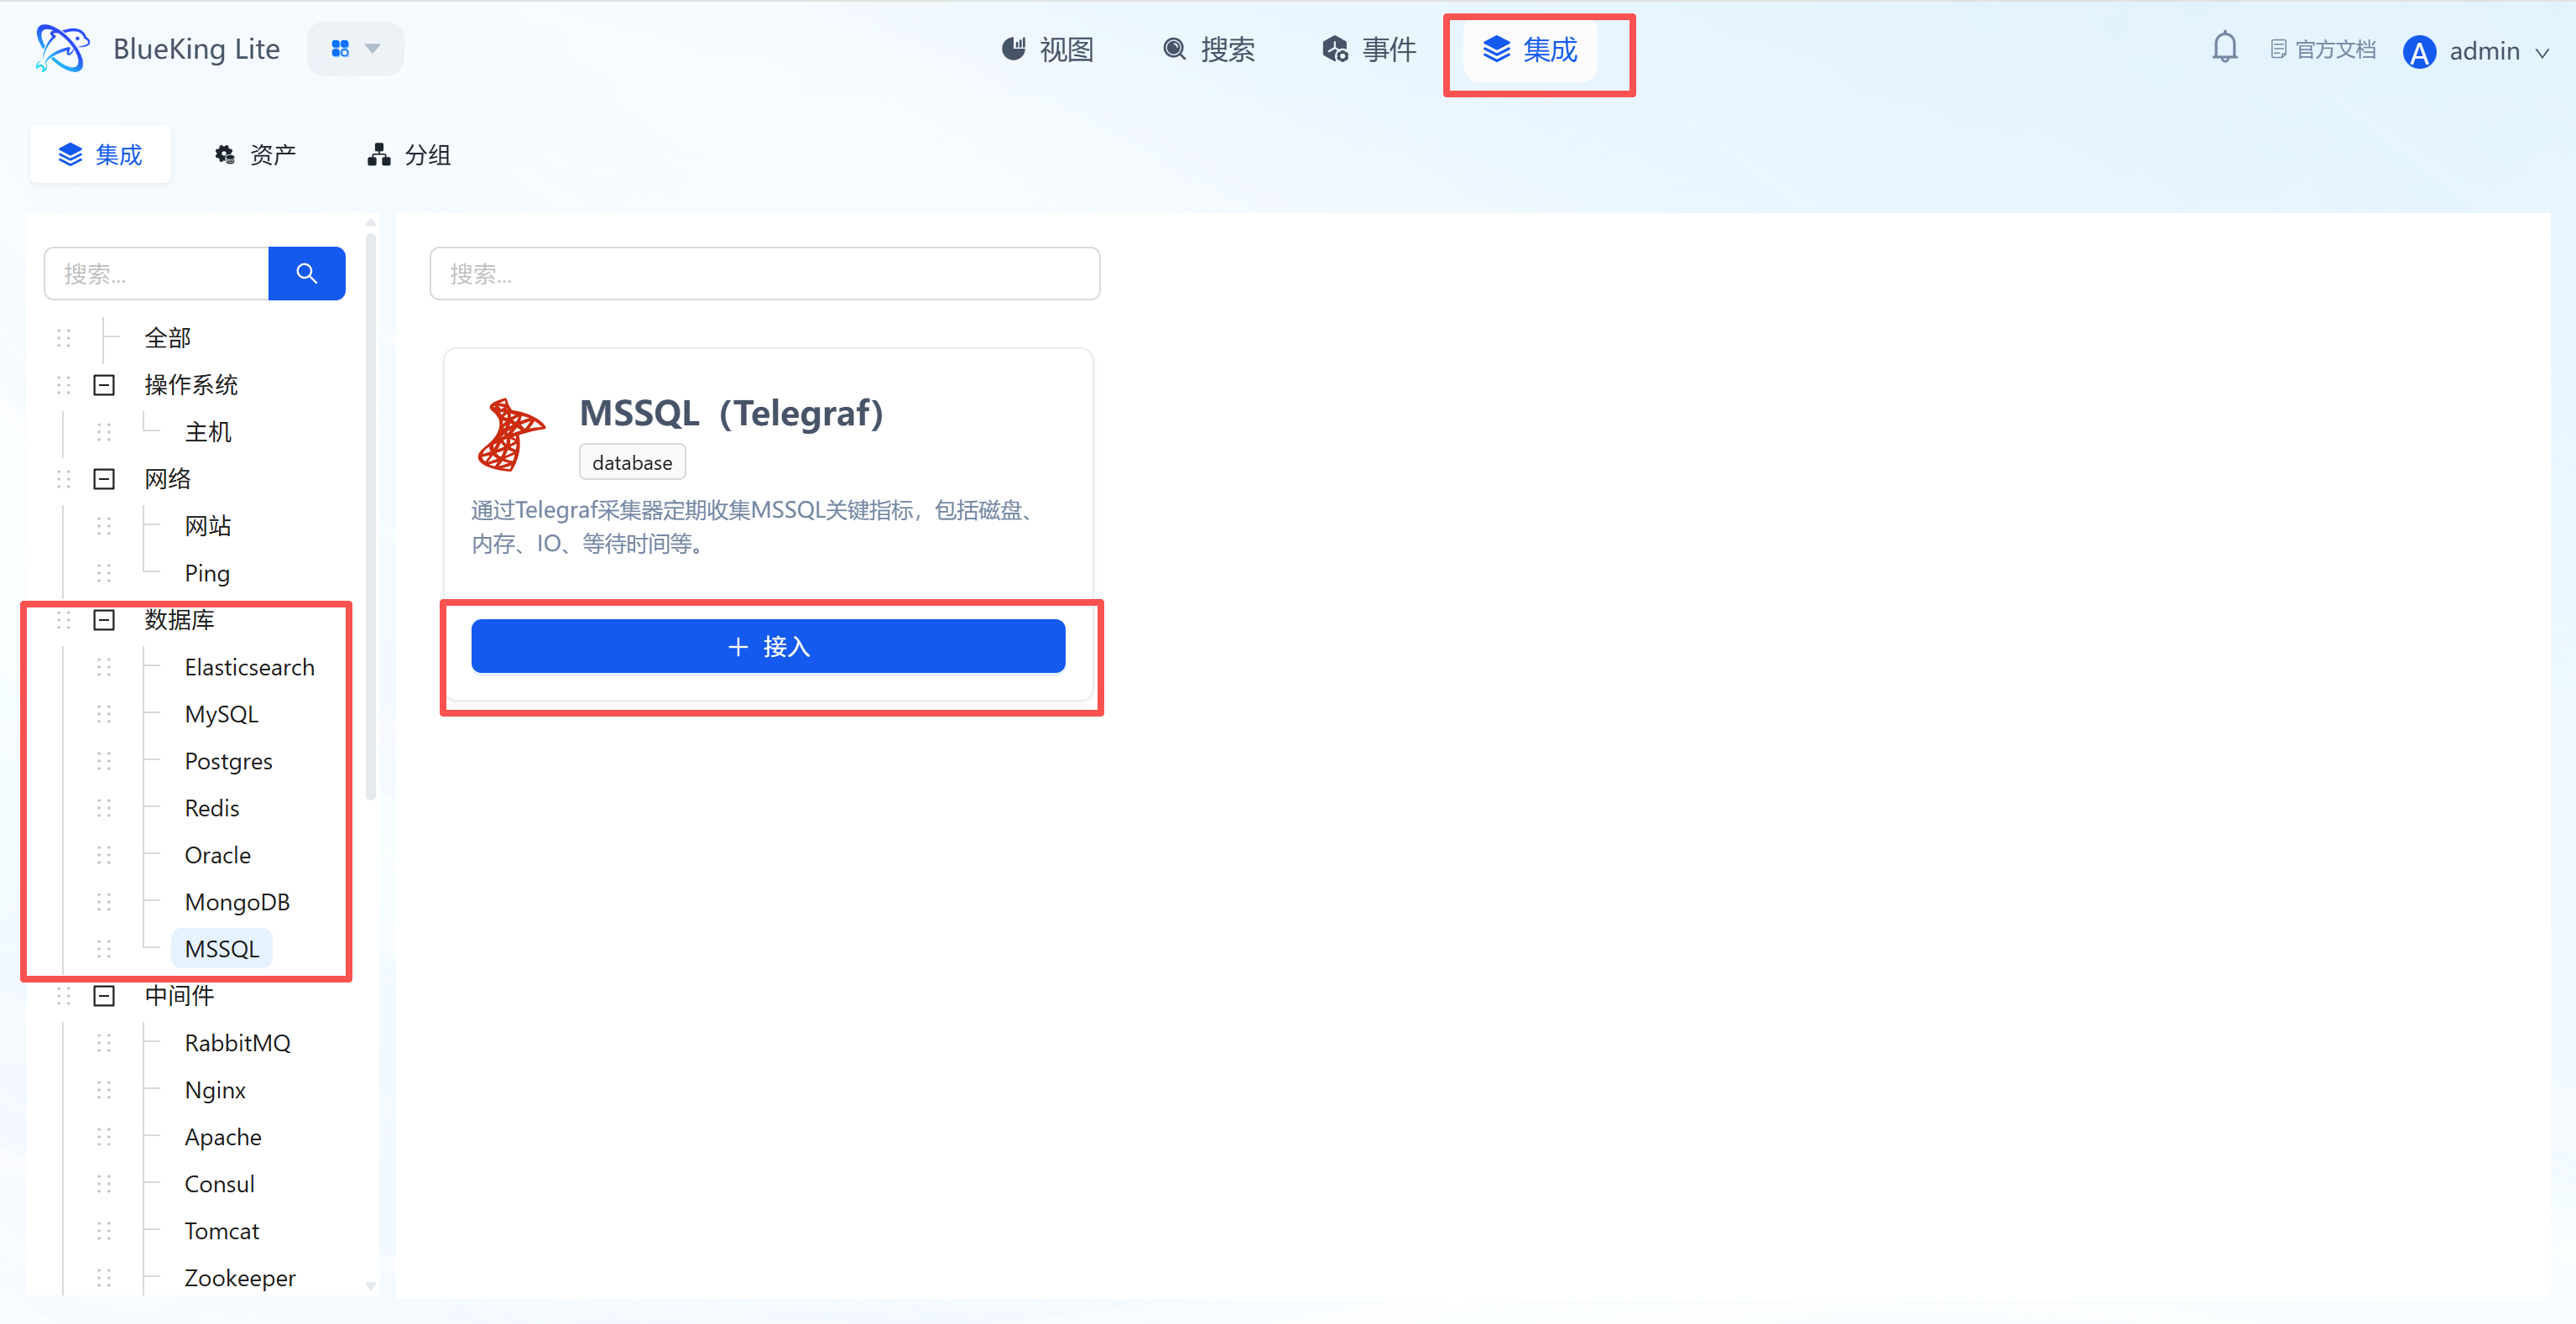
Step 1: Select an Integration Plugin
- After entering Monitor, click "Integration" in the top navigation bar.
- Select resource type:
- Expand the "Database" category in the left menu.
- Click "MSSQL".
- Click "+ Integrate" at the top right of the list.
Screenshot Guide:
- Plugin description: Supports collecting core performance data for SQL Server including disk, memory, IO, and wait times.
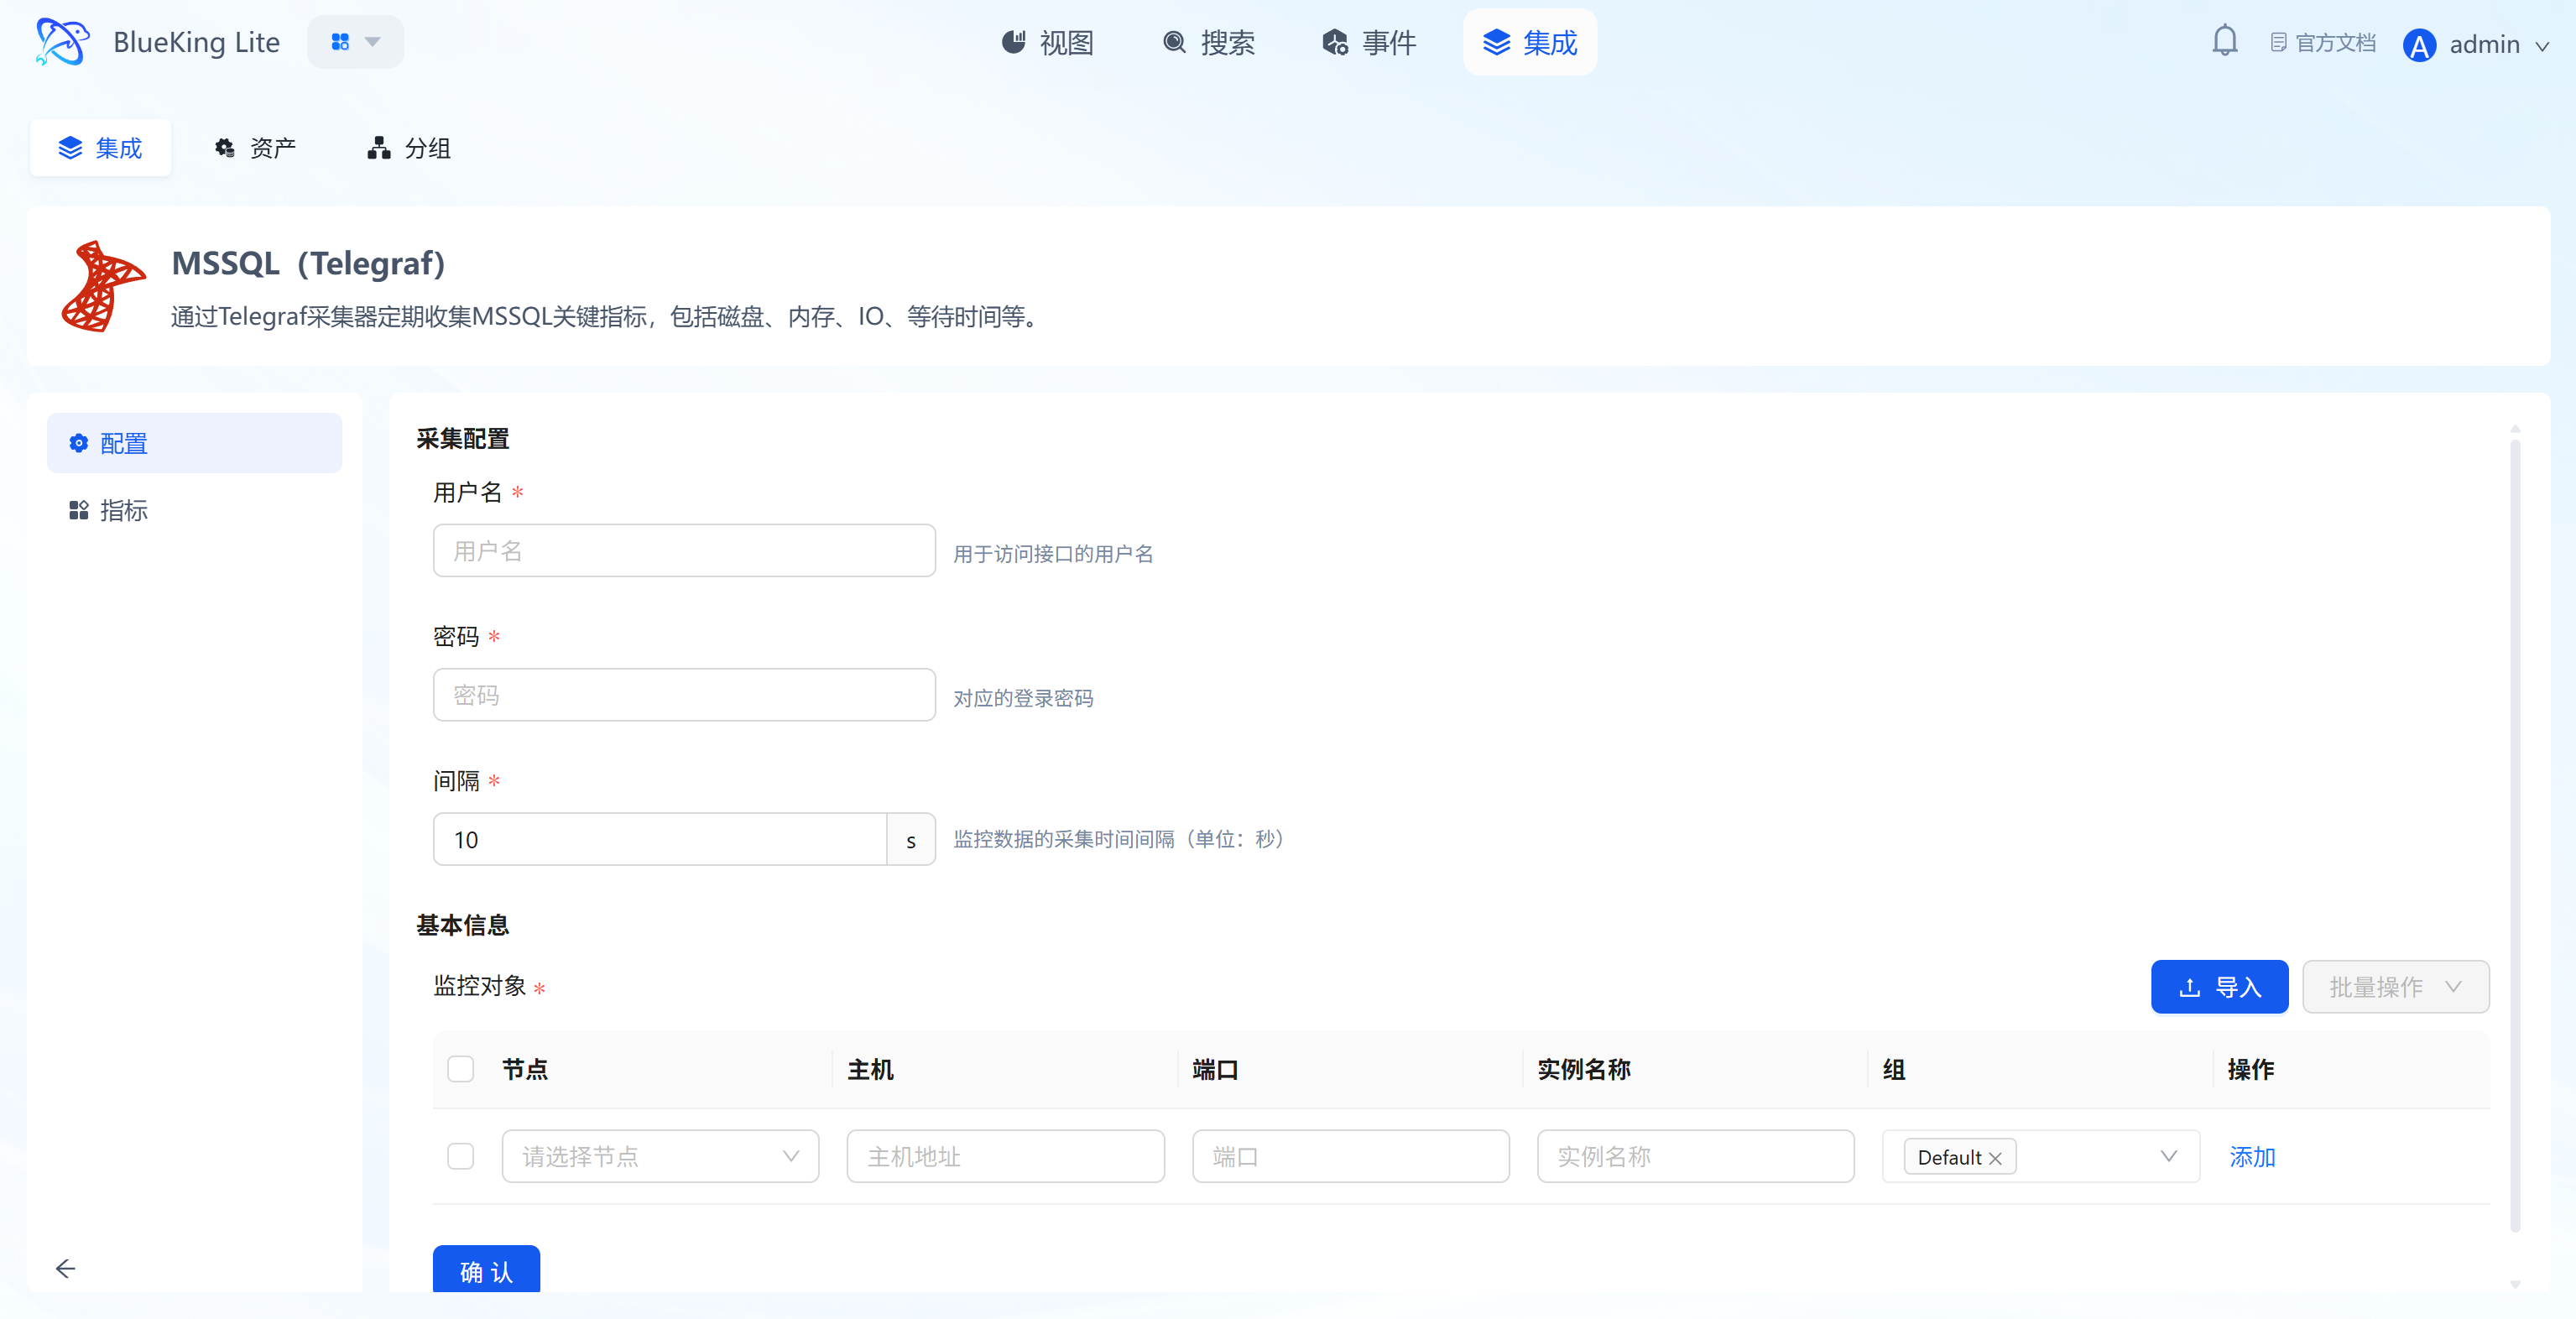
Step 2: Configure Collection Policy
In this step, you need to configure the database connection account and target address.
- Collection configuration (authentication information):
- Username: Enter a SQL Server account with
VIEW SERVER STATEprivileges. - Password: Enter the corresponding password.
- Interval: Default is
10s.
- Username: Enter a SQL Server account with
- Configure monitoring targets:
- Node: Select a managed host as the collector (recommended to use the SQL Server machine itself or a Windows/Linux machine on the same network segment).
- Host: Enter the SQL Server IP address.
- Port: Default is
1433. - Instance name: It is recommended to name it "MSSQL-BusinessName".
- Click "Confirm".
Screenshot Guide:
- Collection principle: The collector will connect to SQL Server via TCP and execute DMV (Dynamic Management View) queries to retrieve performance data.
Step 3: Verify and Analyze
- Click the "View" module at the top of the page.
- In the left resource list, expand "Database" -> "MSSQL", and click the instance name.
- Data verification:
- Batch Requests: View the number of batch requests per second, reflecting database throughput.
- Wait Stats: Monitor wait time distribution (such as IO waits, lock waits) to locate performance bottlenecks.
- Page Life Expectancy: Check the page life expectancy; a low value indicates insufficient memory.
- CPU Usage: Monitor the CPU consumption of the SQL Server process.
Middleware Monitoring
This section covers the monitoring integration workflow for mainstream middleware including RabbitMQ, Nginx, Kafka, and more.
Integrating RabbitMQ
Connect to the RabbitMQ management interface via the Telegraf plugin to collect key metrics such as queue depth, message throughput, connections, and node resources.
Prerequisites
Before starting the integration, ensure you have completed the following preparations, which are the foundation for smooth monitoring and data security.
-
Version support and environment
- RabbitMQ version: Recommended
3.0and above, and ensure the Management Plugin is enabled (enabled by default in modern versions). - Telegraf Agent: Installed and running on the designated collection node.
- RabbitMQ version: Recommended
-
Network connectivity
- Ensure the collection node server where Telegraf is installed can access the target RabbitMQ server's Management API port (default
15672). - If there are firewalls (whether server or network firewalls), please configure allow rules for this port in advance.
- Ensure the collection node server where Telegraf is installed can access the target RabbitMQ server's Management API port (default
-
Create a dedicated monitoring account (Security best practice) To follow the principle of least privilege, it is strongly recommended to avoid using
guestor other administrator accounts for monitoring. Please create a dedicated, low-privilege monitoring account in your RabbitMQ instance in advance.Steps are as follows:
We provide two creation methods; you can choose either based on convenience.
-
Method 1: Via
rabbitmqctlcommand line (requires server login)- a. Log in to the RabbitMQ server as an administrator Use SSH or similar methods to log in to the RabbitMQ server as root or a user with sudo privileges.
- b. Execute the following script to create a low-privilege user
# Step 1: Create a brand new login user dedicated to monitoring
# Important: Replace 'your_secure_password!' with a real strong password
rabbitmqctl add_user telegraf_monitor 'your_secure_password!'

# Step 2: Assign the 'monitoring' tag to the new user — this is the core of implementing least privilege
rabbitmqctl set_user_tags telegraf_monitor monitoring

# Step 3: Grant the user access to the default virtual host ('/')
# Permissions will be further restricted by the 'monitoring' tag, ensuring security
rabbitmqctl set_permissions -p / telegraf_monitor ".*" ".*" ".*"
-
Method 2: Via Management HTTP API remote creation (Recommended)
- a. Operate from any terminal with network access
This method does not require logging into the RabbitMQ server. You only need to execute it from any machine that can access the
15672port using tools likecurl. You need an existing administrator account (such asguestorweops) for authentication. - b. Execute the following
curlcommands to create a low-privilege user# Step 1: Create user, set password, and directly assign the 'monitoring' tag
# - Replace [admin_user]:[admin_pass] with existing admin account credentials, e.g., weops:guest
# - Replace 'your_secure_password!' with a strong password for the new user
# - Replace [rabbitmq_host] with the RabbitMQ server's IP address or domain name
curl -i -u [admin_user]:[admin_pass] -X PUT -H "content-type:application/json" \
-d '{"password":"your_secure_password!", "tags":"monitoring"}' \
http://[rabbitmq_host]:15672/api/users/telegraf_monitor
# Step 2: Grant the new user access to the default virtual host ('/')
# Note: %2F in the URL is the encoding for /
curl -i -u [admin_user]:[admin_pass] -X PUT -H "content-type:application/json" \
-d '{"configure":".*", "write":".*", "read":".*"}' \
http://[rabbitmq_host]:15672/api/permissions/%2F/telegraf_monitor
- a. Operate from any terminal with network access
This method does not require logging into the RabbitMQ server. You only need to execute it from any machine that can access the
-
Explanation:
set_user_tags ... monitoring: This is the core of implementing least-privilege monitoring. RabbitMQ's built-inmonitoringtag forces the user's capabilities to be limited to: viewing metadata and performance metrics of all objects only, unable to view any specific messages in queues, and unable to perform any management operations such as publish/subscribe or configuration modifications.set_permissions ...: This command grants the user an "entry ticket" to access the specified virtual host (Virtual Host, here the default/). Although the regex".*"in the command appears to grant all permissions, themonitoringtag has higher priority and will override these permissions, ultimately ensuring the user can only perform read-only monitoring operations.- This scheme strictly limits the capabilities of the
telegraf_monitoruser, allowing it to only read server-level status and metrics, and preventing access to any business data, thereby ensuring your message queue's business security.
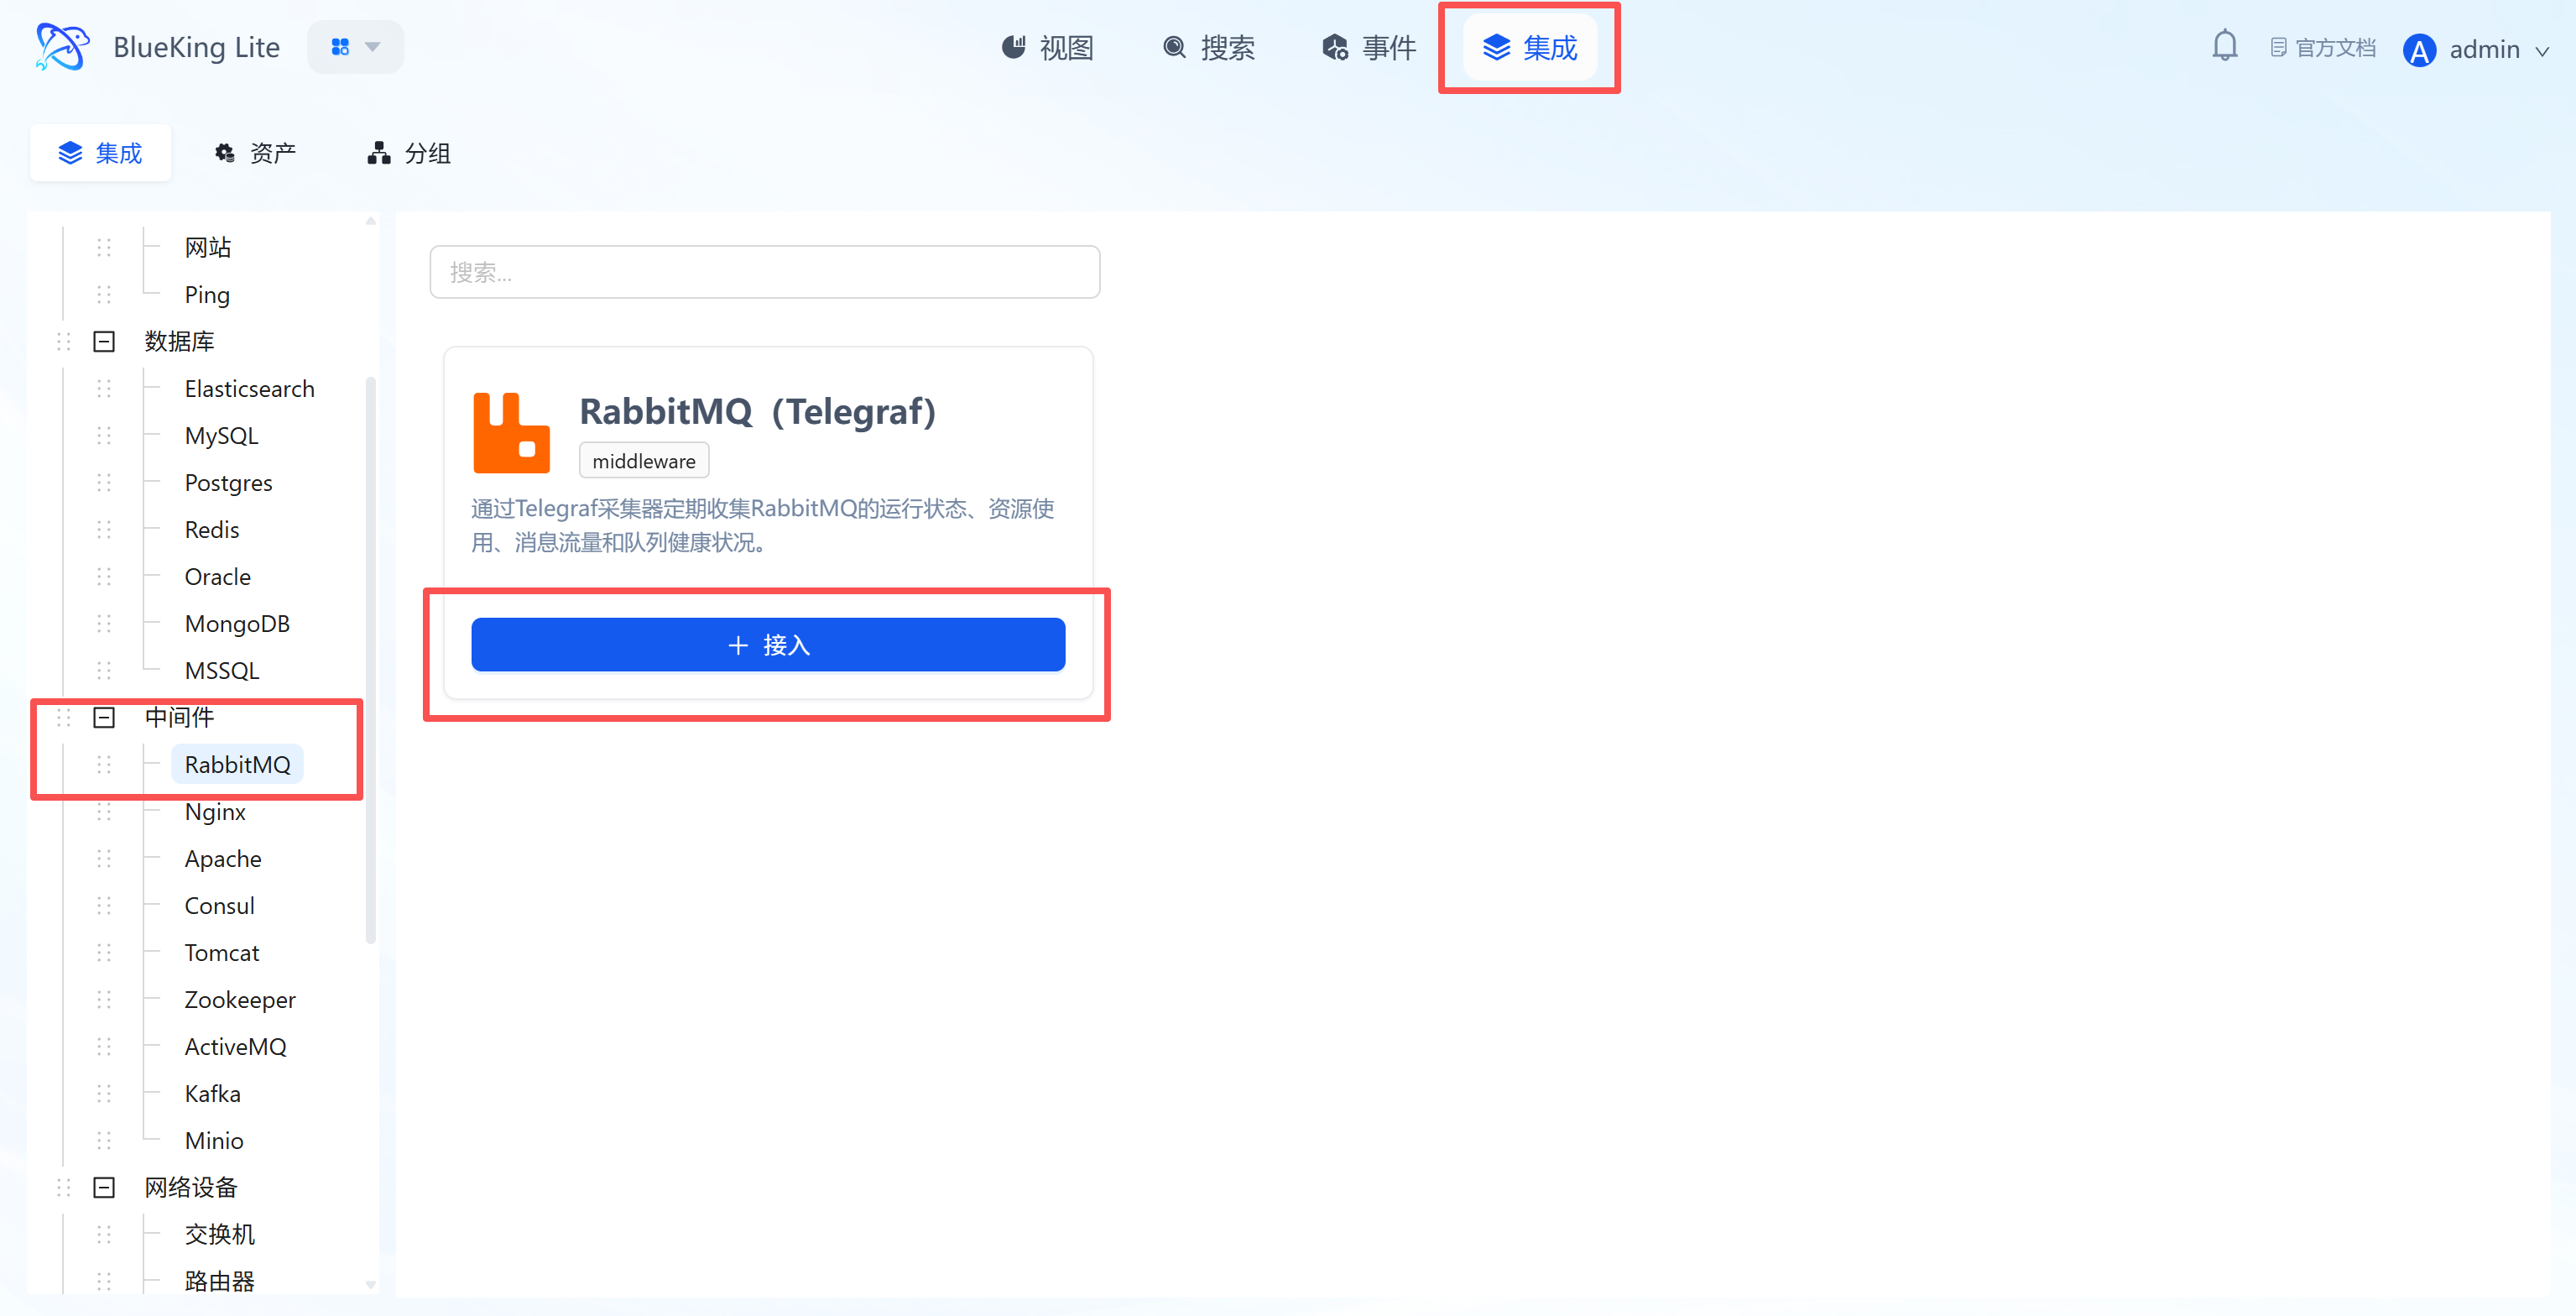
Step 1: Select an Integration Plugin
- After entering Monitor, click "Integration" in the top navigation bar.
- Select resource type:
- Expand the "Middleware" category in the left menu.
- Click "RabbitMQ".
- Click "+ Integrate" at the top right of the list.
Screenshot Guide:
- Plugin description: Collects data using the API interface provided by the RabbitMQ Management Plugin.
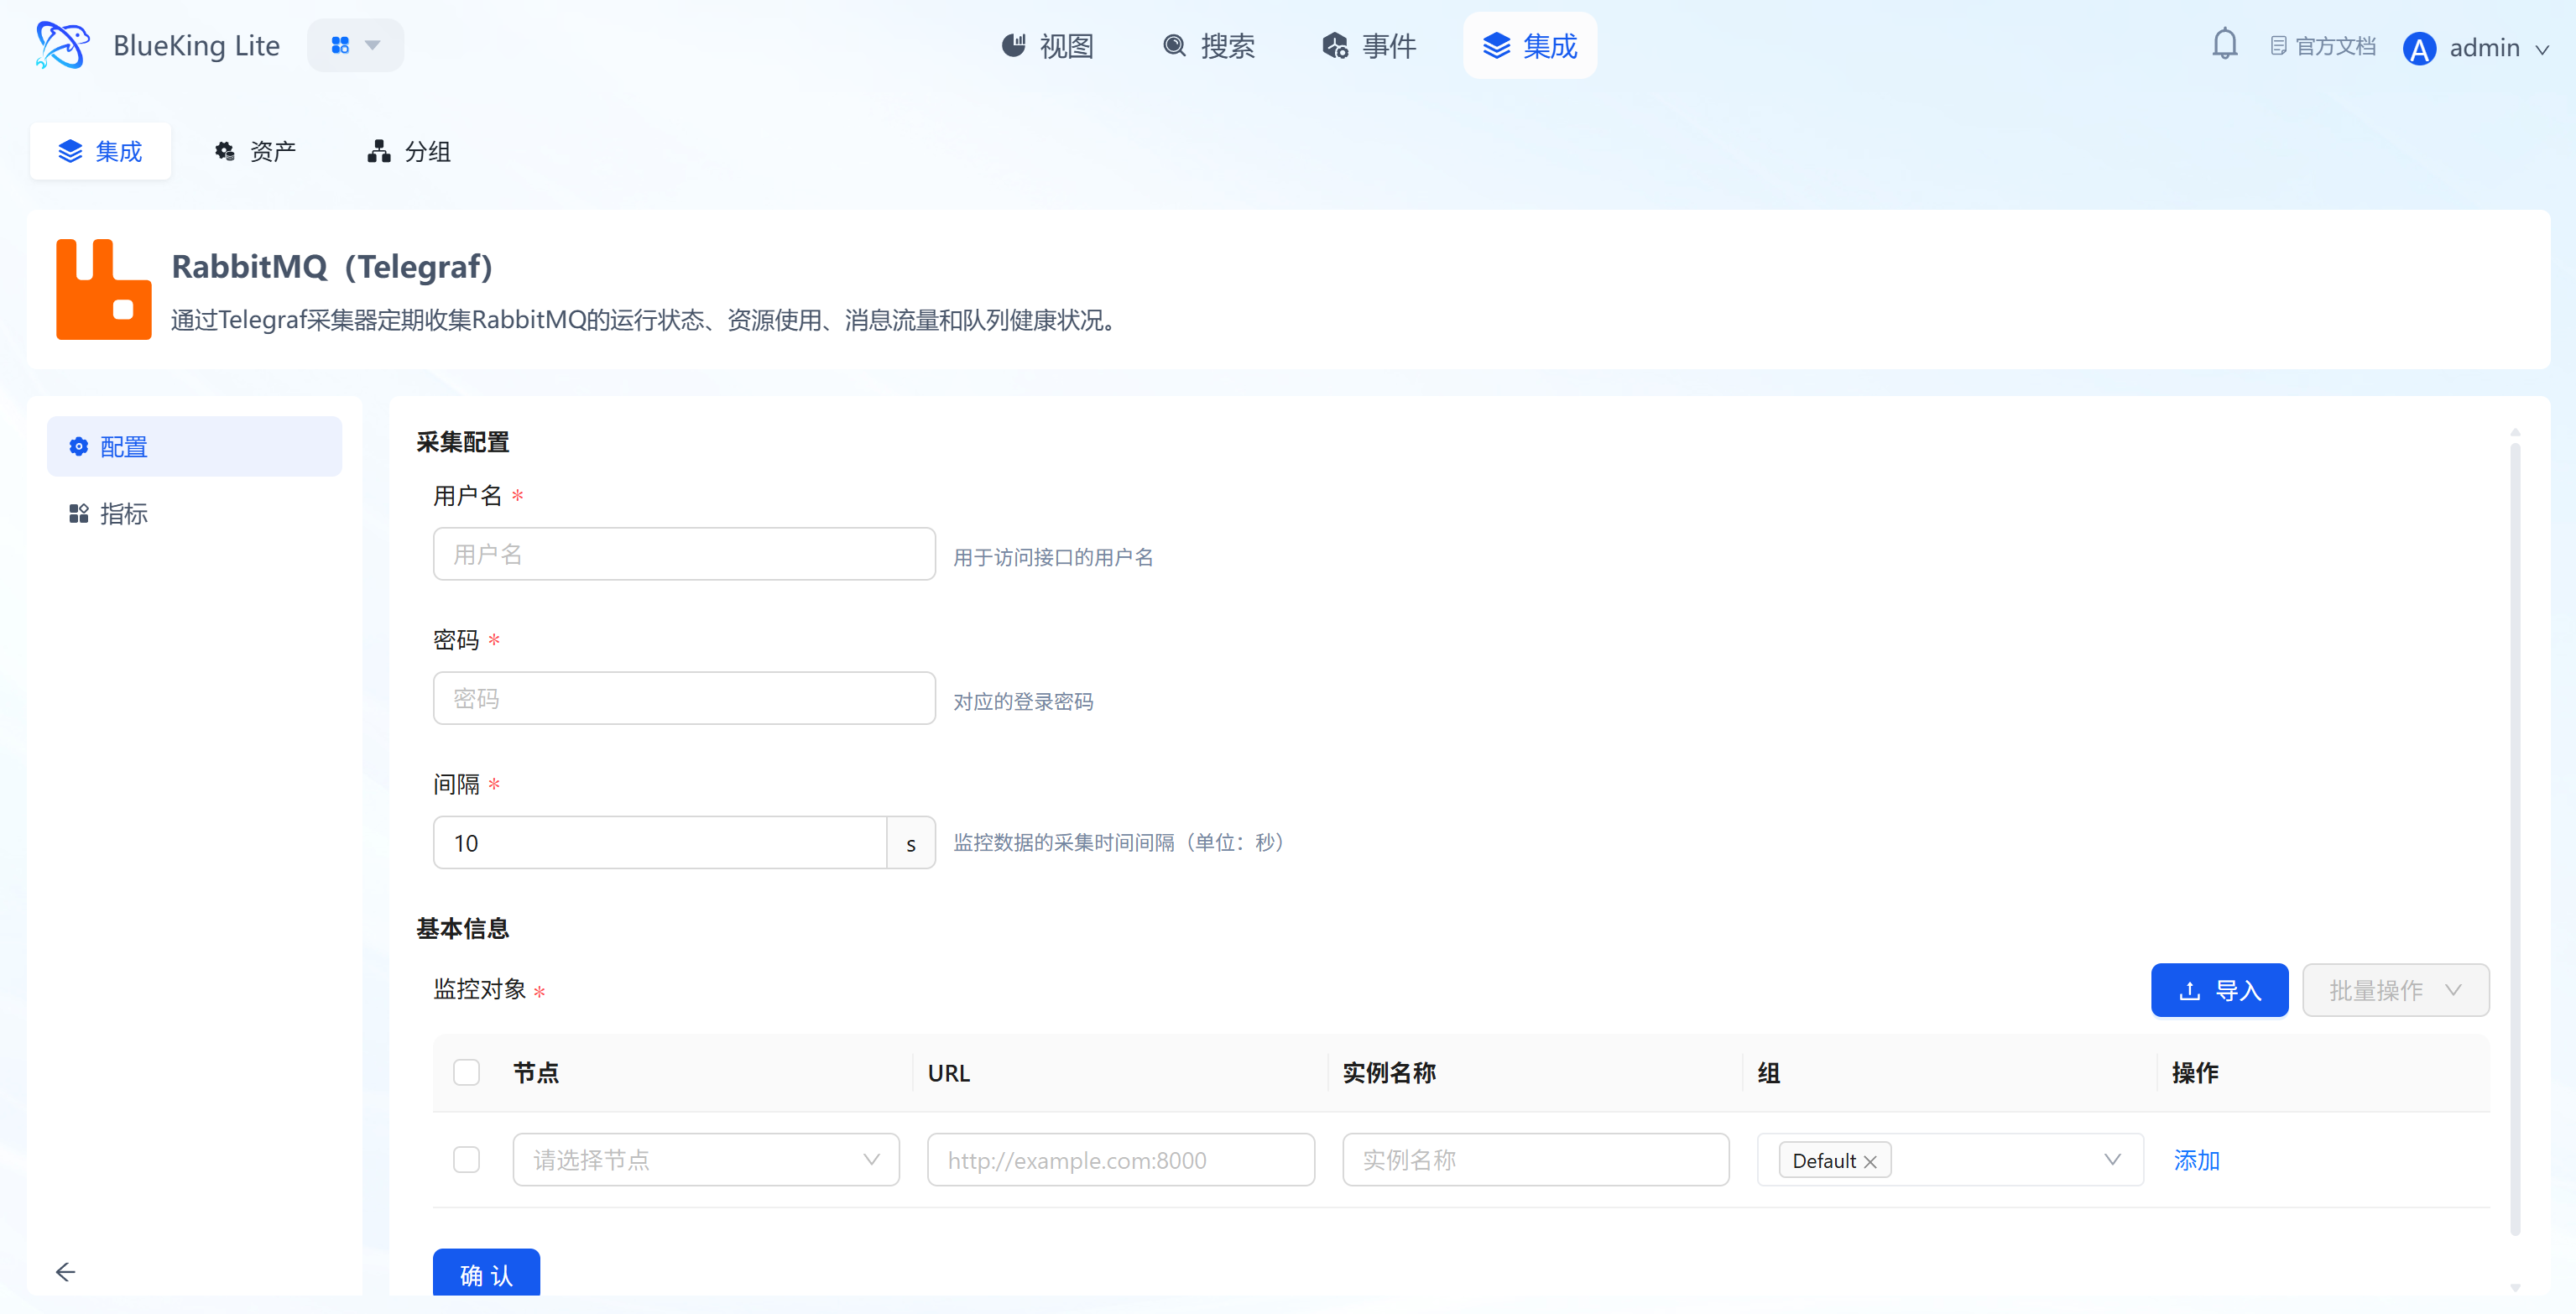
Step 2: Configure Collection Policy
In this step, you need to configure the RabbitMQ management address and authentication information.
- Collection configuration:
- Username: Enter an account with monitoring privileges (recommended to have the
monitoringtag). - Password: Enter the corresponding password.
- Interval: Default is
10s.
- Username: Enter an account with monitoring privileges (recommended to have the
- Configure monitoring targets:
- Node: Select a managed host as the collector (recommended to use the RabbitMQ machine itself or a machine on the same network segment).
- URL: Enter the RabbitMQ management console address.
- Format:
http://IP:15672(note: this is the management port 15672, not the data port 5672).
- Format:
- Instance name: It is recommended to name it "RabbitMQ-ClusterName".
- Click "Confirm".
Screenshot Guide:
- Port note: Make sure to enter the Management plugin's HTTP port (default 15672).
Step 3: Verify and Analyze
- Click the "View" module at the top of the page.
- In the left resource list, expand "Middleware" -> "RabbitMQ", and click the instance name.
- Data verification:
- Messages: Monitor the total message count (Ready + Unacked); continuous accumulation indicates insufficient consumption capacity.
- Message Rates: View publish and deliver rates.
- Queues: Check the specific backlog situation for each queue.
- Nodes: Monitor cluster node memory and disk usage.
Integrating Nginx
Connect to Nginx's stub_status interface via the Telegraf plugin to collect core metrics such as active connections, request processing rate, and connection state distribution.
Prerequisites
Before starting the integration, ensure that the Nginx server has enabled the http_stub_status_module module and configured a status page (Status URL), which is the foundation for data collection.
-
Confirm module support
- Check whether Nginx has compiled the
http_stub_status_modulemodule (most distributions include it by default). - Verification command:
nginx -V 2>&1 | grep -o with-http_stub_status_module - If the output contains the module name, monitoring is supported.
- Check whether Nginx has compiled the
-
Configure Nginx status page
- Edit the Nginx configuration file (typically located at
/etc/nginx/nginx.confor/etc/nginx/conf.d/default.conf). - In the
serverblock corresponding to your business (or add a new one), add the followinglocationconfiguration:server {
listen 80; # Adjust the port according to your actual situation, e.g., 30080
# --- Add the following monitoring configuration block ---
location /stub_status {
stub_status; # Enable status monitoring directive
access_log off; # Disable access logs for this endpoint to avoid log flooding
# Security control: It is recommended to only allow access from localhost and the Telegraf collection machine
allow 127.0.0.1;
allow <Telegraf_collector_IP>;
deny all;
}
} - After configuration, run
nginx -tto check syntax, and runnginx -s reloadto reload the service.
- Edit the Nginx configuration file (typically located at
-
Verify interface availability
- Important note: Nginx's status page is machine-readable by default and requires no special parameters.
- Test command:
curl http://<NginxIP>:<port>/stub_status - Success criteria: Returns plain text information in a format similar to:
Active connections: 2
server accepts handled requests
 105 105 105
Reading: 0 Writing: 1 Waiting: 1
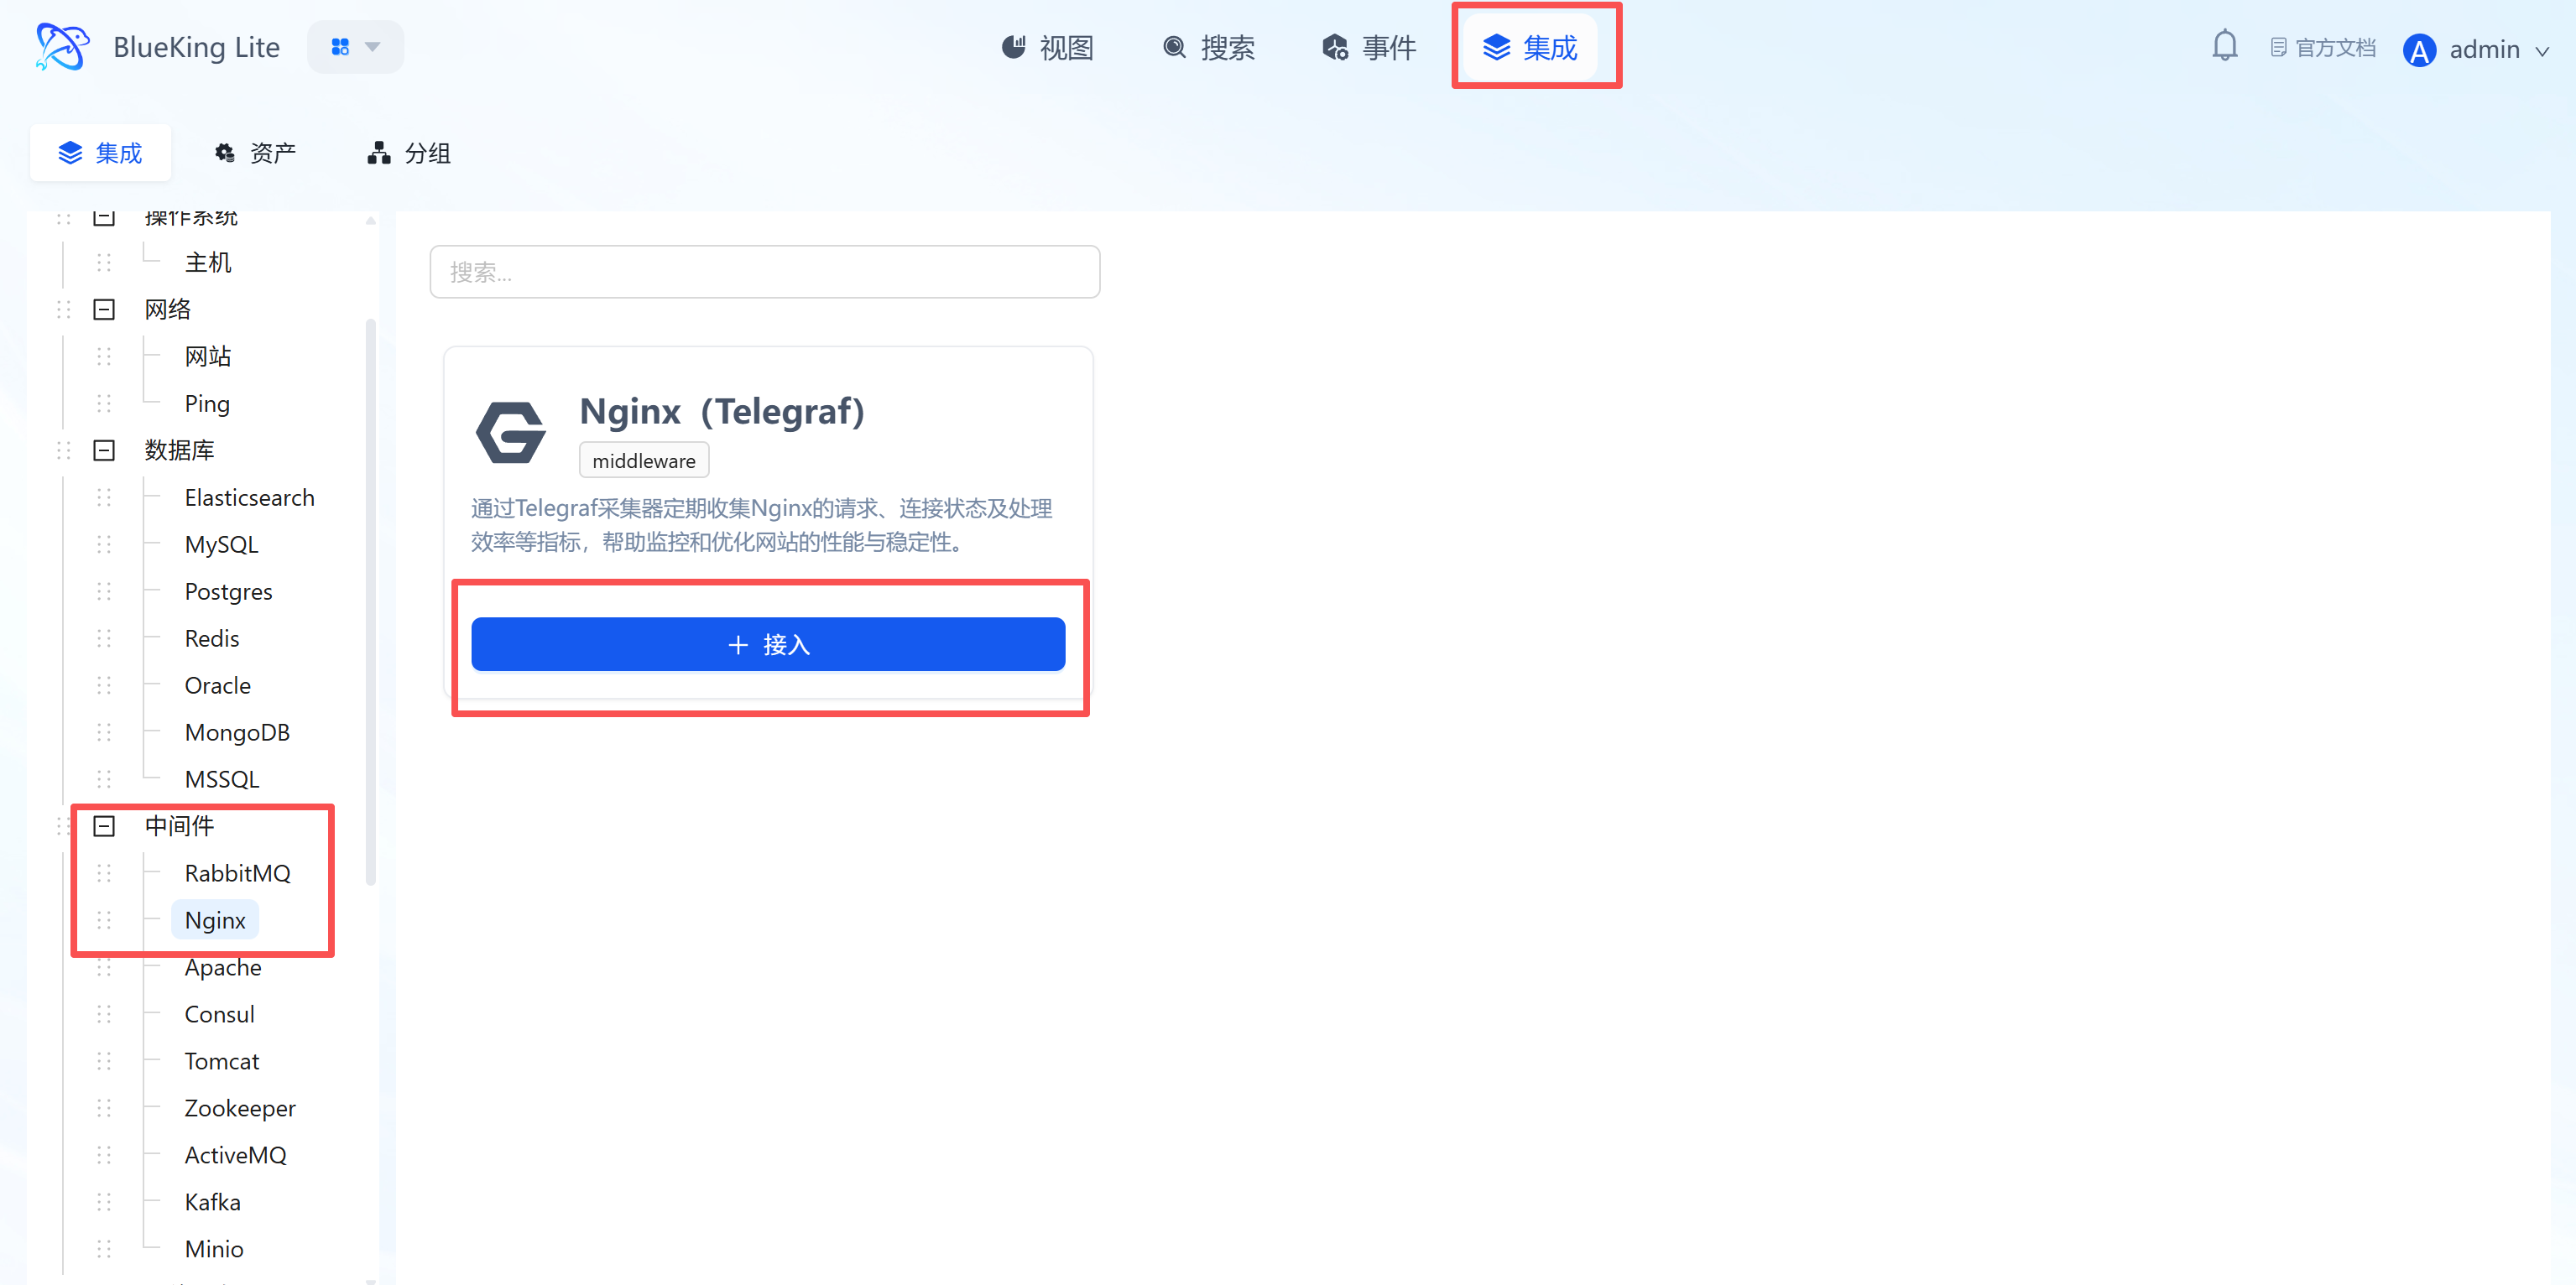
Step 1: Select an Integration Plugin
- After entering Monitor, click "Integration" in the top navigation bar.
- Select resource type:
- Expand the "Middleware" category in the left menu.
- Click "Nginx".
- Click "+ Integrate" at the top right of the list.
Screenshot Guide:
- Plugin description: No need to install an Agent inside the Nginx container; simply provide the Status URL for remote collection.
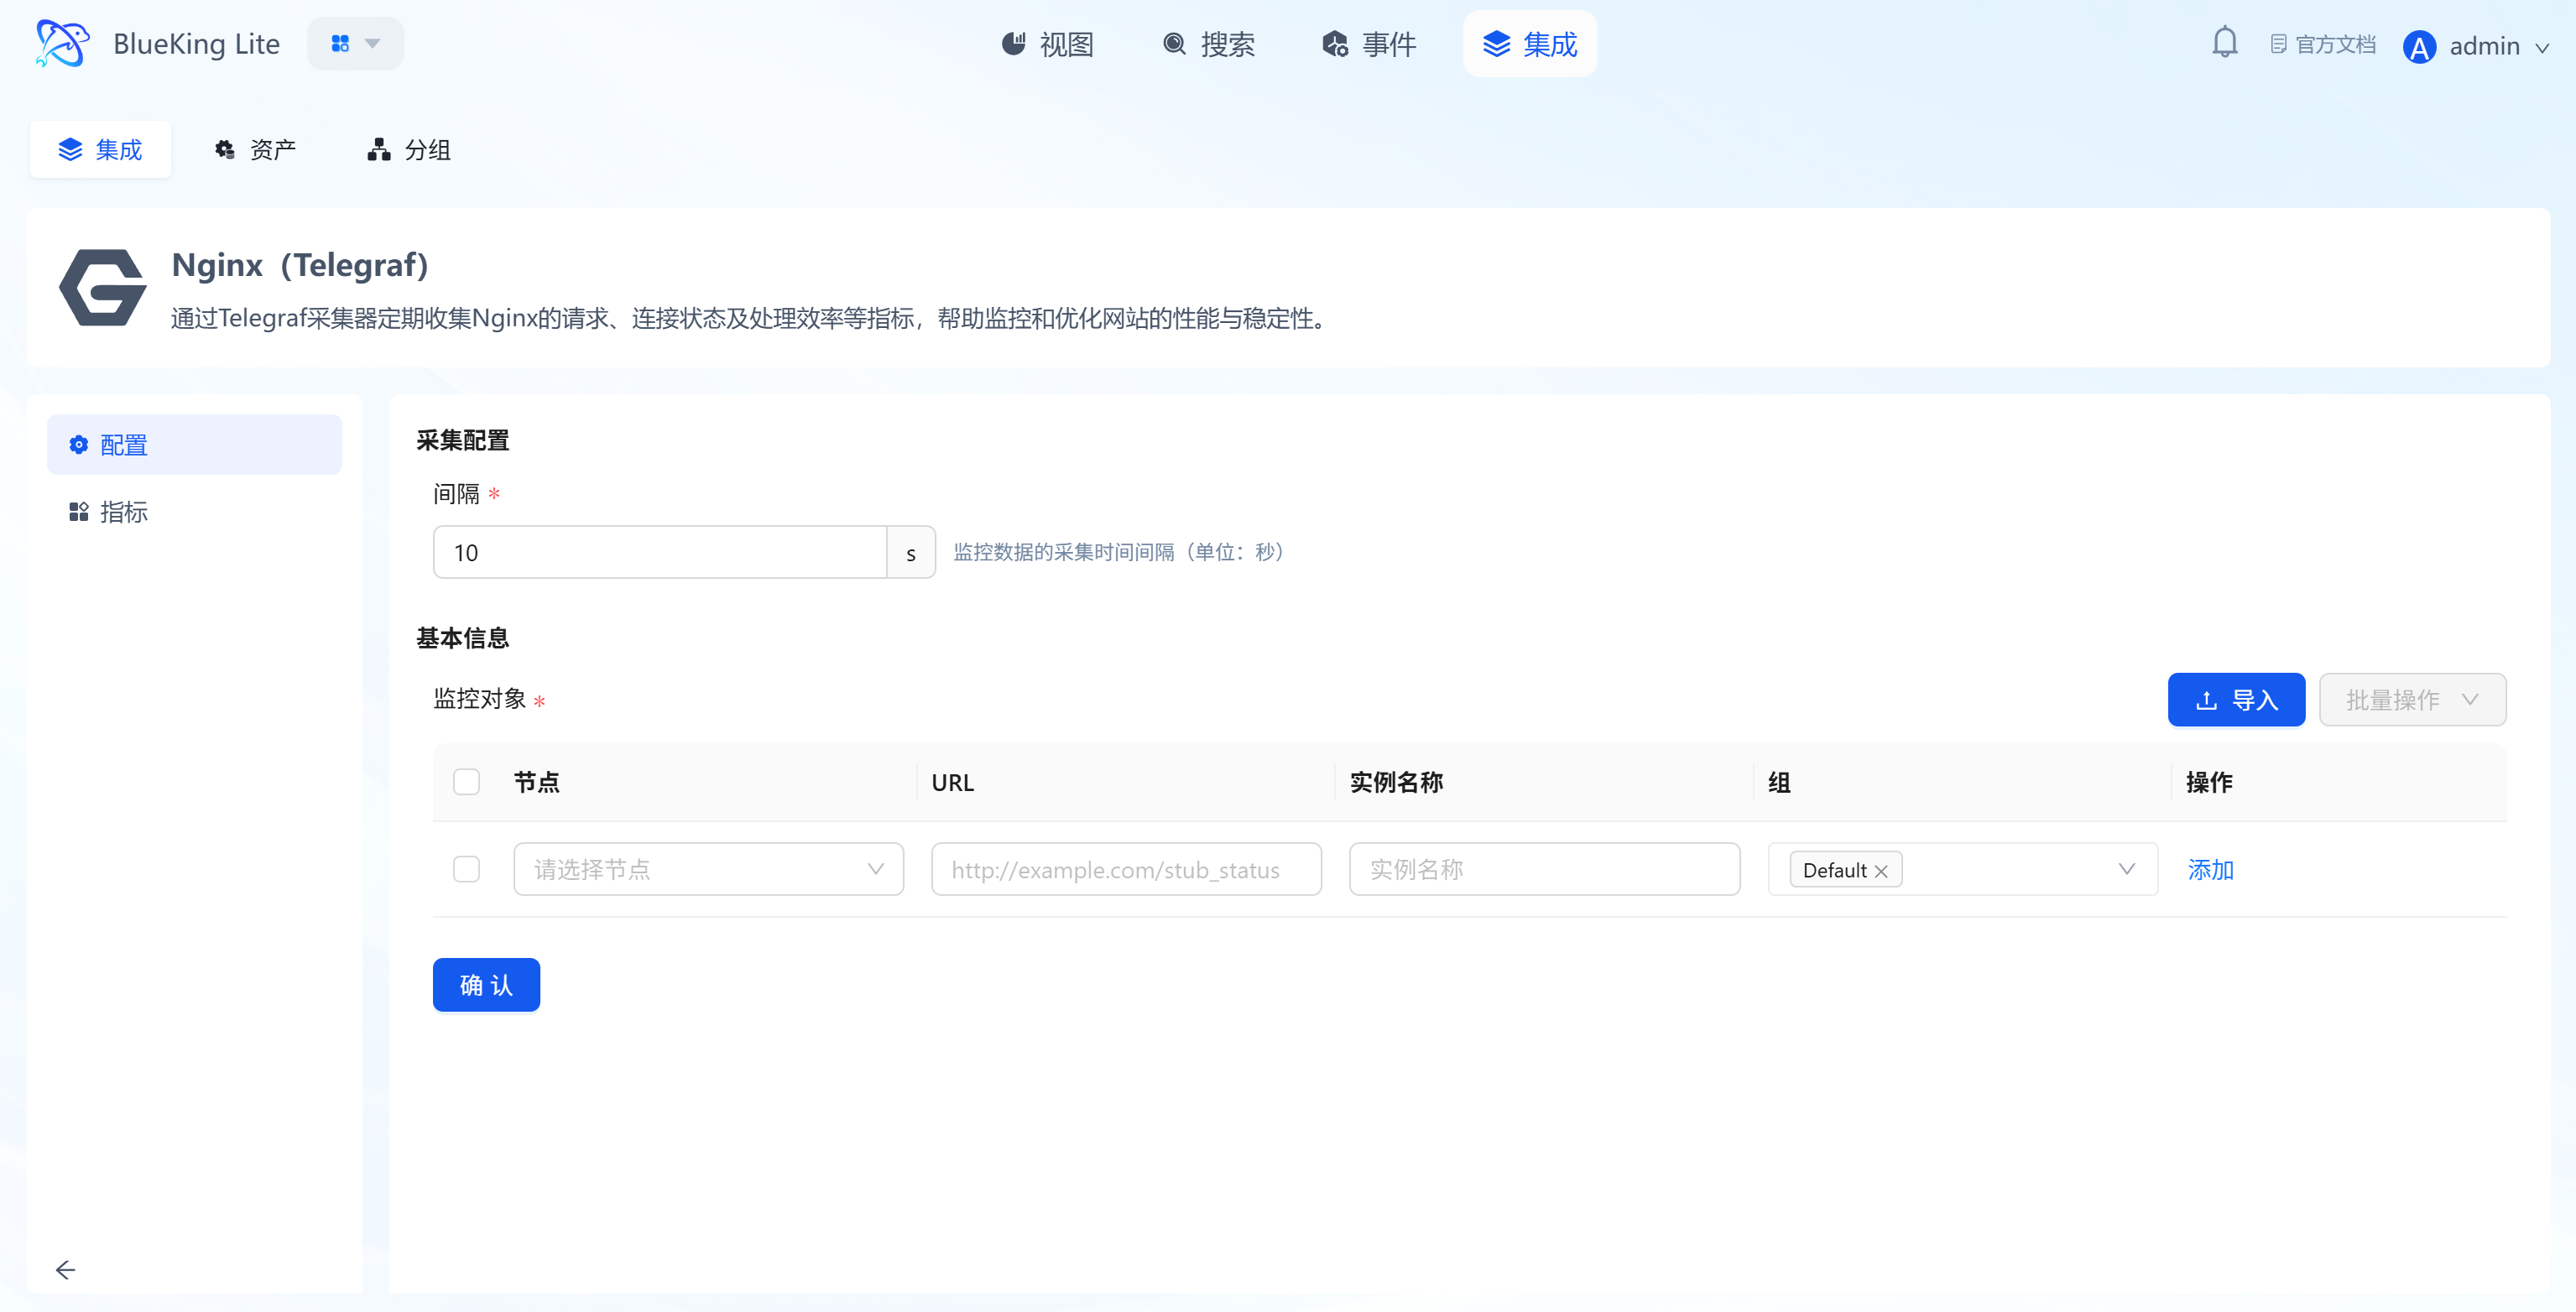
Step 2: Configure Collection Policy
In this step, you need to configure the Nginx status page address.
- Collection configuration:
- Interval: Default is
10s.
- Interval: Default is
- Configure monitoring targets:
- Node: Select a managed host as the collector (recommended to use the host where Nginx is running, or a machine on the same network segment that can access Nginx).
- URL: Enter the complete Nginx status page address.
- Example:
http://127.0.0.1:80/stub_statusorhttp://192.168.1.100:8080/nginx_status.
- Example:
- Instance name: It is recommended to name it "Nginx-BusinessName".
- Click "Confirm".
Screenshot Guide:
- Important note: The URL must be the path corresponding to the
stub_statusdirective in the Nginx configuration.
Step 3: Verify and Analyze
- Click the "View" module at the top of the page.
- In the left resource list, expand "Middleware" -> "Nginx", and click the instance name.
- Data verification:
- Active Connections: The number of currently active connections being processed, reflecting real-time concurrency pressure.
- Requests/s: Number of requests processed per second (RPS/QPS).
- Connection States: View the distribution of Reading (reading request headers), Writing (sending responses), and Waiting (Keep-Alive waiting) connections.
Integrating Apache
Connect to Apache HTTP Server's mod_status interface via the Telegraf plugin to collect metrics such as worker process count, traffic load, and request scoreboard.
Prerequisites
Before starting the integration, ensure that Apache has enabled the mod_status module and configured a status page, which is the foundation for data collection.
-
Confirm module support
- Check whether Apache has loaded the
mod_statusmodule (usually enabled by default). - Verification command:
apachectl -M | grep status_module - If the output contains
status_module, monitoring is supported.
- Check whether Apache has loaded the
-
Configure Apache status page
- Edit the Apache configuration file (such as
httpd.confor/etc/apache2/mods-enabled/status.conf). - Configuration example with extended information enabled:
# Enable extended status information (recommended); otherwise, traffic (Total kBytes) and CPU load information cannot be collected
ExtendedStatus On

<Location "/server-status">
    SetHandler server-status
    # Security control: Only allow access from localhost and the collector machine IP
    Require ip 127.0.0.1
    Require ip <Telegraf_collector_IP>
</Location> - After configuration, run
apachectl -k gracefulor restart the service.
- Edit the Apache configuration file (such as
-
Verify interface availability
- Important note: Telegraf must read the machine-readable format, so the
?autoparameter is required during verification. - Test command:
curl "http://<ApacheIP>:<port>/server-status?auto" - Success criteria: Returns plain text information similar to
Total Accesses: ...andScoreboard: ....
- Important note: Telegraf must read the machine-readable format, so the
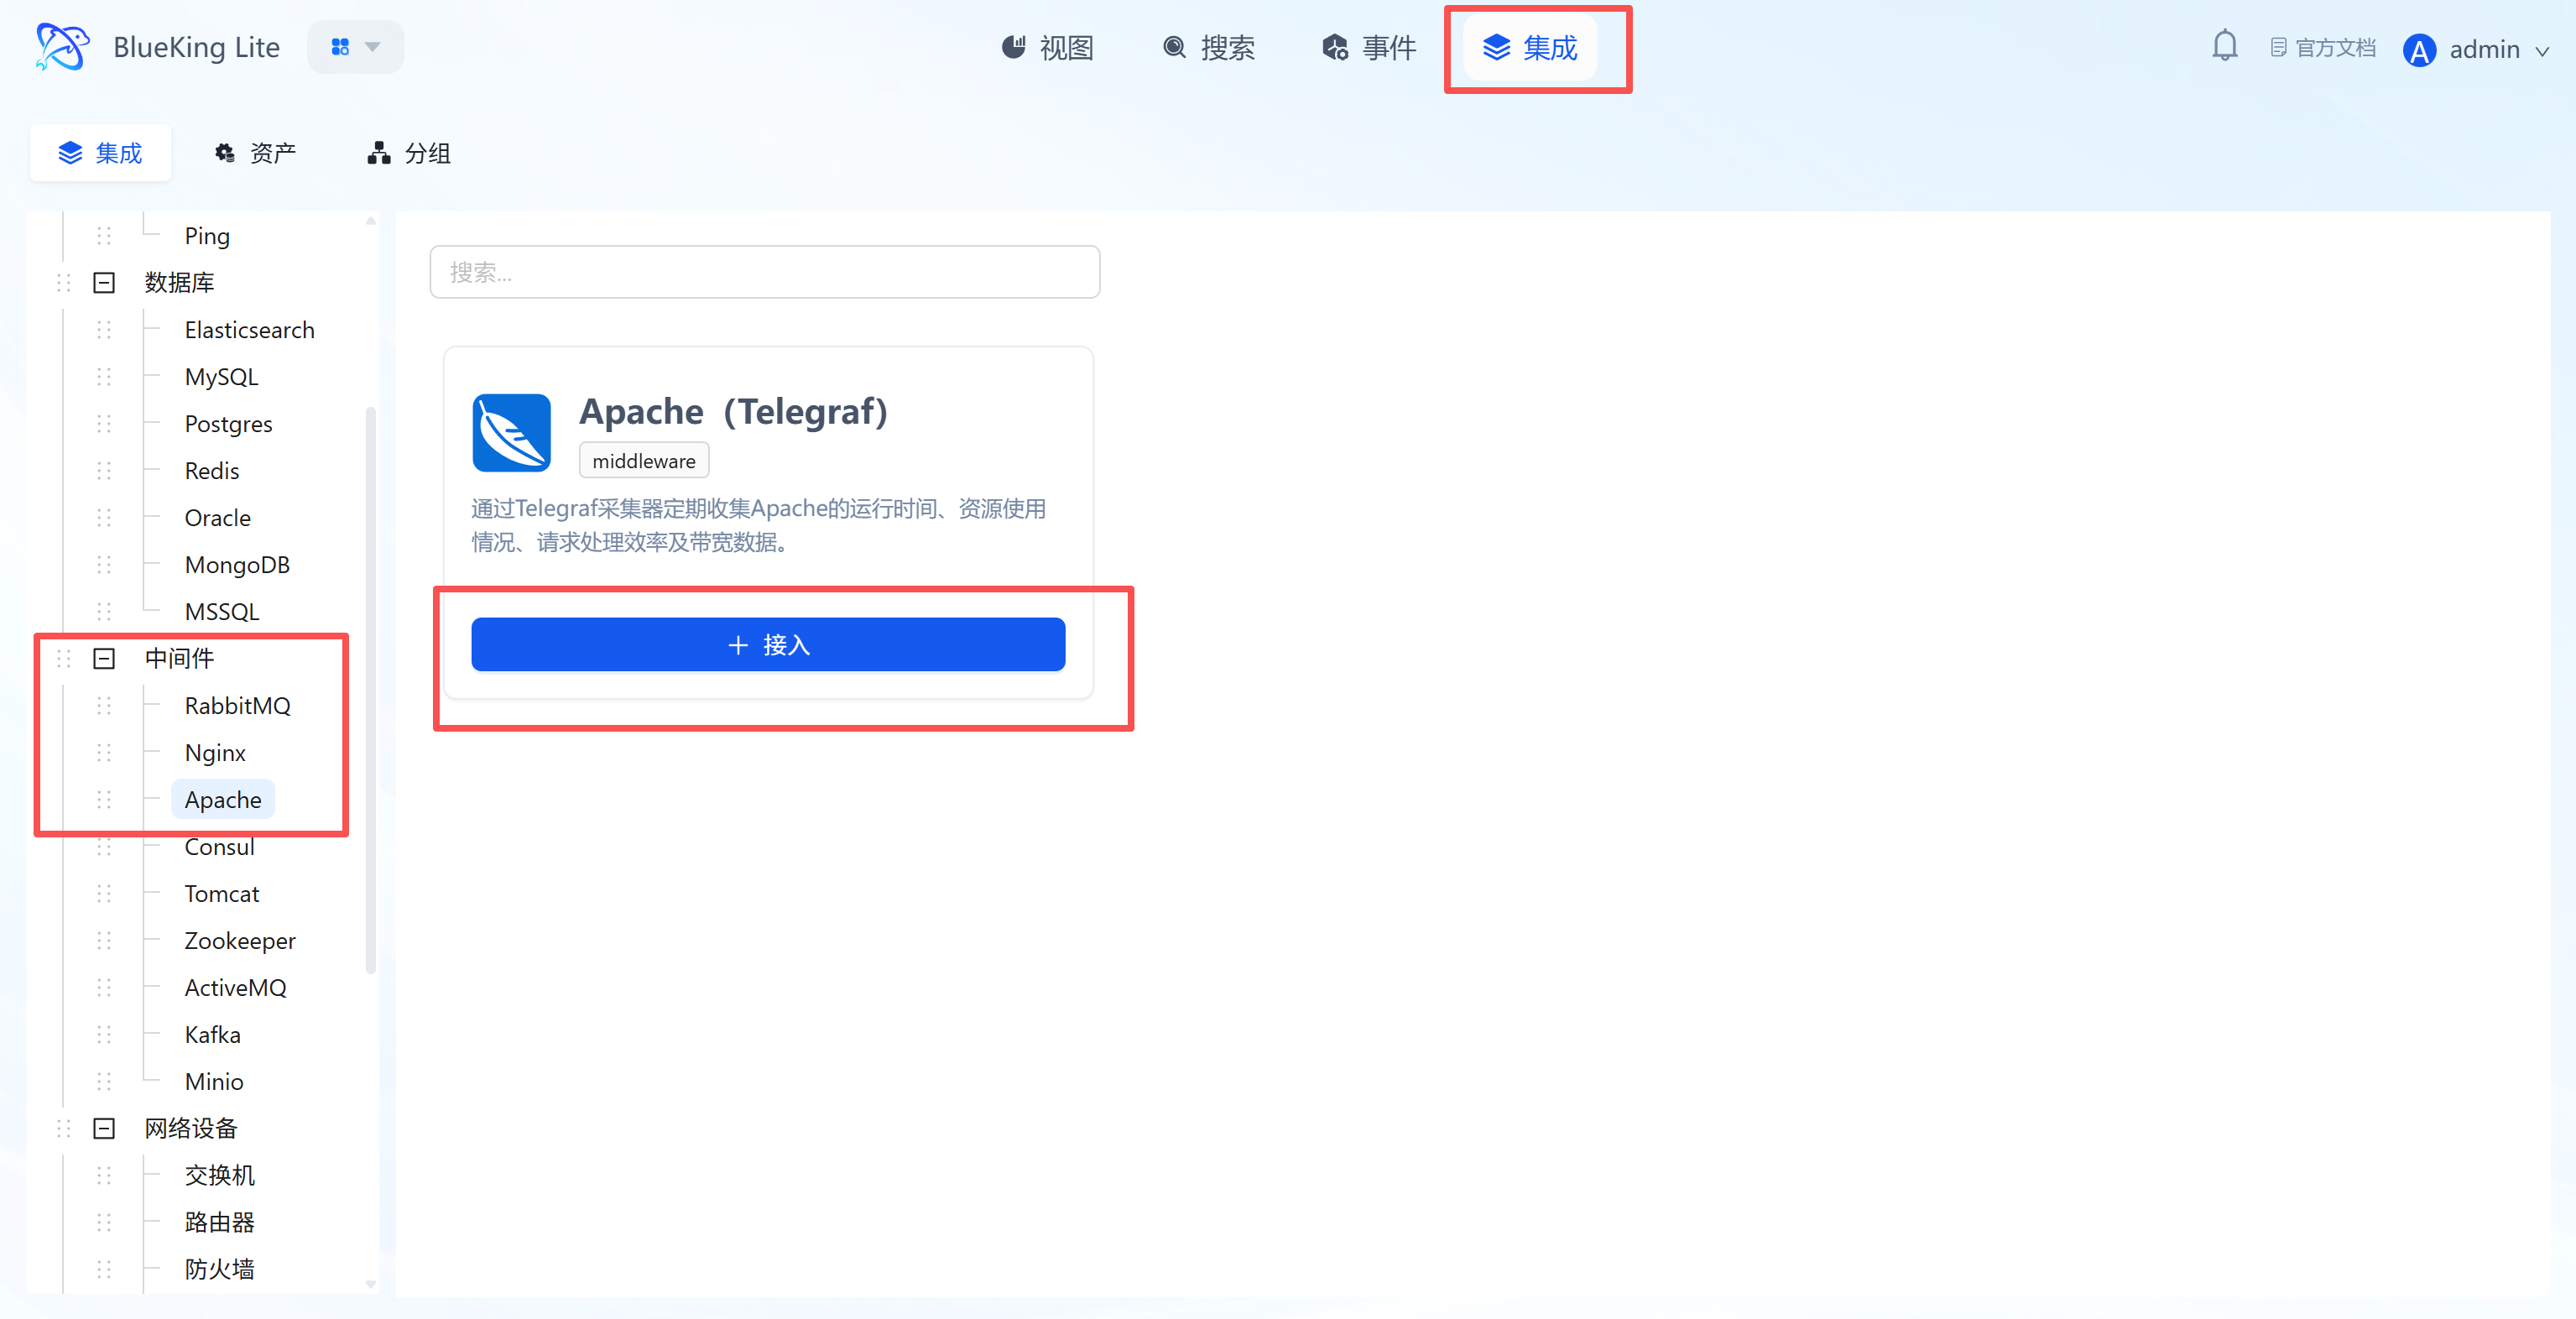
Step 1: Select an Integration Plugin
- After entering Monitor, click "Integration" in the top navigation bar.
- Select resource type:
- Expand the "Middleware" category in the left menu.
- Click "Apache".
- Click "+ Integrate" at the top right of the list.
Screenshot Guide:
- Plugin description: Obtains real-time web server health by parsing the status page provided by Apache.
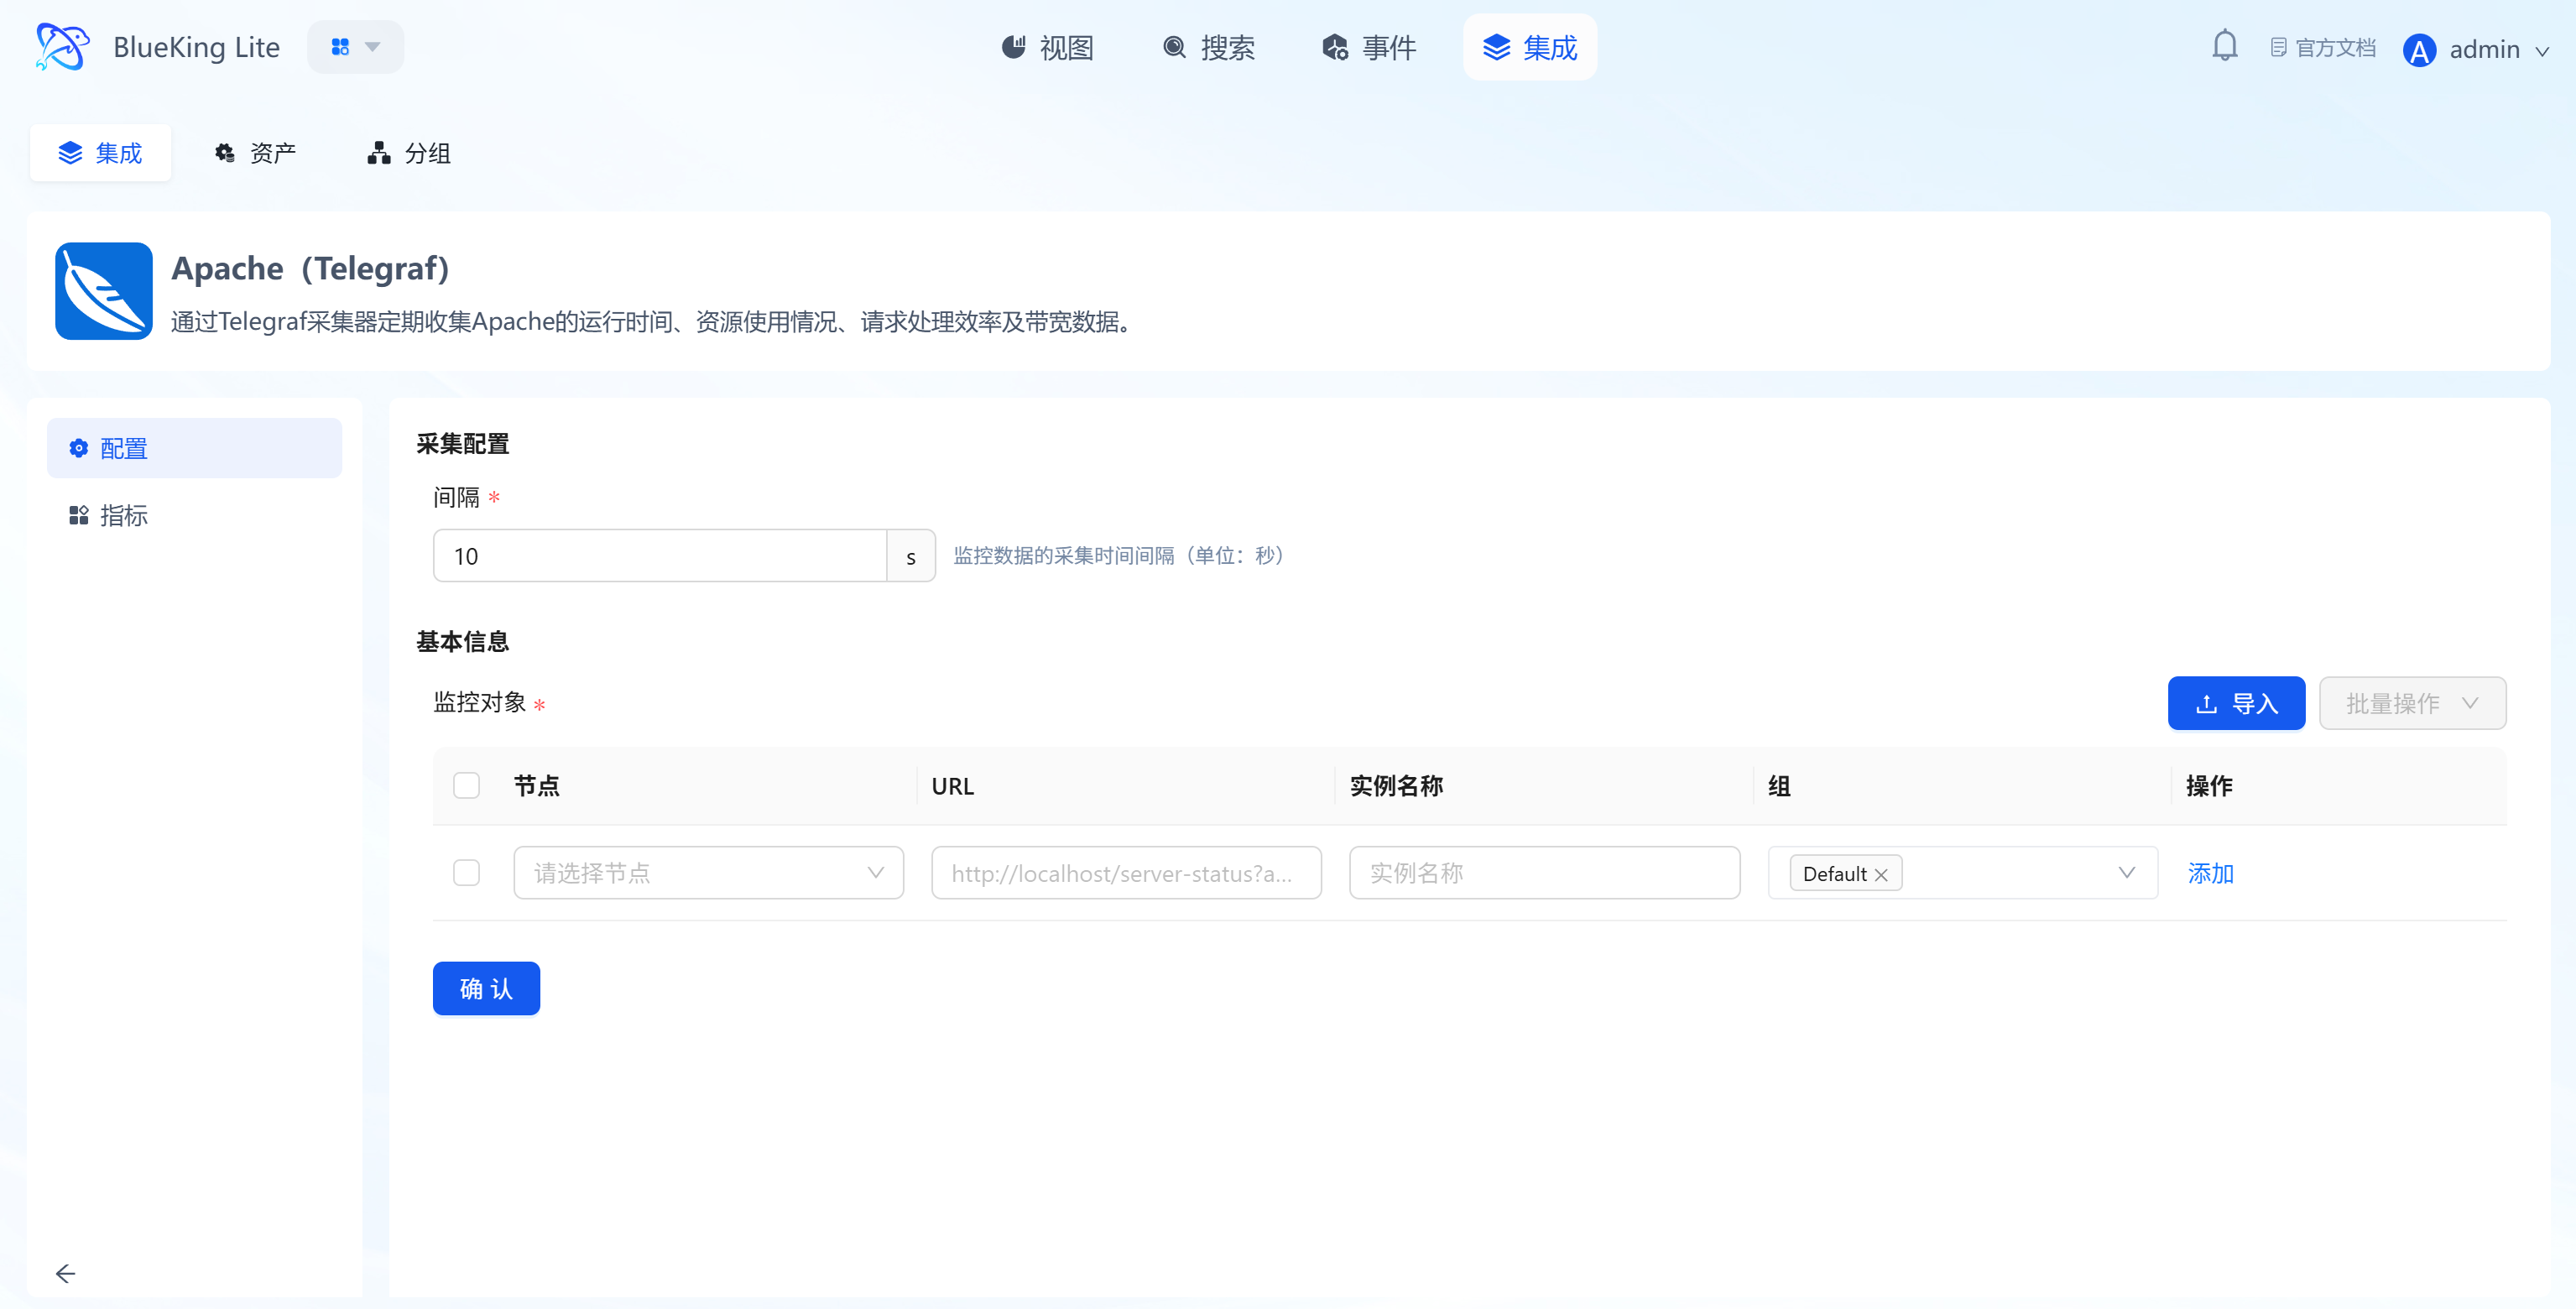
Step 2: Configure Collection Policy
In this step, you need to configure the Apache status page address.
- Collection configuration:
- Interval: Default is
10s.
- Interval: Default is
- Configure monitoring targets:
- Node: Select a managed host as the collector (recommended to use the host where Apache is running).
- URL: Enter the complete Apache status page address.
- Example:
http://localhost/server-status?autoorhttp://192.168.1.100:80/server-status?auto. - Note: The
?autoparameter must be included for the plugin to parse the machine-readable format.
- Example:
- Instance name: It is recommended to name it "Apache-BusinessName".
- Click "Confirm".
Screenshot Guide:
- URL note: The input field placeholder already indicates
?auto— this is a critical parameter, do not omit it.
Step 3: Verify and Analyze
- Click the "View" module at the top of the page.
- In the left resource list, expand "Middleware" -> "Apache", and click the instance name.
- Data verification:
- Workers: View Busy (processing requests) and Idle worker process counts.
- Total Accesses: View cumulative total access count.
- Scoreboard: View connection state distribution (such as Open, Waiting, Sending, KeepAlive).
Integrating Consul
Connect to the Consul HTTP API via the Telegraf plugin to collect key metrics such as service health status, check results, and cluster member status.
Prerequisites
Before starting the integration, ensure the Consul Agent's API interface is accessible. If the cluster has ACL authentication enabled, you also need to prepare the corresponding Token.
-
Confirm network connectivity
- Telegraf needs to access the Consul Agent's HTTP port (default
8500). - Verification command (execute on the collection machine):
# Check if the target Consul IP is reachable
curl -I http://<ConsulIP>:8500/v1/status/leader - Success criteria: Returns
HTTP/1.1 200 OK.
- Telegraf needs to access the Consul Agent's HTTP port (default
-
Configure access permissions (only required when ACL is enabled)
- If your Consul cluster has not enabled ACL (default), you can skip this step.
- If ACL is enabled, please create a Token with read-only permissions for monitoring use.
- Minimum privilege Policy example:
# Allow reading node status, service information, and Agent self-information
node_prefix "" { policy = "read" }
service_prefix "" { policy = "read" }
agent_prefix "" { policy = "read" } - Note: The obtained Token needs to be filled in the
tokenfield of the Telegraf configuration file or used as a Bearer Token.
-
Verify interface data
- It is recommended to manually request the API once to ensure data returns are normal.
- Test commands:
# Without ACL
curl http://<ConsulIP>:8500/v1/agent/self

# With ACL (replace xxxxx with your Token)
curl -H "X-Consul-Token: xxxxx" http://<ConsulIP>:8500/v1/agent/self - Success criteria: Returns JSON data containing
MemberandConfiginformation.
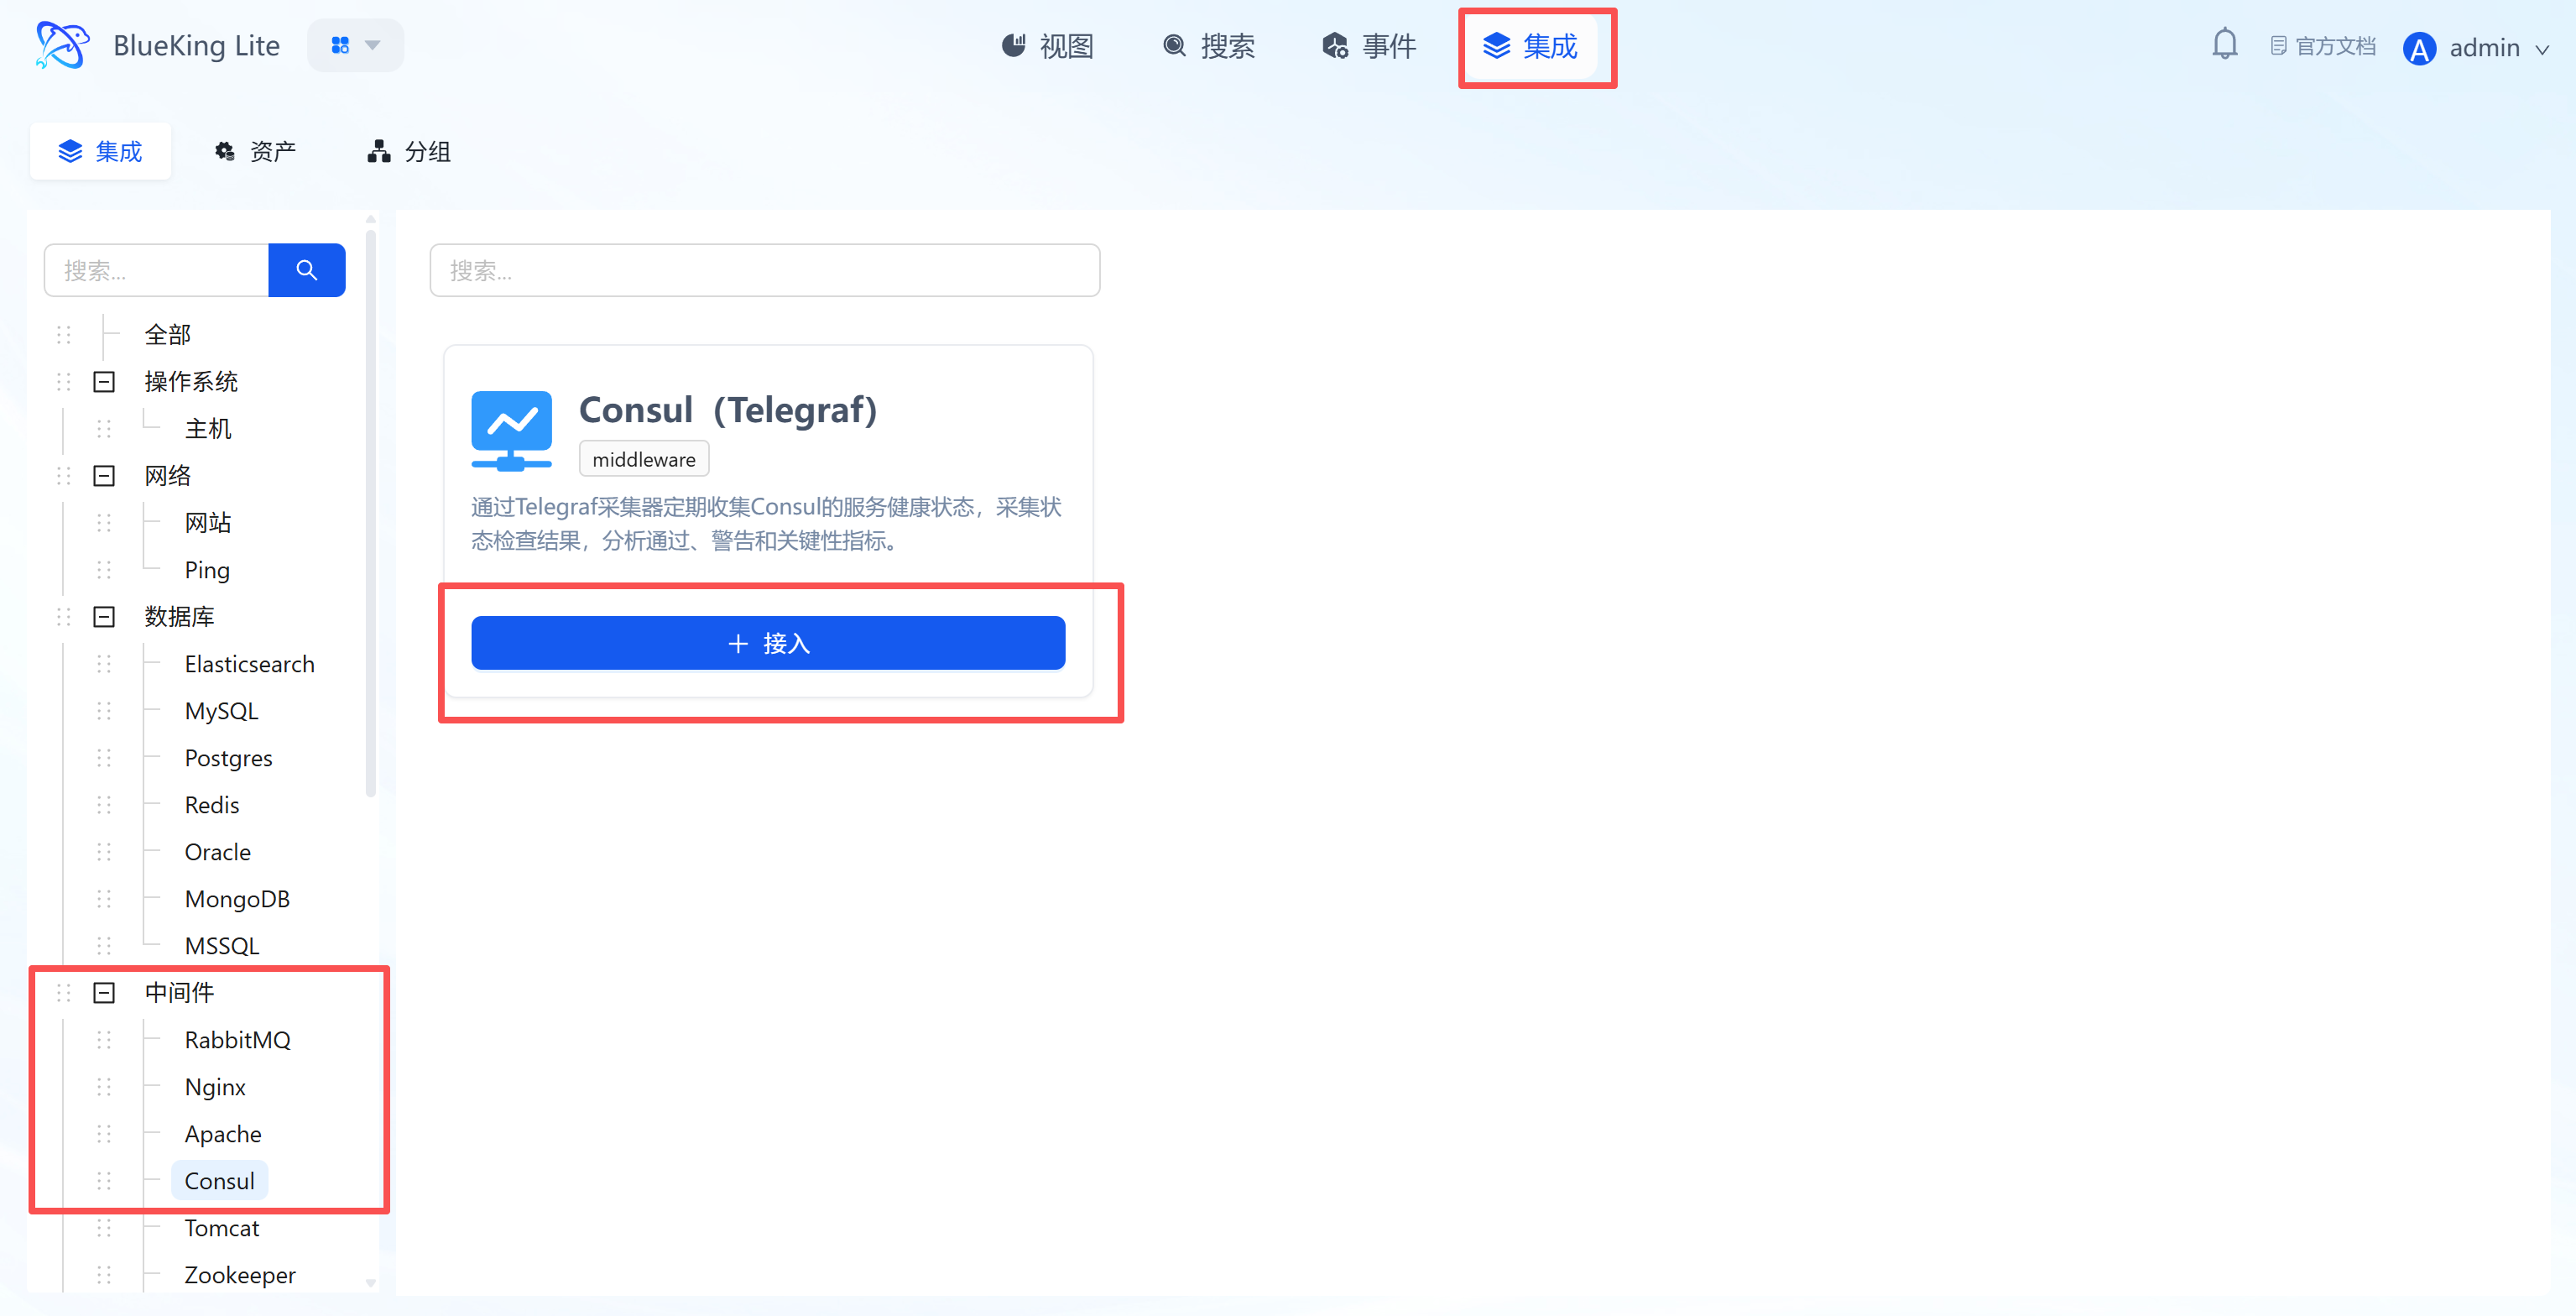
Step 1: Select an Integration Plugin
- After entering Monitor, click "Integration" in the top navigation bar.
- Select resource type:
- Expand the "Middleware" category in the left menu.
- Click "Consul".
- Click "+ Integrate" at the top right of the list.
Screenshot Guide:
- Plugin description: Remotely retrieves cluster health data through Consul's HTTP API without installing an Agent on the Consul Server.
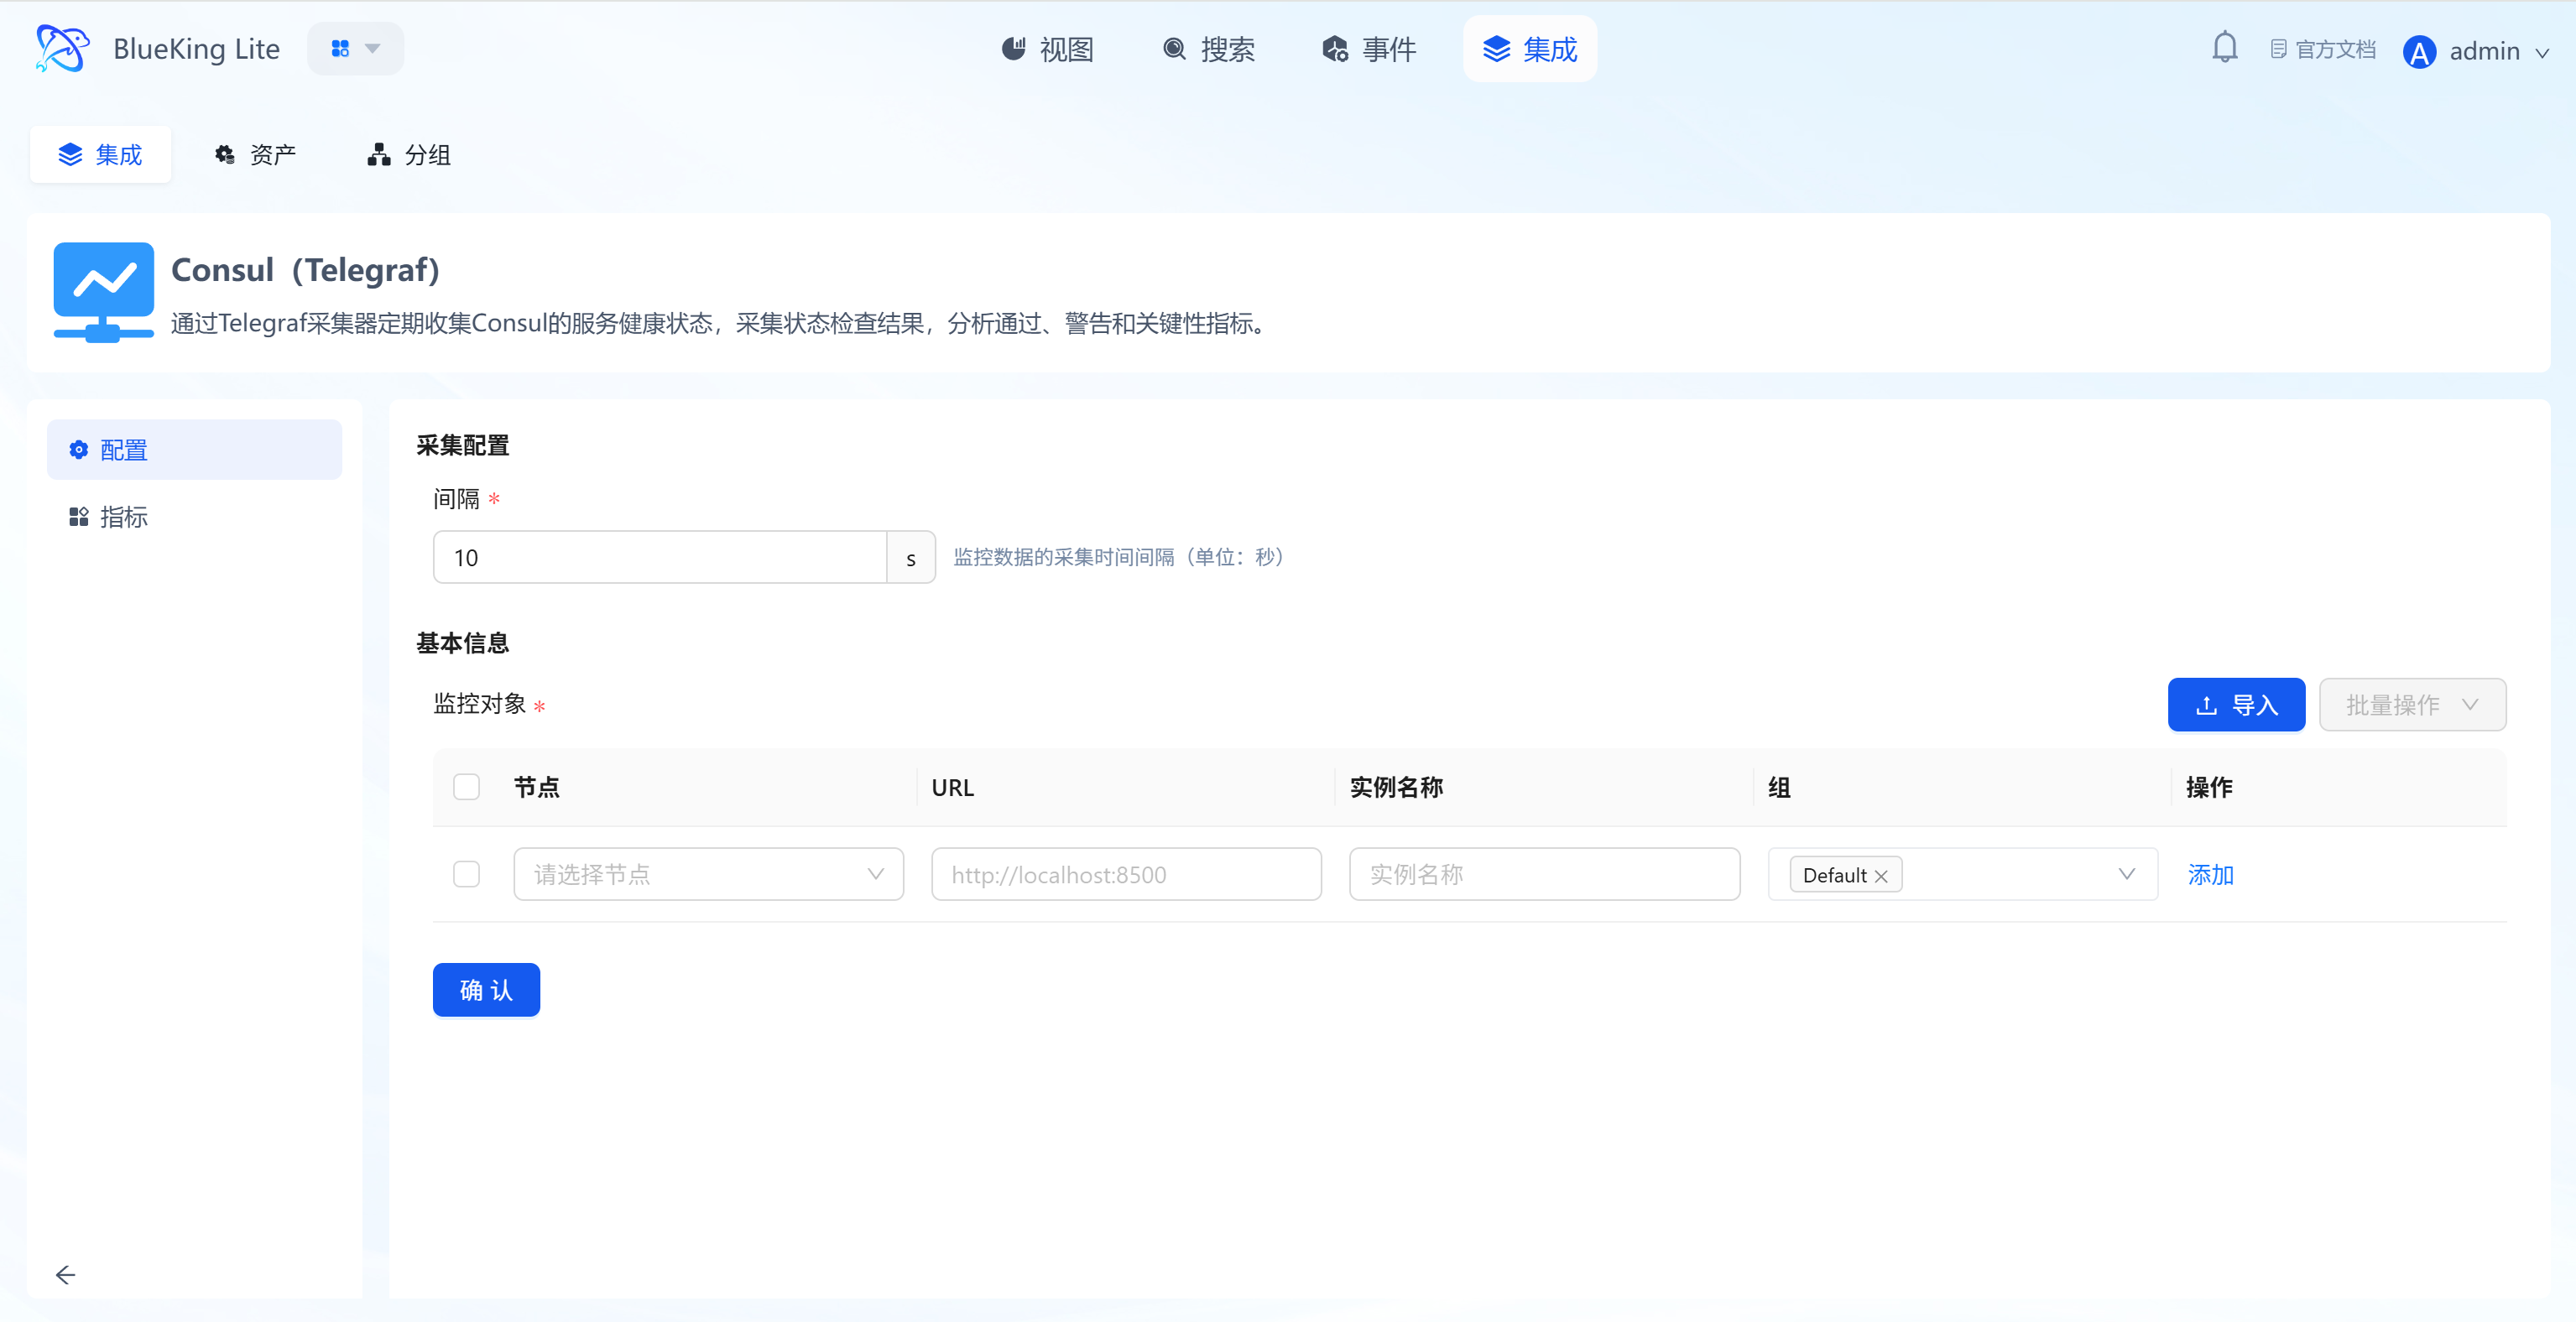
Step 2: Configure Collection Policy
In this step, you need to configure the Consul Agent's API address.
- Collection configuration:
- Interval: Default is
10s, indicating the data collection frequency.
- Interval: Default is
- Configure monitoring targets:
- Node: Select a managed host as the collector (recommended to use a machine on the same network segment that can access the Consul Agent).
- URL: Enter the Consul Agent's HTTP API address.
- Format:
http://IP:8500(8500 is Consul's default HTTP port).
- Format:
- Instance name: It is recommended to name it "Consul-ClusterName".
- Click "Confirm".
Screenshot Guide:
- Collection target: This URL should point to any Consul Agent (either Client or Server mode). The plugin will retrieve information about the entire cluster through this Agent.
Step 3: Verify and Analyze
- Click the "View" module at the top of the page.
- In the left resource list, expand "Middleware" -> "Consul", and click the instance name.
- Data verification:
- Health Checks: Monitor the count of
passing(healthy),warning, andcriticalhealth checks to quickly assess overall service availability. - Serf LAN Members: View the number of members in the LAN Gossip pool. If the count decreases, it may indicate that Agent nodes have gone offline.
- Catalog Services: Monitor the total number of services registered in the catalog.
- Raft Peers: For Server nodes, monitor the number of Raft cluster peers to ensure the Leader election mechanism is functioning properly.
- Health Checks: Monitor the count of
Integrating Tomcat
Connect to the Tomcat Manager application via the Telegraf plugin to collect key metrics such as thread pool status, request processing, session management, and JVM memory.
Prerequisites
Before starting the integration, ensure that Tomcat has enabled the manager application and that a usable management account is available.
-
Confirm Manager application exists
- Check whether Tomcat has the Manager application deployed (usually included by default in the distribution).
-
Prepare monitoring account
- Option A (Recommended): Use an existing management account
- If you already have an account with
manager-guiormanager-scriptprivileges (such asweops), you can use it directly without creating a new one.
- If you already have an account with
- Option B (Optional): Create a minimum privilege account
- Note: This operation requires logging into the Tomcat server to modify configuration files and cannot be done remotely.
- Edit
conf/tomcat-users.xmland add a user with only themanager-scriptrole to implement minimum privilege control.
- Option A (Recommended): Use an existing management account
-
Verify interface availability
- Important note: Tomcat returns HTML pages by default. Telegraf must read XML format, so the
?XML=trueparameter is required during verification. - Test command (execute on the collection machine):
# Replace with your actual account credentials
curl -u weops:Weops@123 "http://10.10.90.115:30880/manager/status?XML=true" - Success criteria: Returns data starting with
<?xml ... ?><status>....
- Important note: Tomcat returns HTML pages by default. Telegraf must read XML format, so the
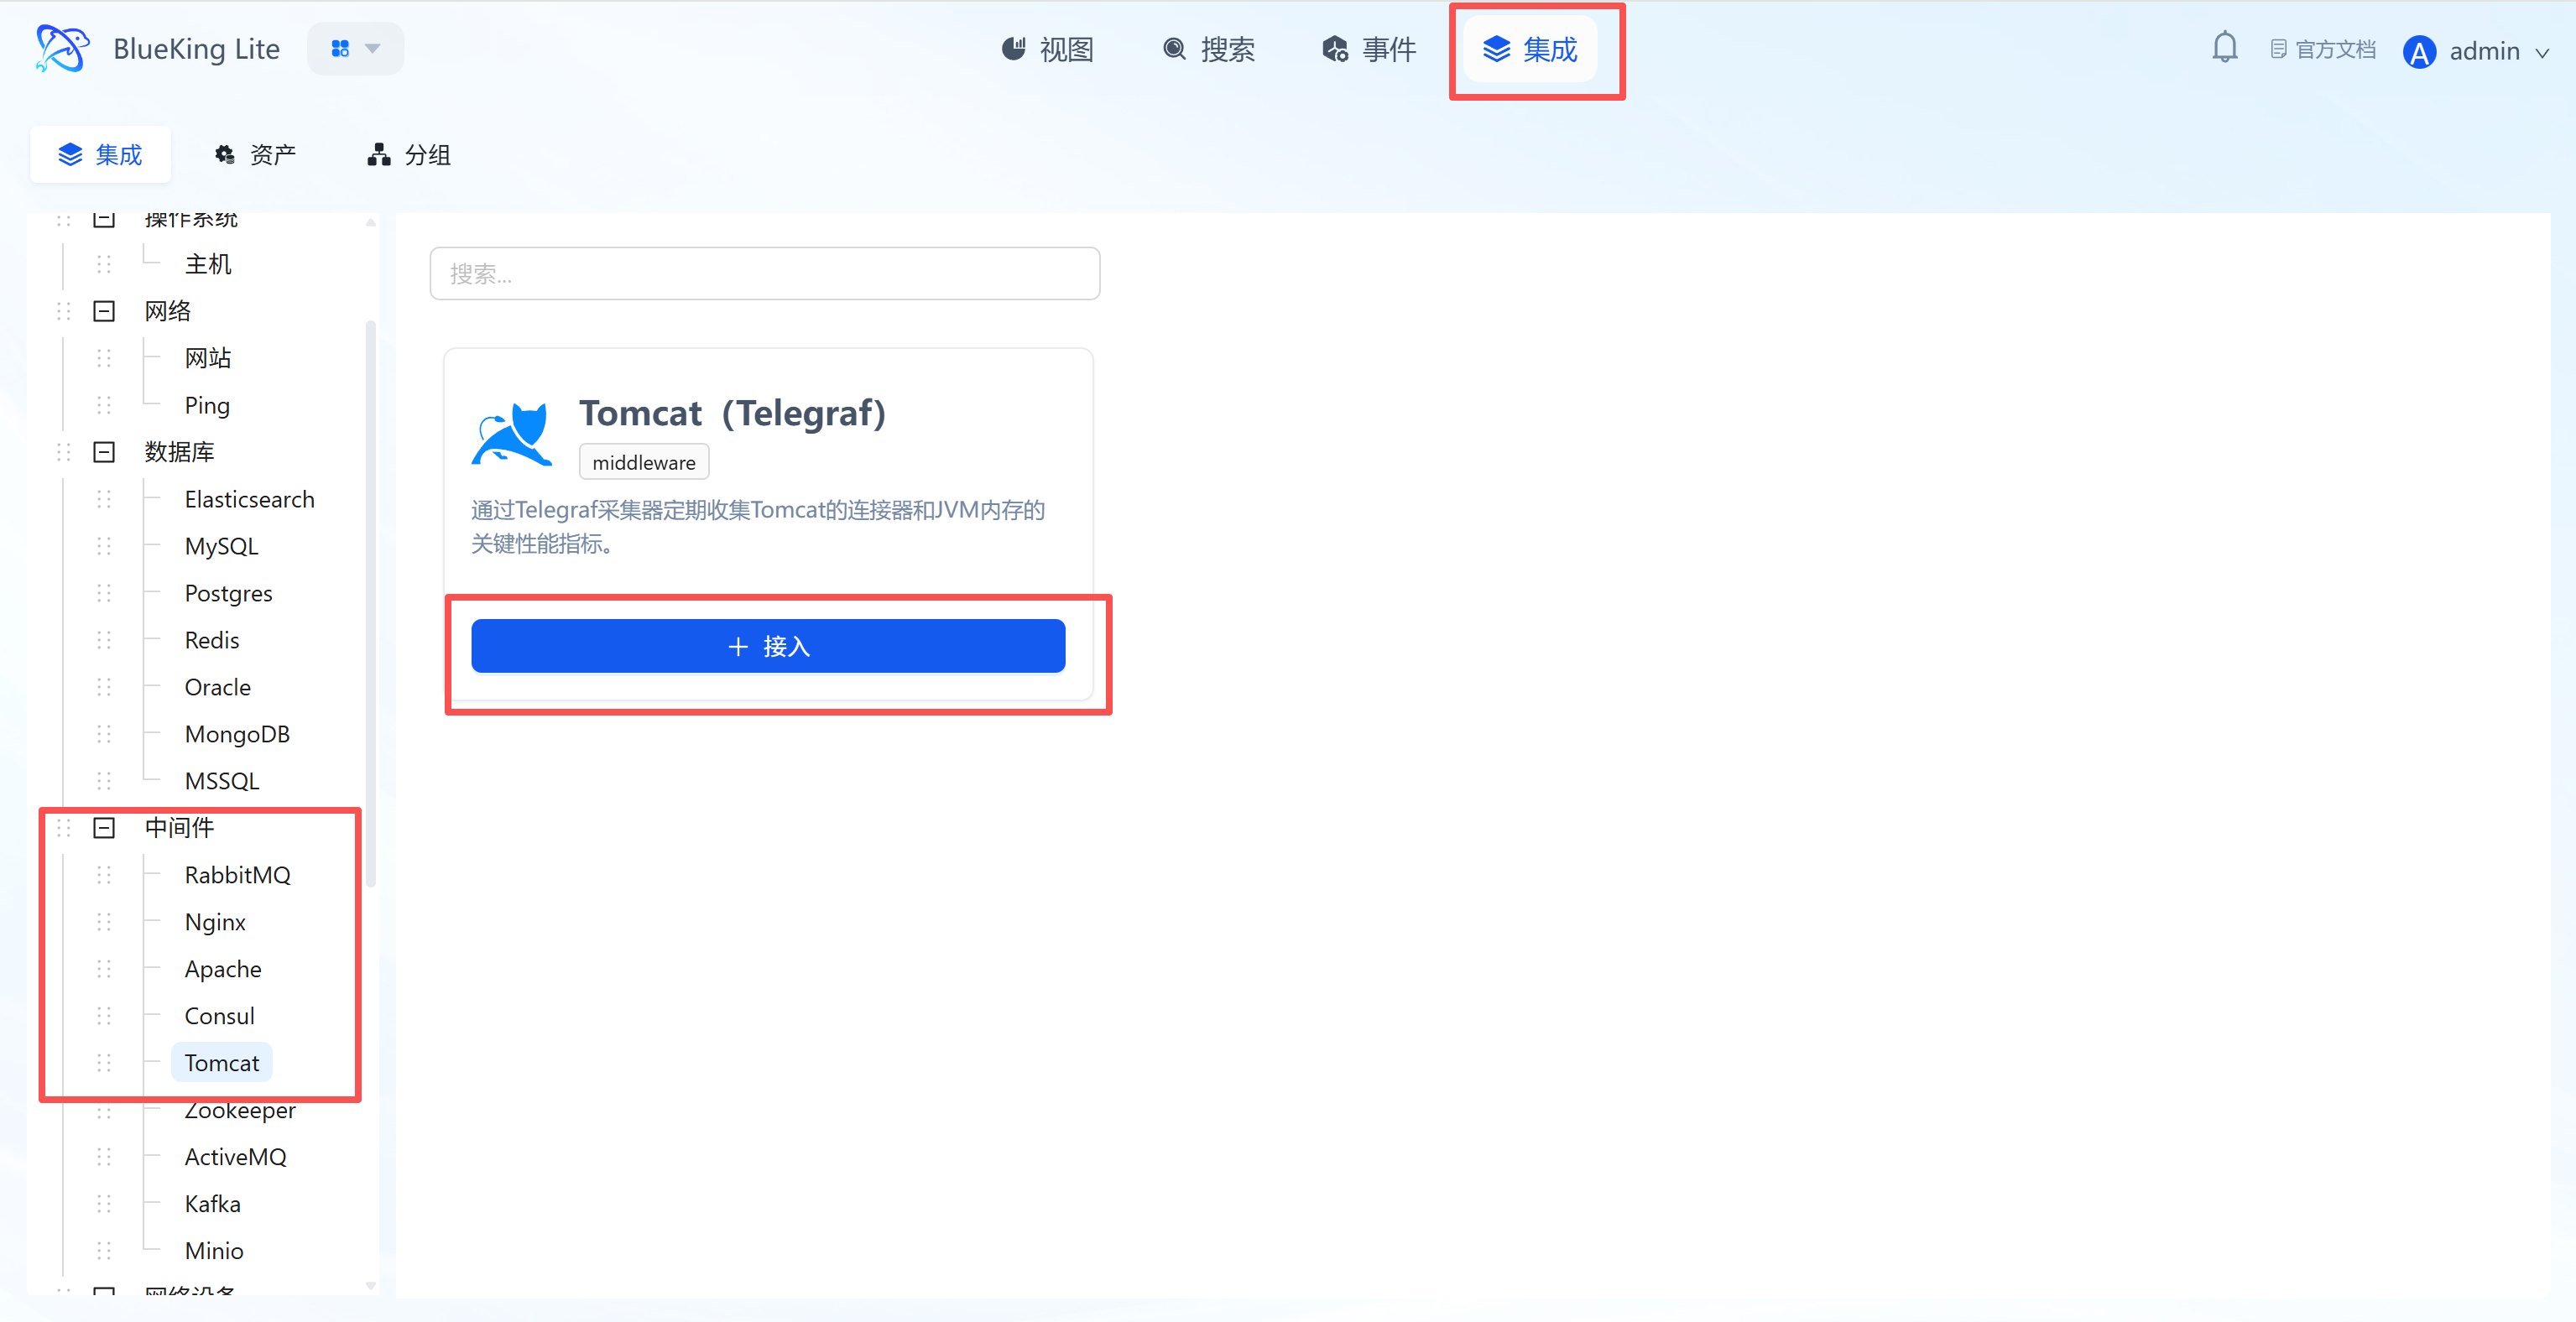
Step 1: Select an Integration Plugin
- After entering Monitor, click "Integration" in the top navigation bar.
- Select resource type:
- Expand the "Middleware" category in the left menu.
- Click "Tomcat".
- Click "+ Integrate" at the top right of the list.
Screenshot Guide:
- Plugin description: Collects data using the status interface provided by the Tomcat built-in Manager application. Requires the
managerwebapp to be pre-deployed.
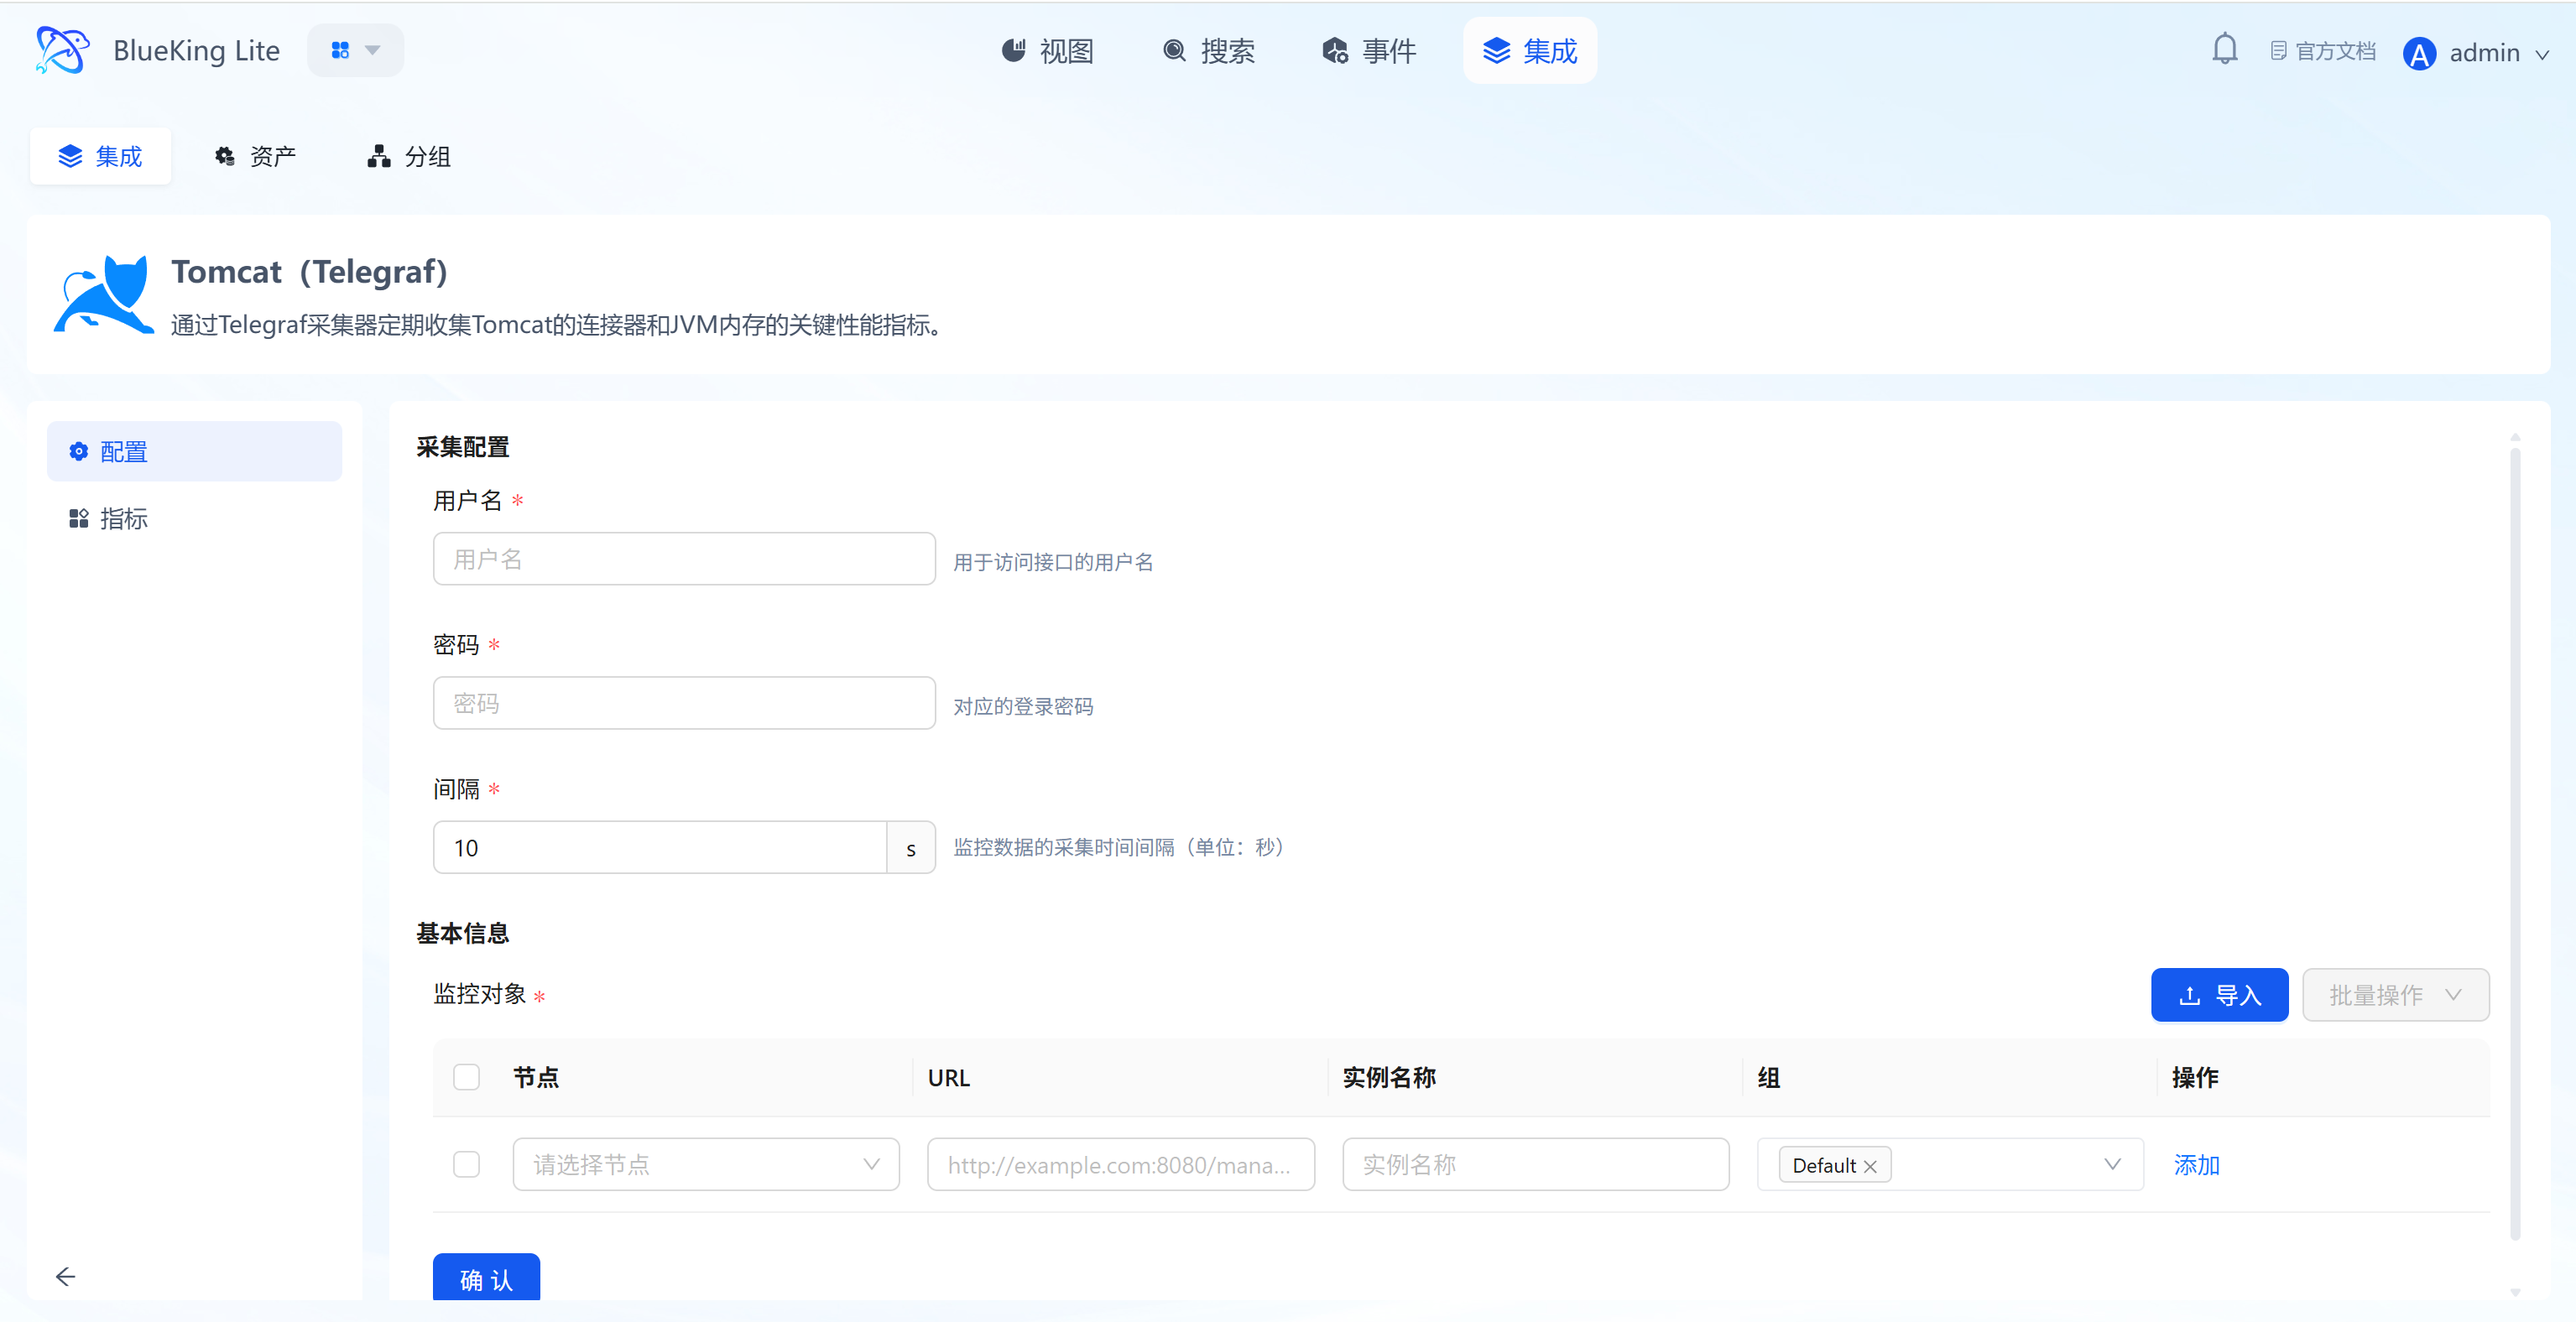
Step 2: Configure Collection Policy
In this step, you need to configure the Tomcat Manager access credentials and status page address.
- Collection configuration (authentication information):
- Username: Enter the username configured in
tomcat-users.xmlwith themanager-statusormanager-jmxrole. - Password: Enter the corresponding password.
- Interval: Default is
10s.
- Username: Enter the username configured in
- Configure monitoring targets:
- Node: Select a managed host as the collector (recommended to use a machine on the same network segment that can access the Tomcat port).
- URL: Enter the complete Tomcat Manager status page address.
- Format:
http://IP:PORT/manager/status/all?XML=true - Note: The path must be
/manager/status/alland include the?XML=trueparameter.
- Format:
- Instance name: It is recommended to name it "Tomcat-BusinessName".
- Click "Confirm".
Screenshot Guide:
- Prerequisite: Ensure the
managerapplication has been deployed for Tomcat and user roles are correctly configured; otherwise, the collector will fail to authenticate.
Step 3: Verify and Analyze
- Click the "View" module at the top of the page.
- In the left resource list, expand "Middleware" -> "Tomcat", and click the instance name.
- Data verification:
- Threads Busy: Monitor the current number of busy threads, reflecting Tomcat's real-time processing pressure. A high value may indicate processing capacity has reached a bottleneck.
- Request Count / Processing Time: View total request count and average processing time to assess application performance.
- Active Sessions: Monitor the current number of active sessions, useful for evaluating online user count.
- JVM Memory: View heap memory (Heap) and non-heap memory (Non-Heap) usage — key indicators for troubleshooting memory leaks and capacity planning.
Integrating Zookeeper
Connect to the Zookeeper service via the Telegraf collector to collect core metrics such as average latency, outstanding requests, node status, and Znode count.
Prerequisites
Before starting the integration, be sure to confirm Zookeeper's service port and command permissions.
-
Confirm service port
- Zookeeper's default client port is
2181. - Warning: If your environment uses Docker mapping or custom configurations (e.g., modified
clientPortinzoo.cfg), the port may be32181,12181, etc. - Lookup method: Run
netstat -nutlp | grep javaon the Zookeeper server to check the actual listening port.
- Zookeeper's default client port is
-
Verify interface availability
- To ensure smooth collection, test using the actual port from the collection machine.
- Test command:
# Replace <port> with your actual port number (e.g., 2181 or 32181)
echo mntr | nc <ZookeeperIP> <port> - Success criteria: Returns multi-line text data including
zk_version,zk_avg_latency, etc.
-
Confirm command support
- If the test command returns an
is not executed...error, it means your Zookeeper version (typically 3.5+) has disabled monitoring commands by default. Add4lw.commands.whitelist=mntrtozoo.cfgand restart the service.
- If the test command returns an
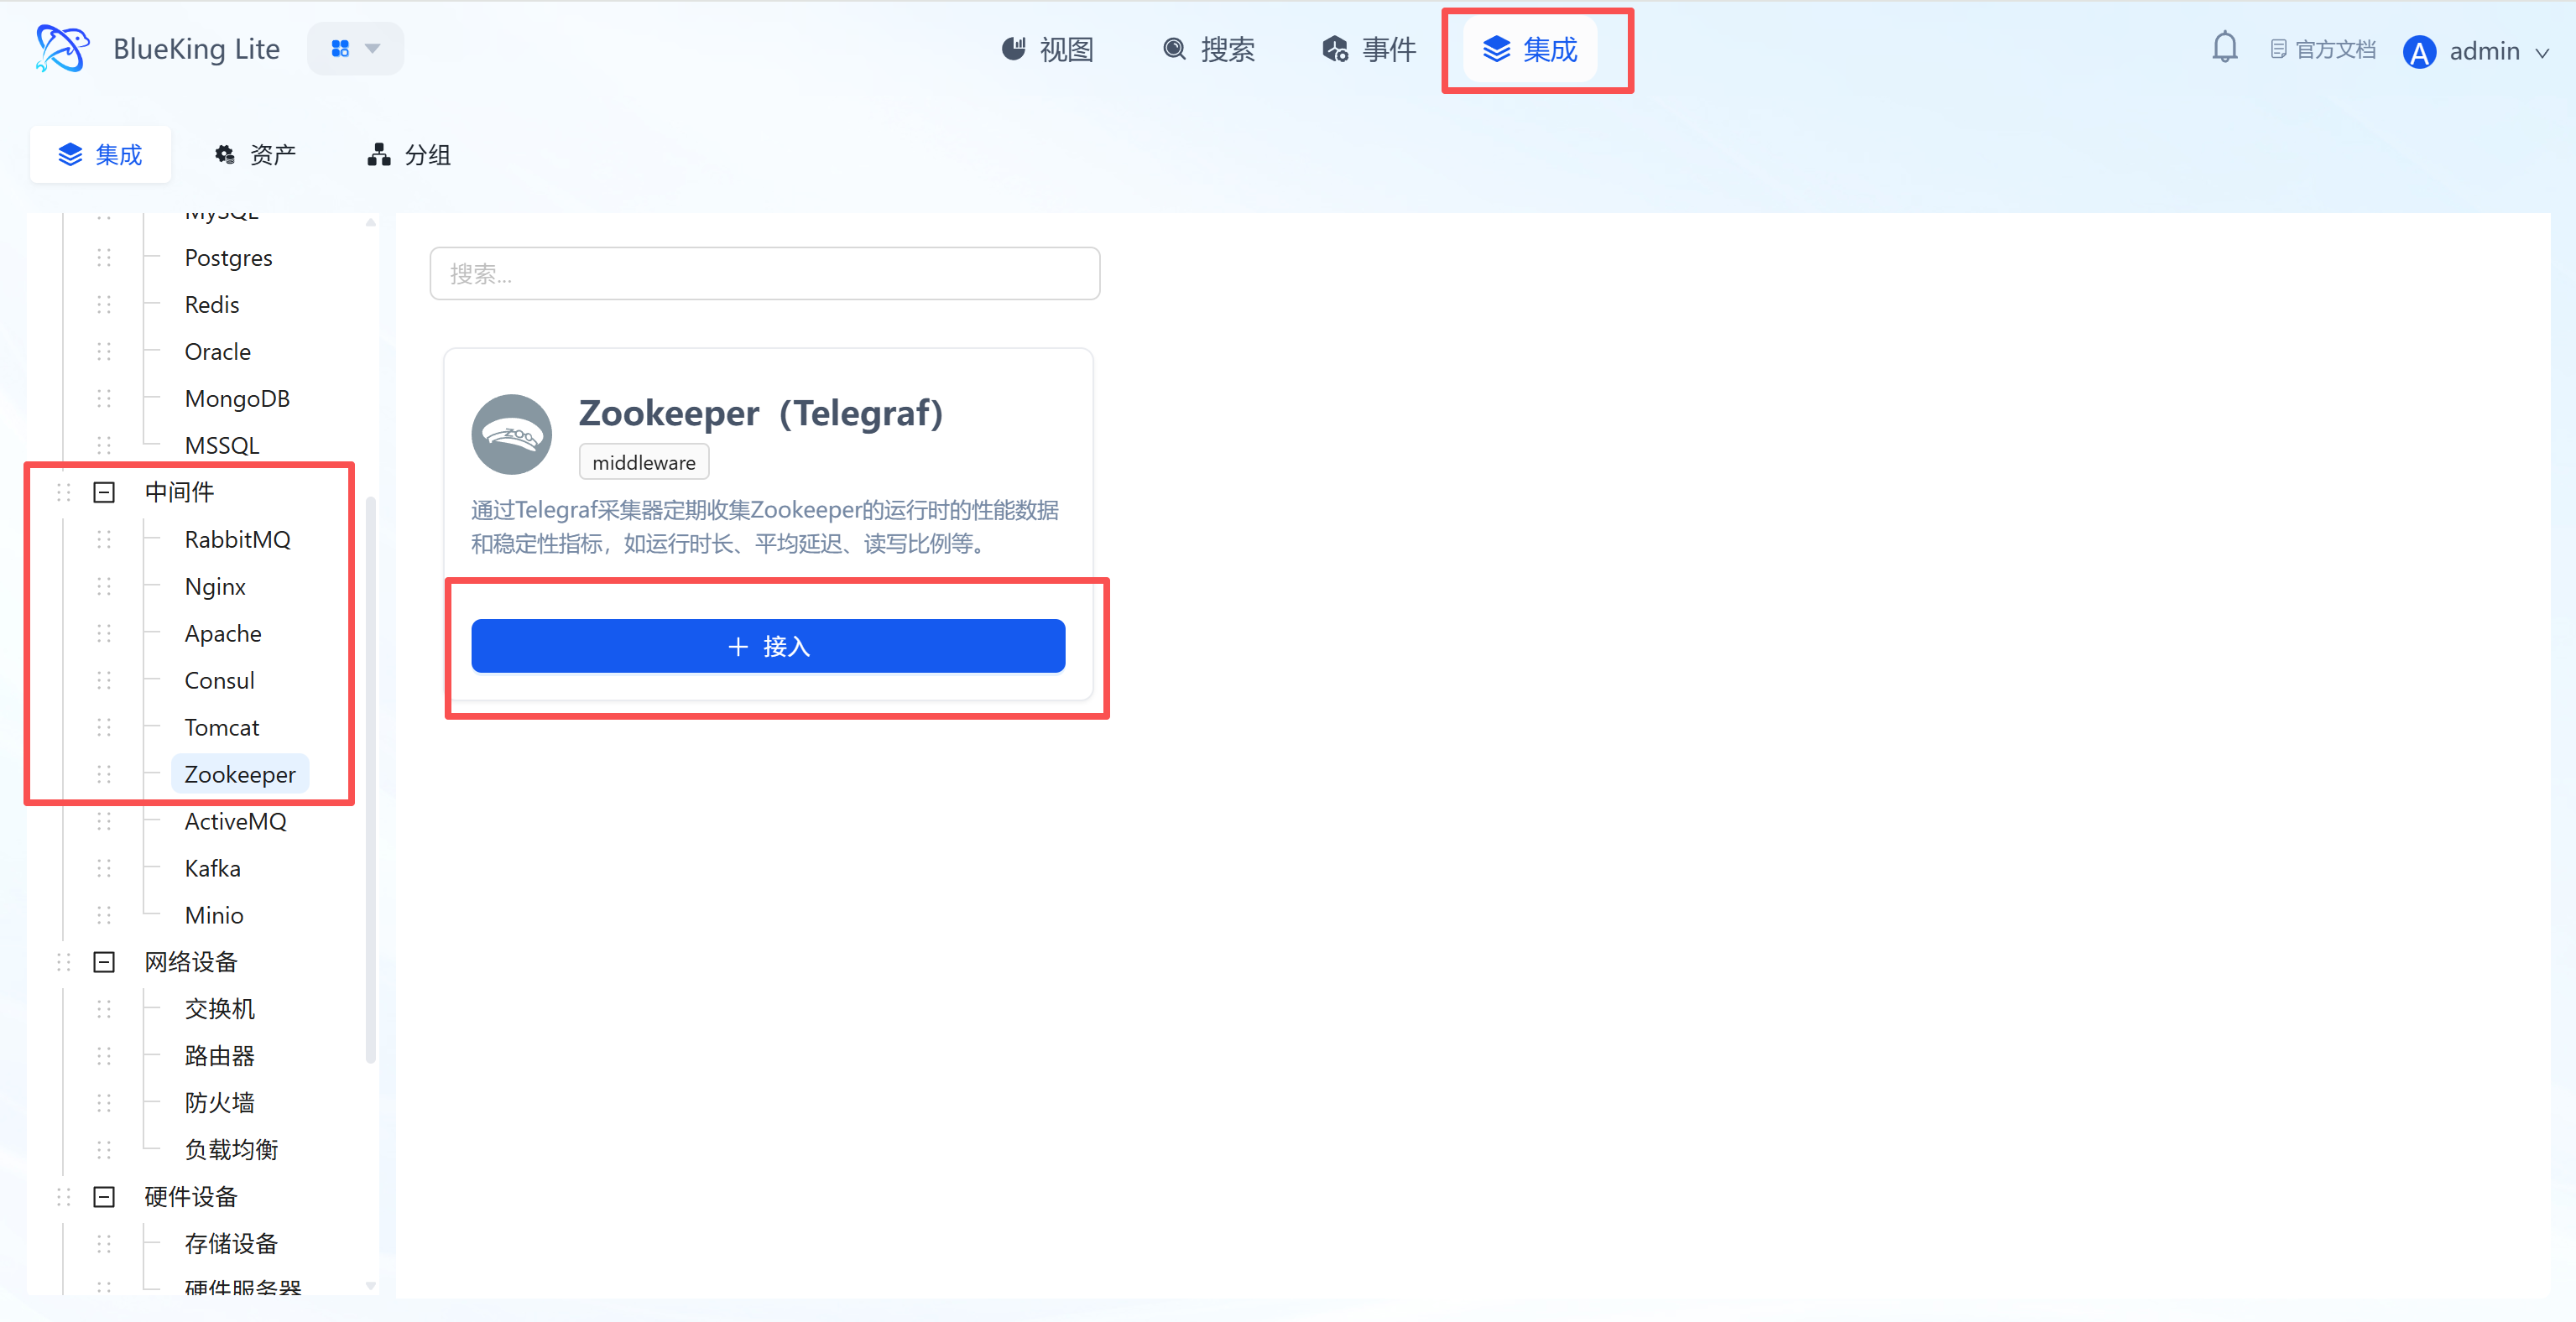
Step 1: Select an Integration Plugin
- After entering Monitor, click "Integration" in the top navigation bar.
- Select resource type:
- Expand the "Middleware" category in the left menu.
- Click "Zookeeper".
- Click "+ Integrate" at the top right of the list.
Screenshot Guide:
- Plugin description: Retrieves service status through Zookeeper's "Four Letter Words" commands without installing any Agent on the Zookeeper server.
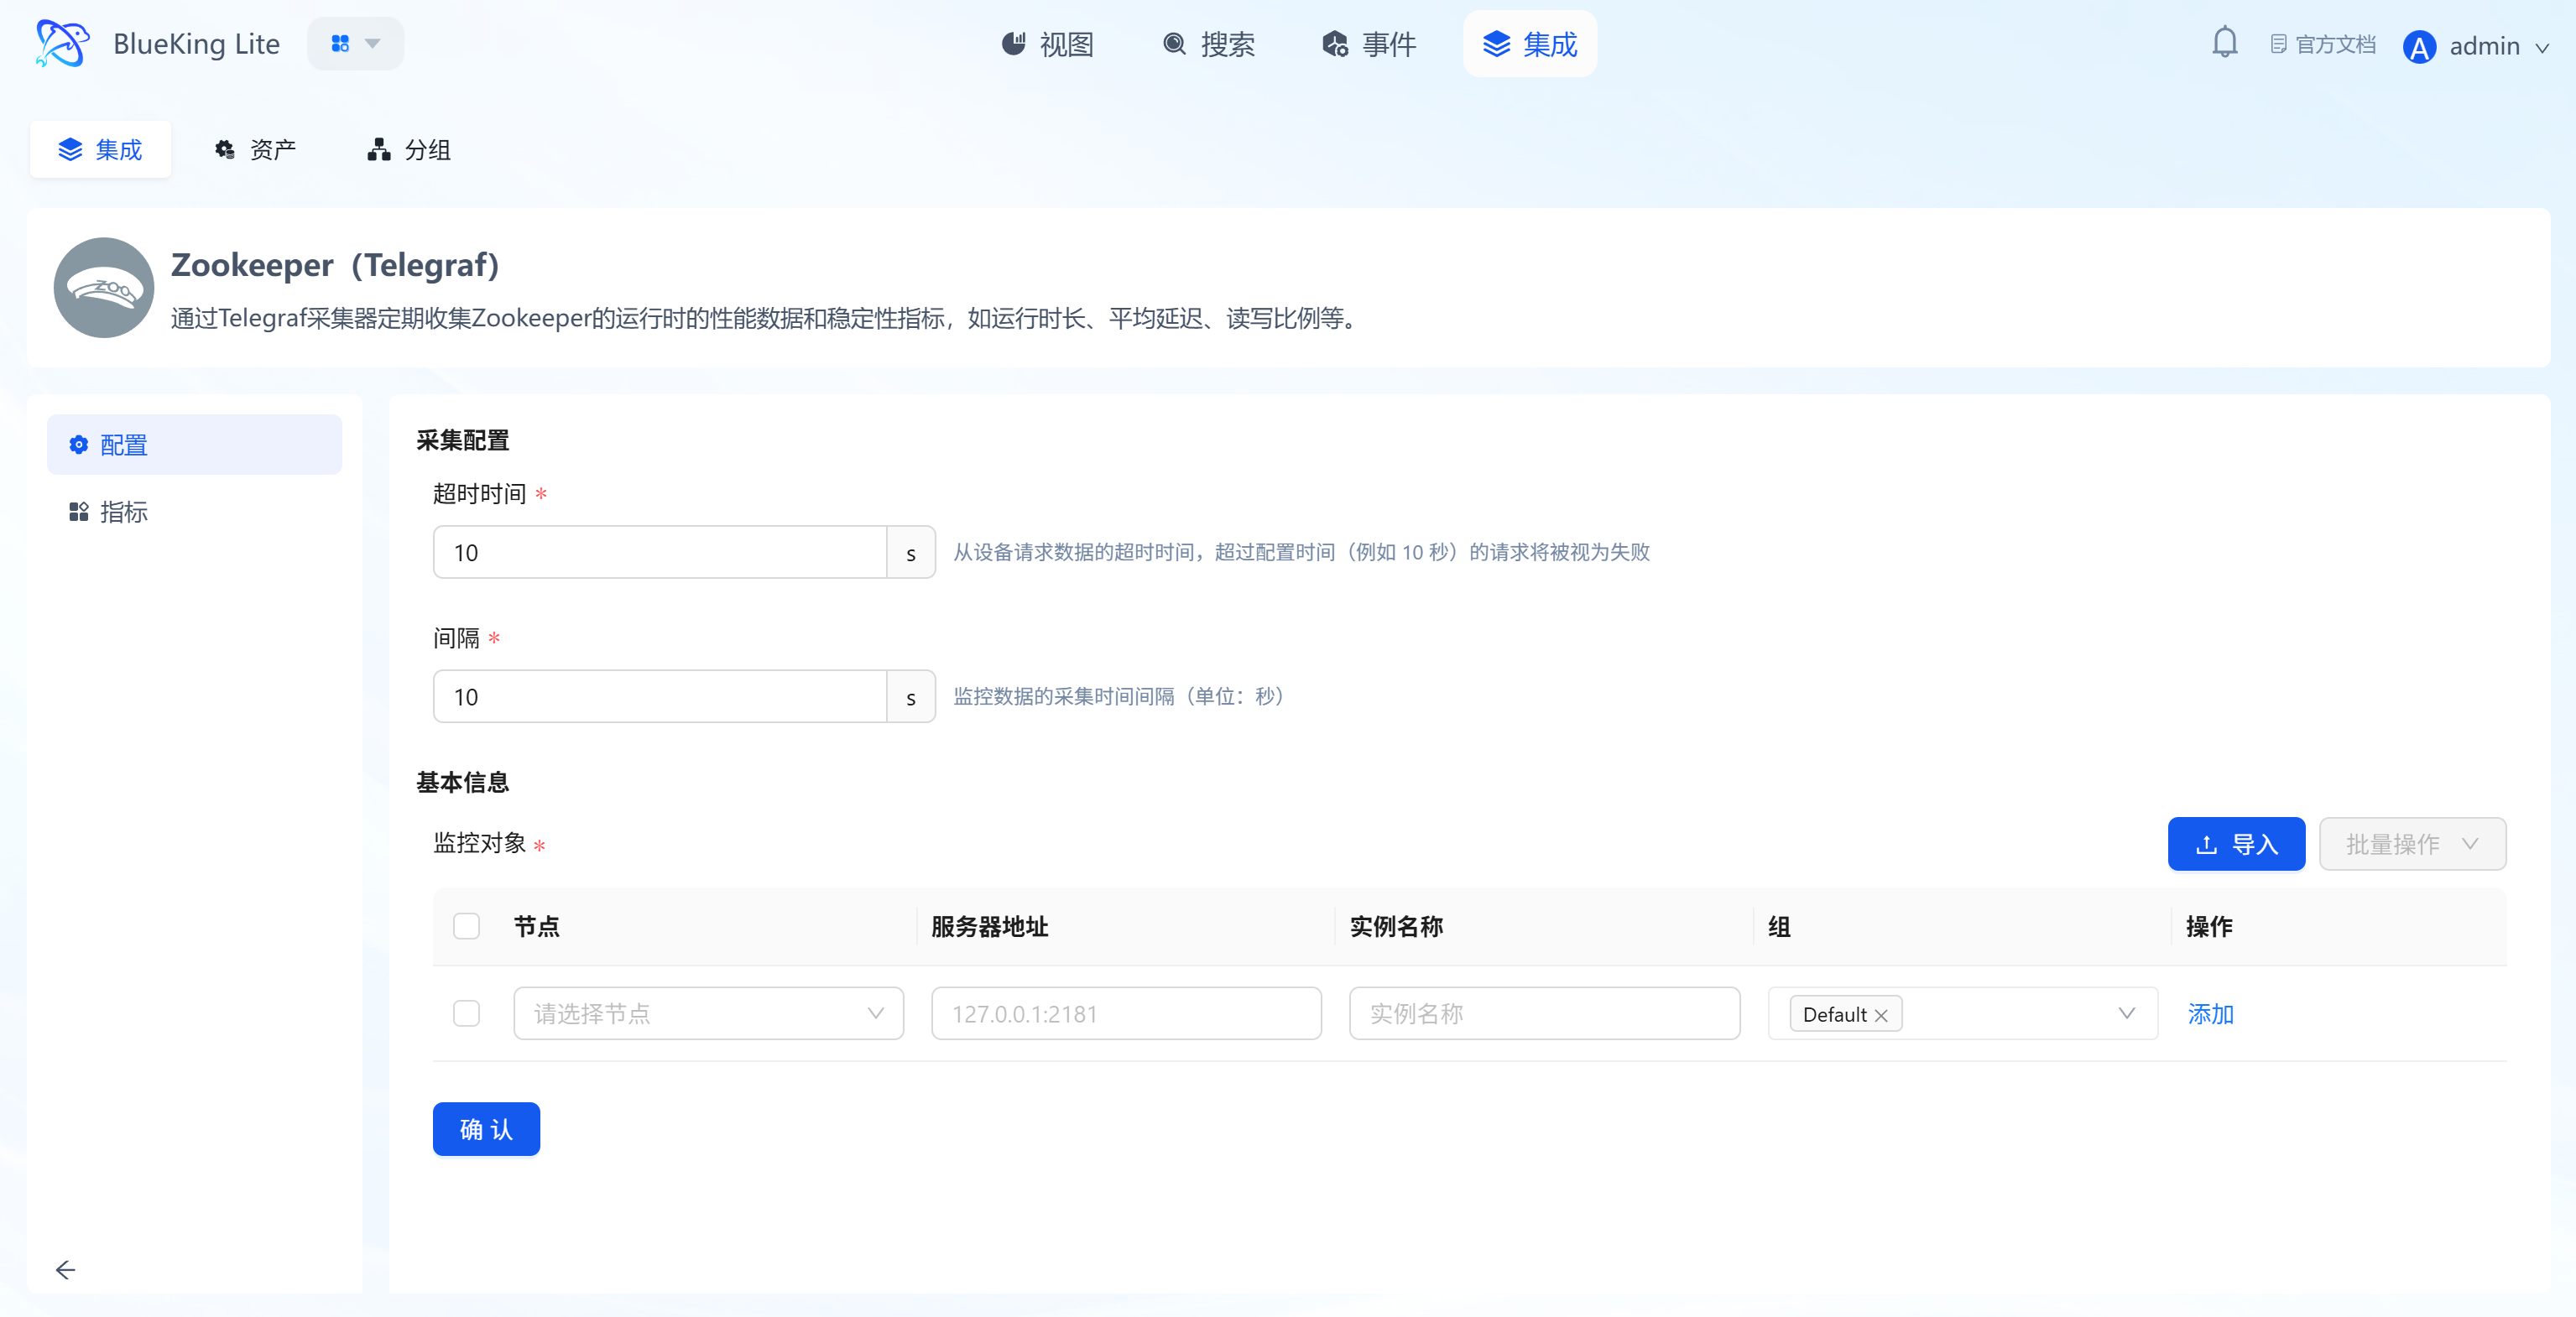
Step 2: Configure Collection Policy
In this step, you need to configure the Zookeeper cluster's server address.
- Collection configuration:
- Timeout: Default is
10s, indicating the timeout limit for a single collection request. - Interval: Default is
10s, indicating the data collection frequency.
- Timeout: Default is
- Configure monitoring targets:
- Node: Select a managed host as the collector (must ensure this machine can access Zookeeper's client port).
- Server address: Enter the Zookeeper node's IP and client port.
- Format:
IP:PORT, default port is2181. - Cluster monitoring: Click "Add" to input multiple Zookeeper node addresses.
- Format:
- Instance name: It is recommended to name it "Zookeeper-ClusterName".
- Click "Confirm".
Screenshot Guide:
- Collection principle: The collector connects to Zookeeper's client port (default 2181) via TCP and sends management commands like
mntrto obtain detailed performance metrics.
Step 3: Verify and Analyze
- Click the "View" module at the top of the page.
- In the left resource list, expand "Middleware" -> "Zookeeper", and click the instance name.
- Data verification:
- zk_avg_latency: Monitor the average request latency (ms). This is the core metric for measuring Zookeeper performance; high values indicate slow service response.
- zk_outstanding_requests: Monitor the number of requests waiting to be processed in the queue. If this value remains high, it indicates Zookeeper's processing capacity has reached a bottleneck.
- zk_server_state: Check the node role (e.g.,
leader,follower). For clusters, there must be exactly oneleader. - zk_num_alive_connections: Monitor the current number of active client connections.
- zk_znode_count: View the total Znode count, useful for evaluating data scale and capacity.
Integrating ActiveMQ
Connect to the ActiveMQ Web Console interface via the Telegraf plugin to collect core metrics such as queue depth, consumer count, message throughput, and JVM status.
Prerequisites
Before starting the integration, ensure that ActiveMQ has enabled the Web Console and that the Jolokia interface is available.
-
Confirm Jolokia interface support
- ActiveMQ 5.8 and above versions include Jolokia by default.
- Verification method: Visit
http://IP:8161/api/jolokia/versionin a browser. If login is required and JSON format version information is returned, the interface is available.
-
Prepare monitoring account
- Option A (Quick integration): Use an existing administrator account
- Directly use ActiveMQ's
adminaccount. This approach requires no server login for configuration, but is not optimal from a security perspective (Telegraf only performs read operations, so the risk is manageable).
- Directly use ActiveMQ's
- Option B: Create a dedicated monitoring account (Recommended for production)
- For security purposes, it is recommended to create an independent account for monitoring.
- Configuration steps (requires logging into the ActiveMQ server):
- Edit the
conf/jetty-realm.propertiesfile in the ActiveMQ installation directory. - Add a new user configuration line at the end of the file:
# Format: username: password, role
# Create a user named monitor with the admin role to allow reading JMX metrics
monitor: Monitor@2025, admin - Save the file (usually no ActiveMQ restart is needed for changes to take effect; restart if necessary).
- Edit the
- Option A (Quick integration): Use an existing administrator account
-
Verify interface availability (must execute)
- Use
curlto simulate a Telegraf request to ensure account credentials and URL are correct. - Test command:
# Replace IP, port, and account credentials
# Note: URL must end with /api/jolokia/version
curl -u admin:admin "http://10.10.90.115:8161/api/jolokia/version" - Success criteria: Returns JSON data containing
"status":200and"agent":....
- Use
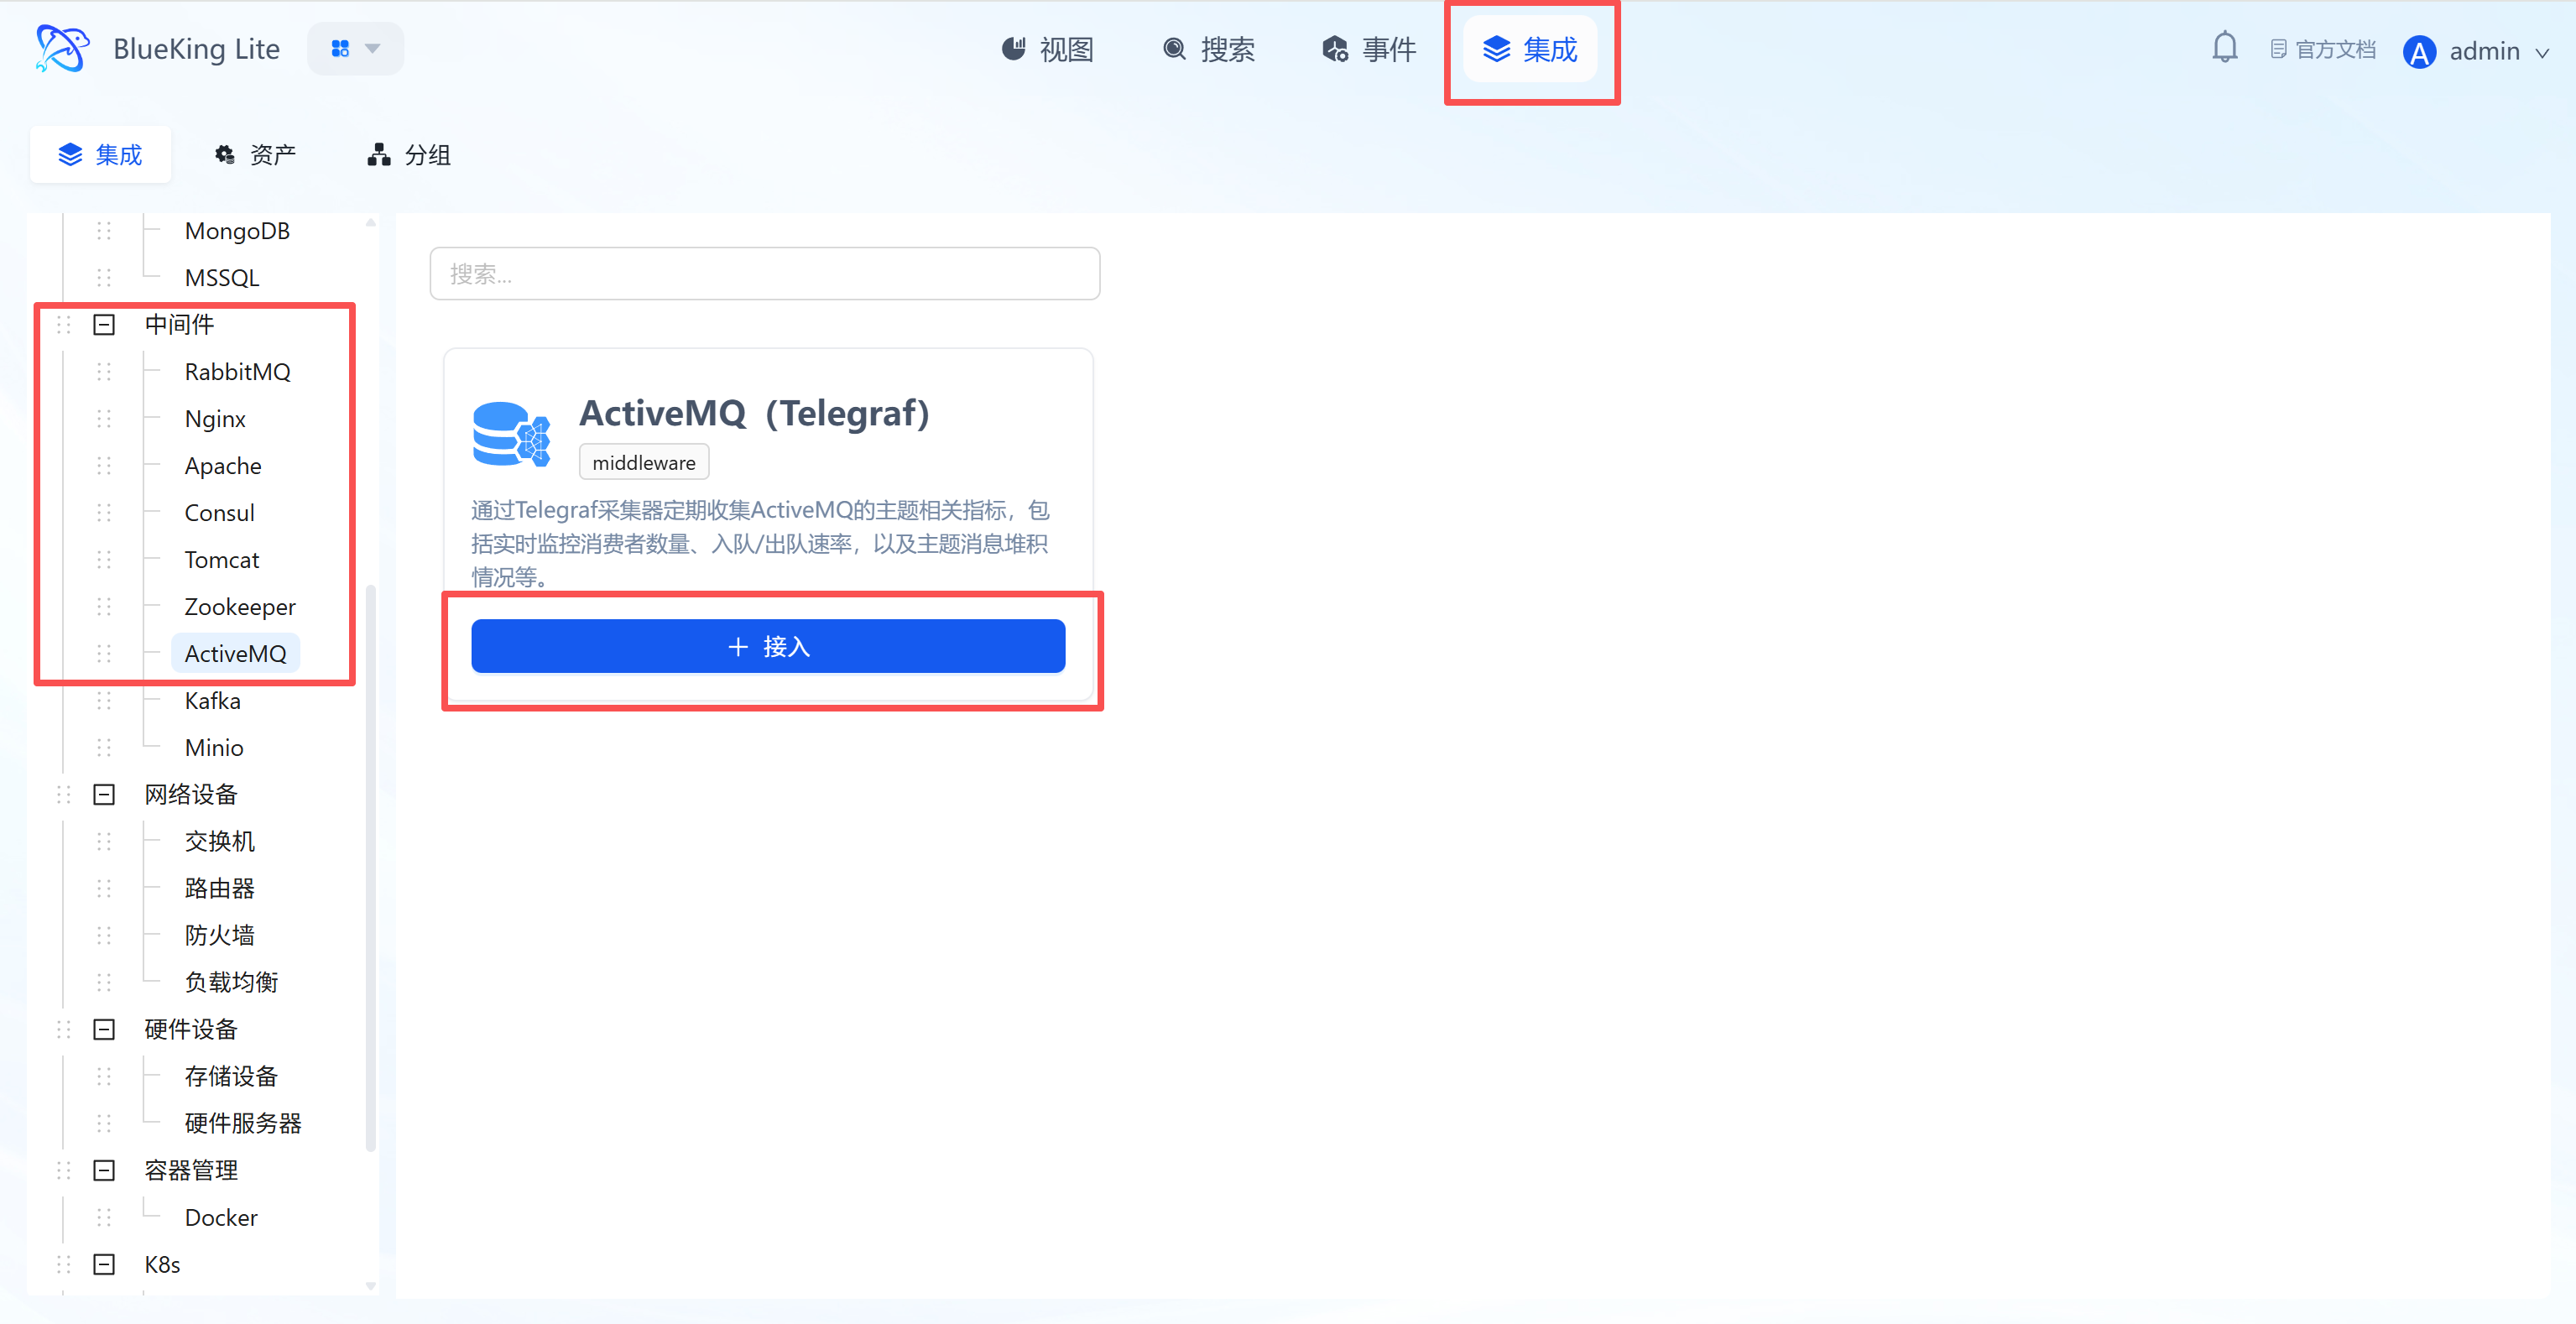
Step 1: Select an Integration Plugin
- After entering Monitor, click "Integration" in the top navigation bar.
- Select resource type:
- Expand the "Middleware" category in the left menu.
- Click "ActiveMQ".
- Click "+ Integrate" at the top right of the list.
Screenshot Guide:
- Plugin description: Uses the Jolokia JMX-HTTP bridge built into ActiveMQ to enable remote collection of internal Broker metrics.
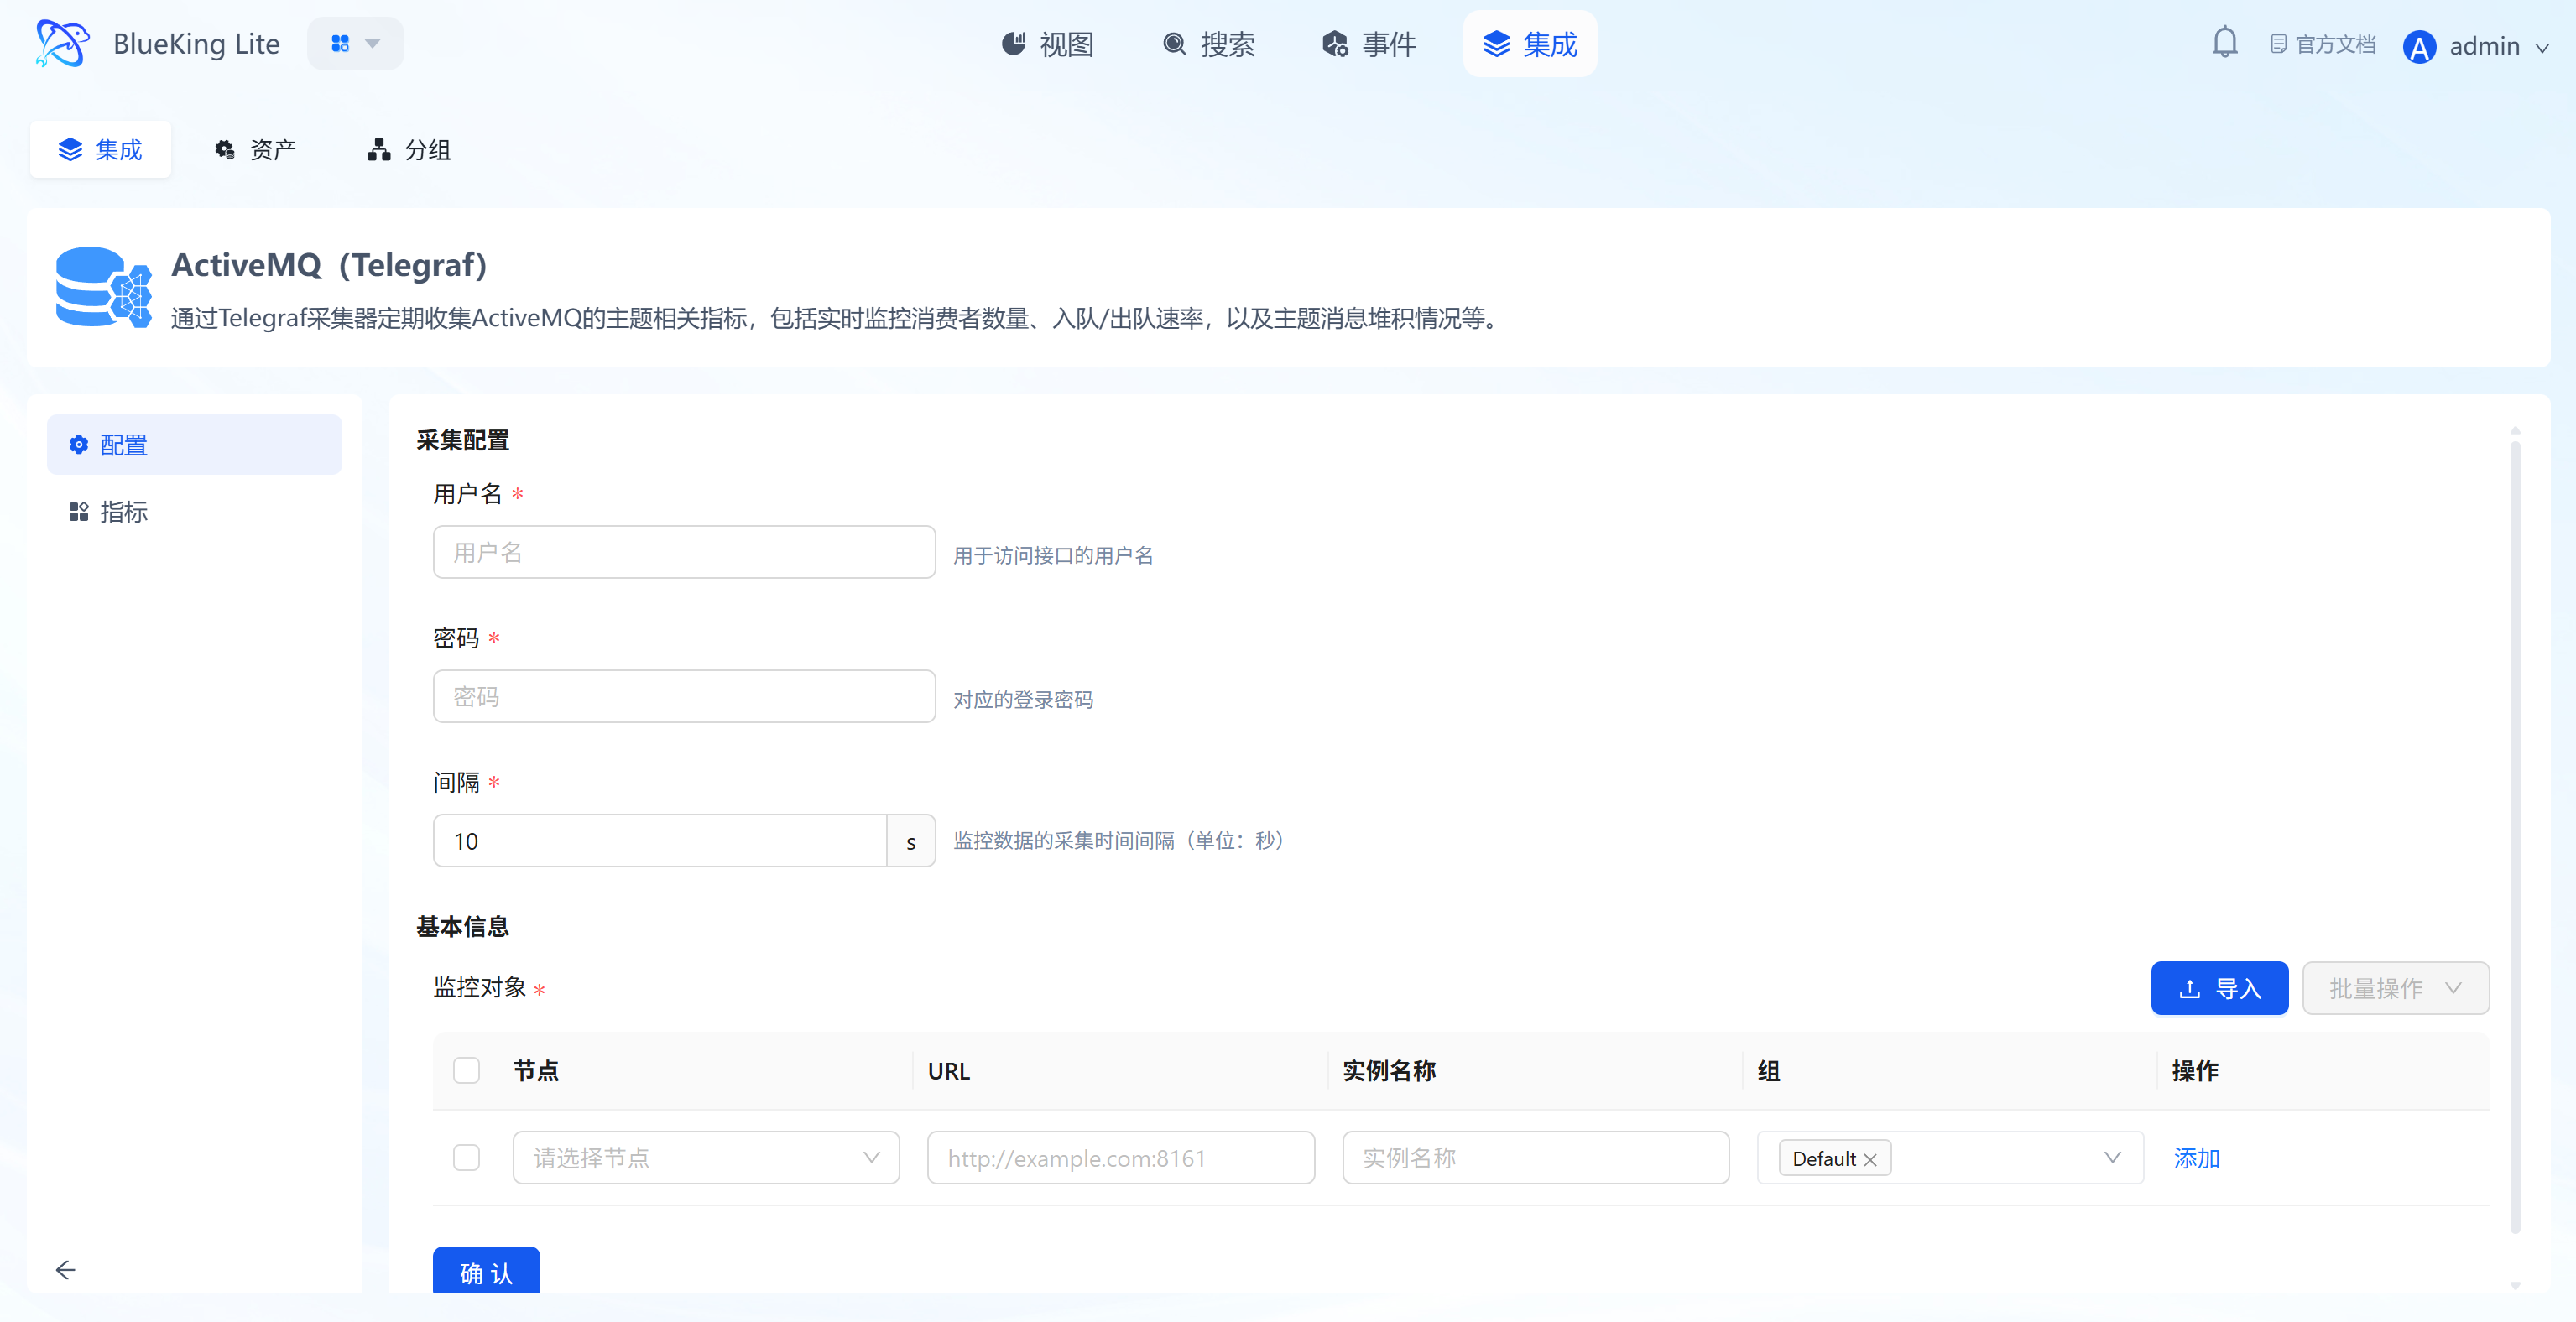
Step 2: Configure Collection Policy
In this step, you need to configure the ActiveMQ Web Console access credentials and API address.
- Collection configuration (authentication information):
- Username: Enter the administrator username used to access the Web Console (e.g.,
admin). - Password: Enter the corresponding password.
- Interval: Default is
10s.
- Username: Enter the administrator username used to access the Web Console (e.g.,
- Configure monitoring targets:
- Node: Select a managed host as the collector (must ensure this machine can access ActiveMQ's Web Console port).
- URL: Enter the complete ActiveMQ Jolokia API address.
- Format:
http://IP:PORT/api/jolokia - Note: The default Web port is
8161, and the path must point to/api/jolokia.
- Format:
- Instance name: It is recommended to name it "ActiveMQ-BusinessName".
- Click "Confirm".
Screenshot Guide:
- Prerequisite: Ensure that ActiveMQ's Web Console (including Jolokia) is enabled. The URL placeholder
http://example.com:8161is only an example — be sure to change it to your actual address and add the/api/jolokiapath.
Step 3: Verify and Analyze
- Click the "View" module at the top of the page.
- In the left resource list, expand "Middleware" -> "ActiveMQ", and click the instance name.
- Data verification:
- Queue Size: Monitor the number of messages in the queue (backlog). Continuous growth indicates insufficient consumption capacity or offline consumers.
- Enqueue/Dequeue Count: View the total enqueued and dequeued message counts, from which message processing rate (TPS) can be calculated.
- Consumer Count: Monitor the consumer count for queues or topics. If the count is 0, messages will continuously accumulate.
- Memory Percent Usage: Monitor the Broker's memory usage to prevent service unavailability due to memory exhaustion.
- Connections: View the total number of currently established client connections.
Integrating Kafka
Since Kafka monitoring relies on a dedicated Exporter component, you need to manually install Kafka-Exporter on the target node before integration.
Prerequisites
Before starting the integration, ensure Kafka cluster network connectivity and prepare SASL authentication credentials.
-
Confirm Zookeeper connection (required for authorization)
- Kafka's permission management (ACLs) relies on Zookeeper.
- ZK address confirmation: Confirm your Zookeeper cluster address (e.g.,
IP:2181orIP:32181).
-
Prepare monitoring account (choose one)
Note: Kafka (0.11 and earlier versions) SASL/PLAIN accounts are stored in server-side configuration files, cannot be created remotely, and adding new accounts requires restarting the Broker.
-
Option A: Use an existing administrator account (Recommended - Quick integration)
- If you cannot restart your production Kafka, directly use an existing account with access privileges (e.g., the
adminor other administrator account you use for daily operations). - Advantage: No configuration file changes needed, no service restart required, no business impact.
- If you cannot restart your production Kafka, directly use an existing account with access privileges (e.g., the
-
Option B: Create a minimum privilege account (only when you have server access)
-
Step 1: Add authentication user (requires server login)
- Find the Kafka JAAS configuration file (usually specified in the startup script, e.g.,
kafka_server_jaas.conf). - Add a new user line in the
PlainLoginModulesection:// Syntax format: user_<your_username>="<your_password>";
// Example: Create a user named monitor with password Monitor@2025
user_monitor="Monitor@2025"; - Restart the Kafka Broker for the account to take effect.
- Find the Kafka JAAS configuration file (usually specified in the startup script, e.g.,
-
Step 2: Configure ACL permissions (grant read-only access)
- Log in to the server and use the
kafka-acls.shtool to grant the user describe and read permissions on the cluster. - Example command:
# Grant global read-only permissions
bin/kafka-acls.sh --authorizer-properties zookeeper.connect=localhost:2181 \
--add --allow-principal User:monitor \
--operation Read --operation Describe \
--topic '*' --group '*'
- Log in to the server and use the
-
-
Preliminary Step: Install Collection Component
Before configuring monitoring, go to the "Node Management" module to deploy the Kafka collector.
- From the homepage, enter the "Node Management" module.
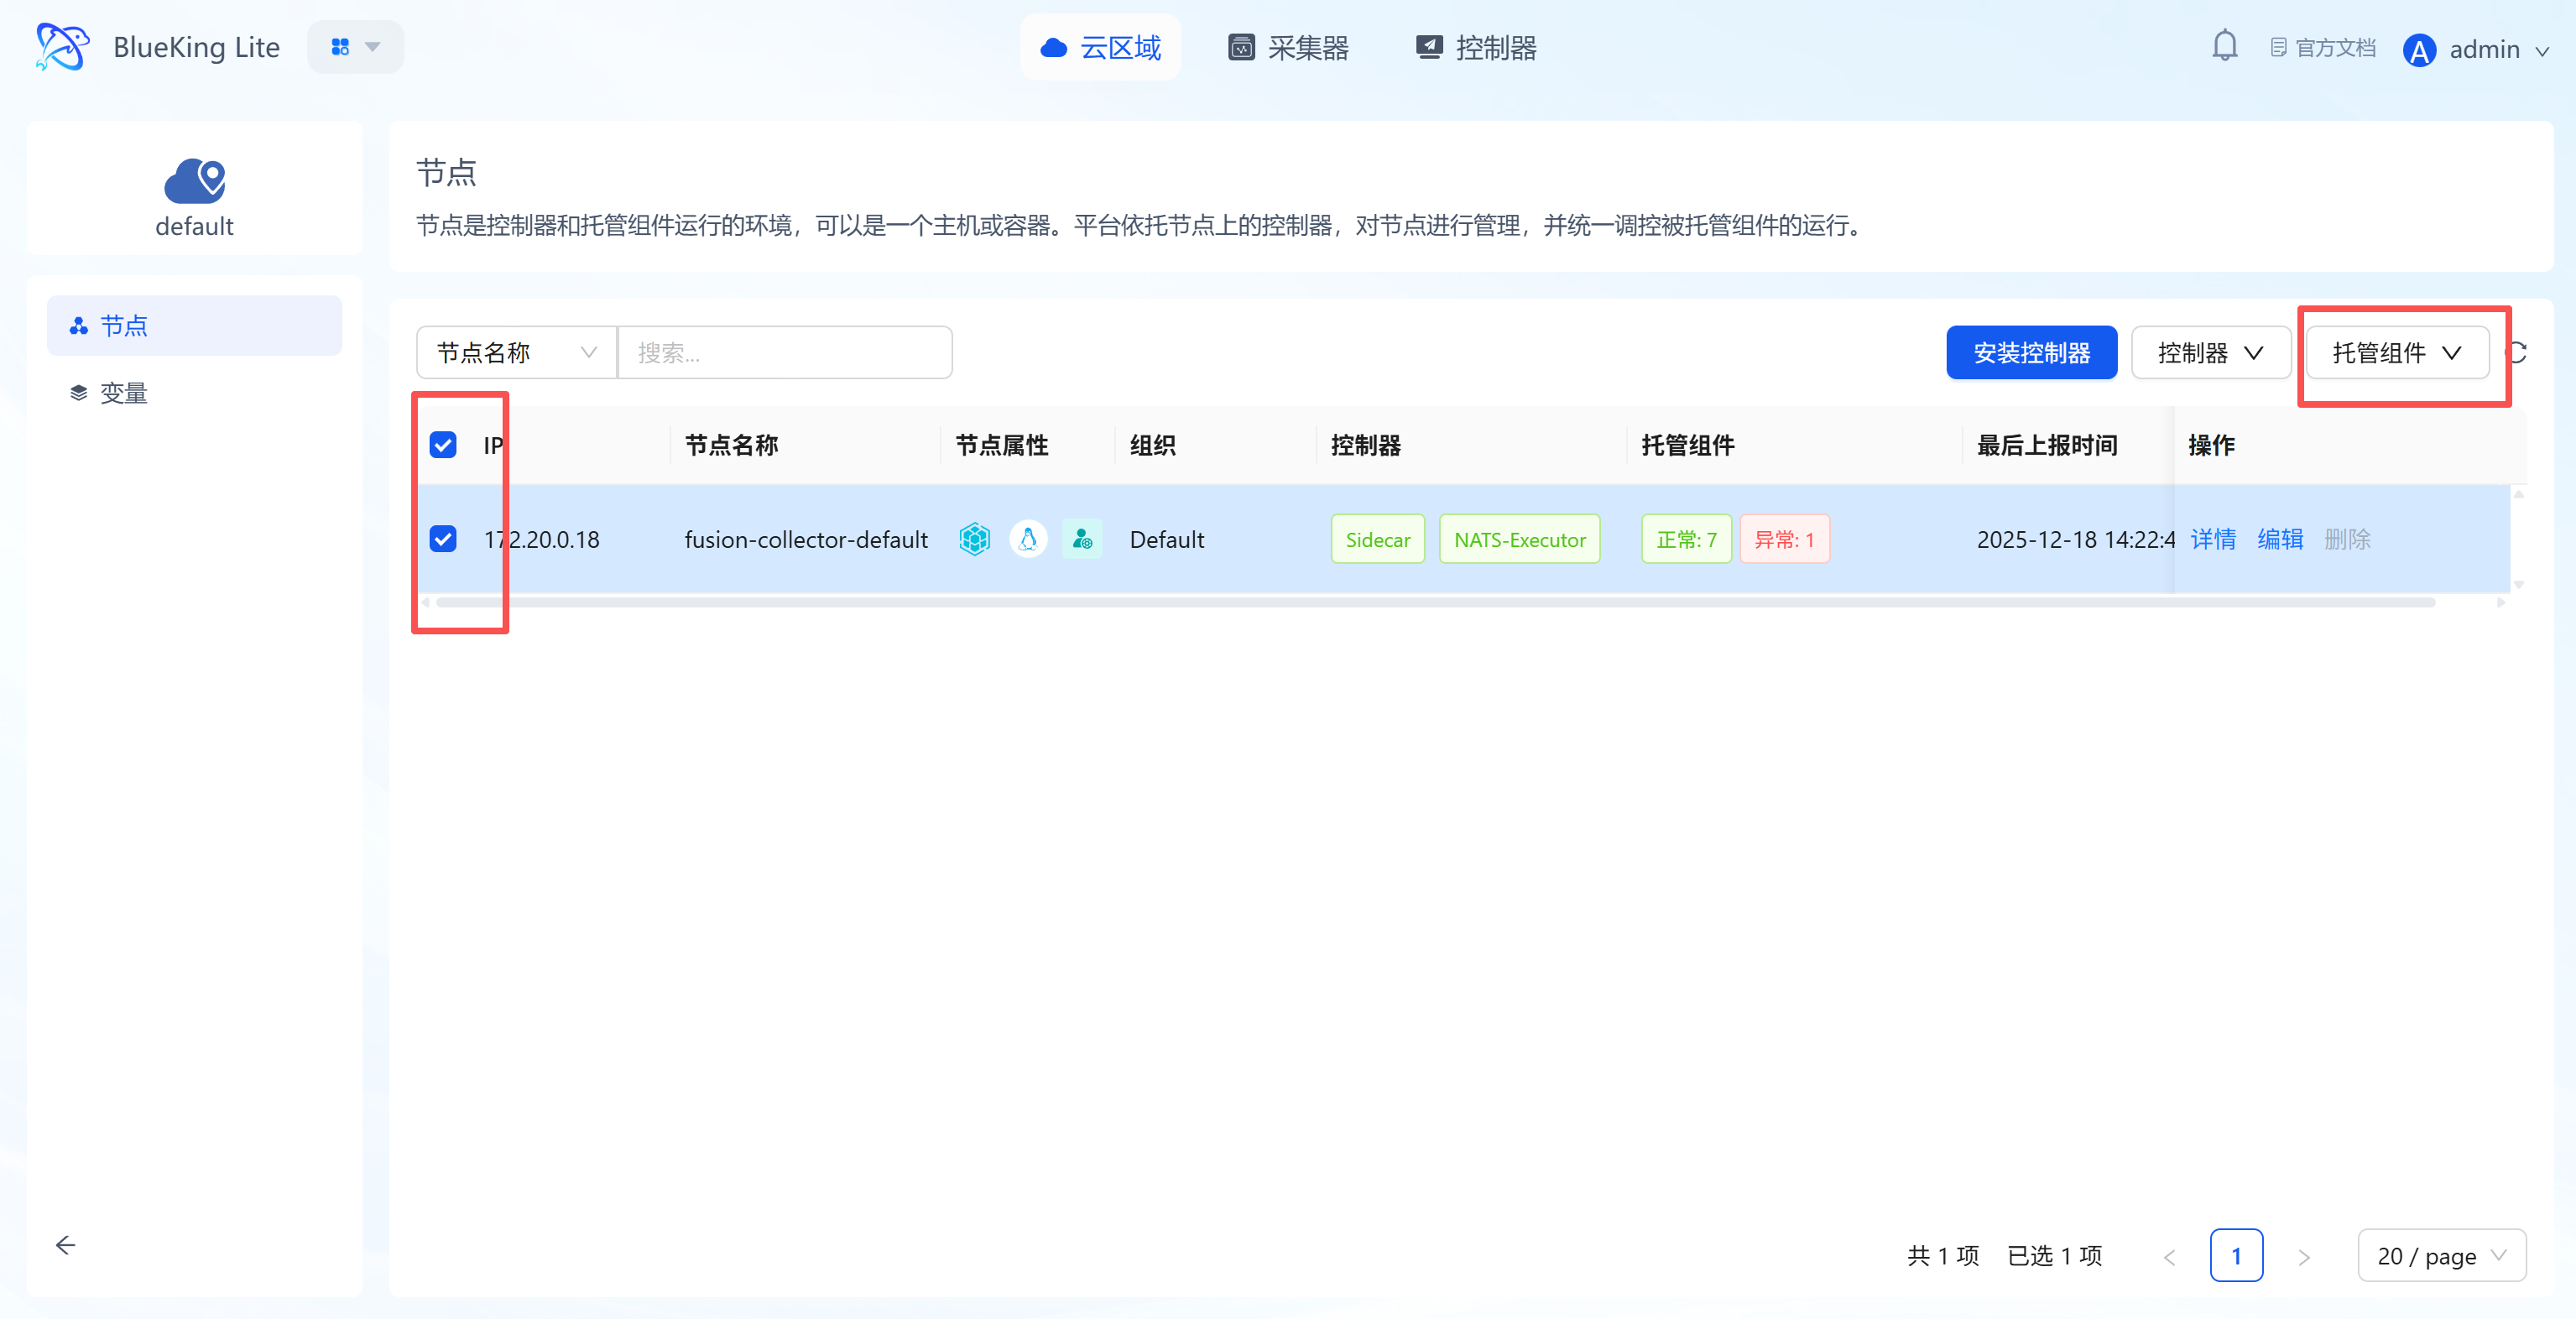
- Select the corresponding "Cloud Region" (e.g.,
default). - Select target node:
- In the node list, check the server you plan to use for running monitoring tasks (this server must be able to access the Kafka cluster).
- Click the "Manage Components" button above the list.
- Click "Install Component" in the dropdown menu.
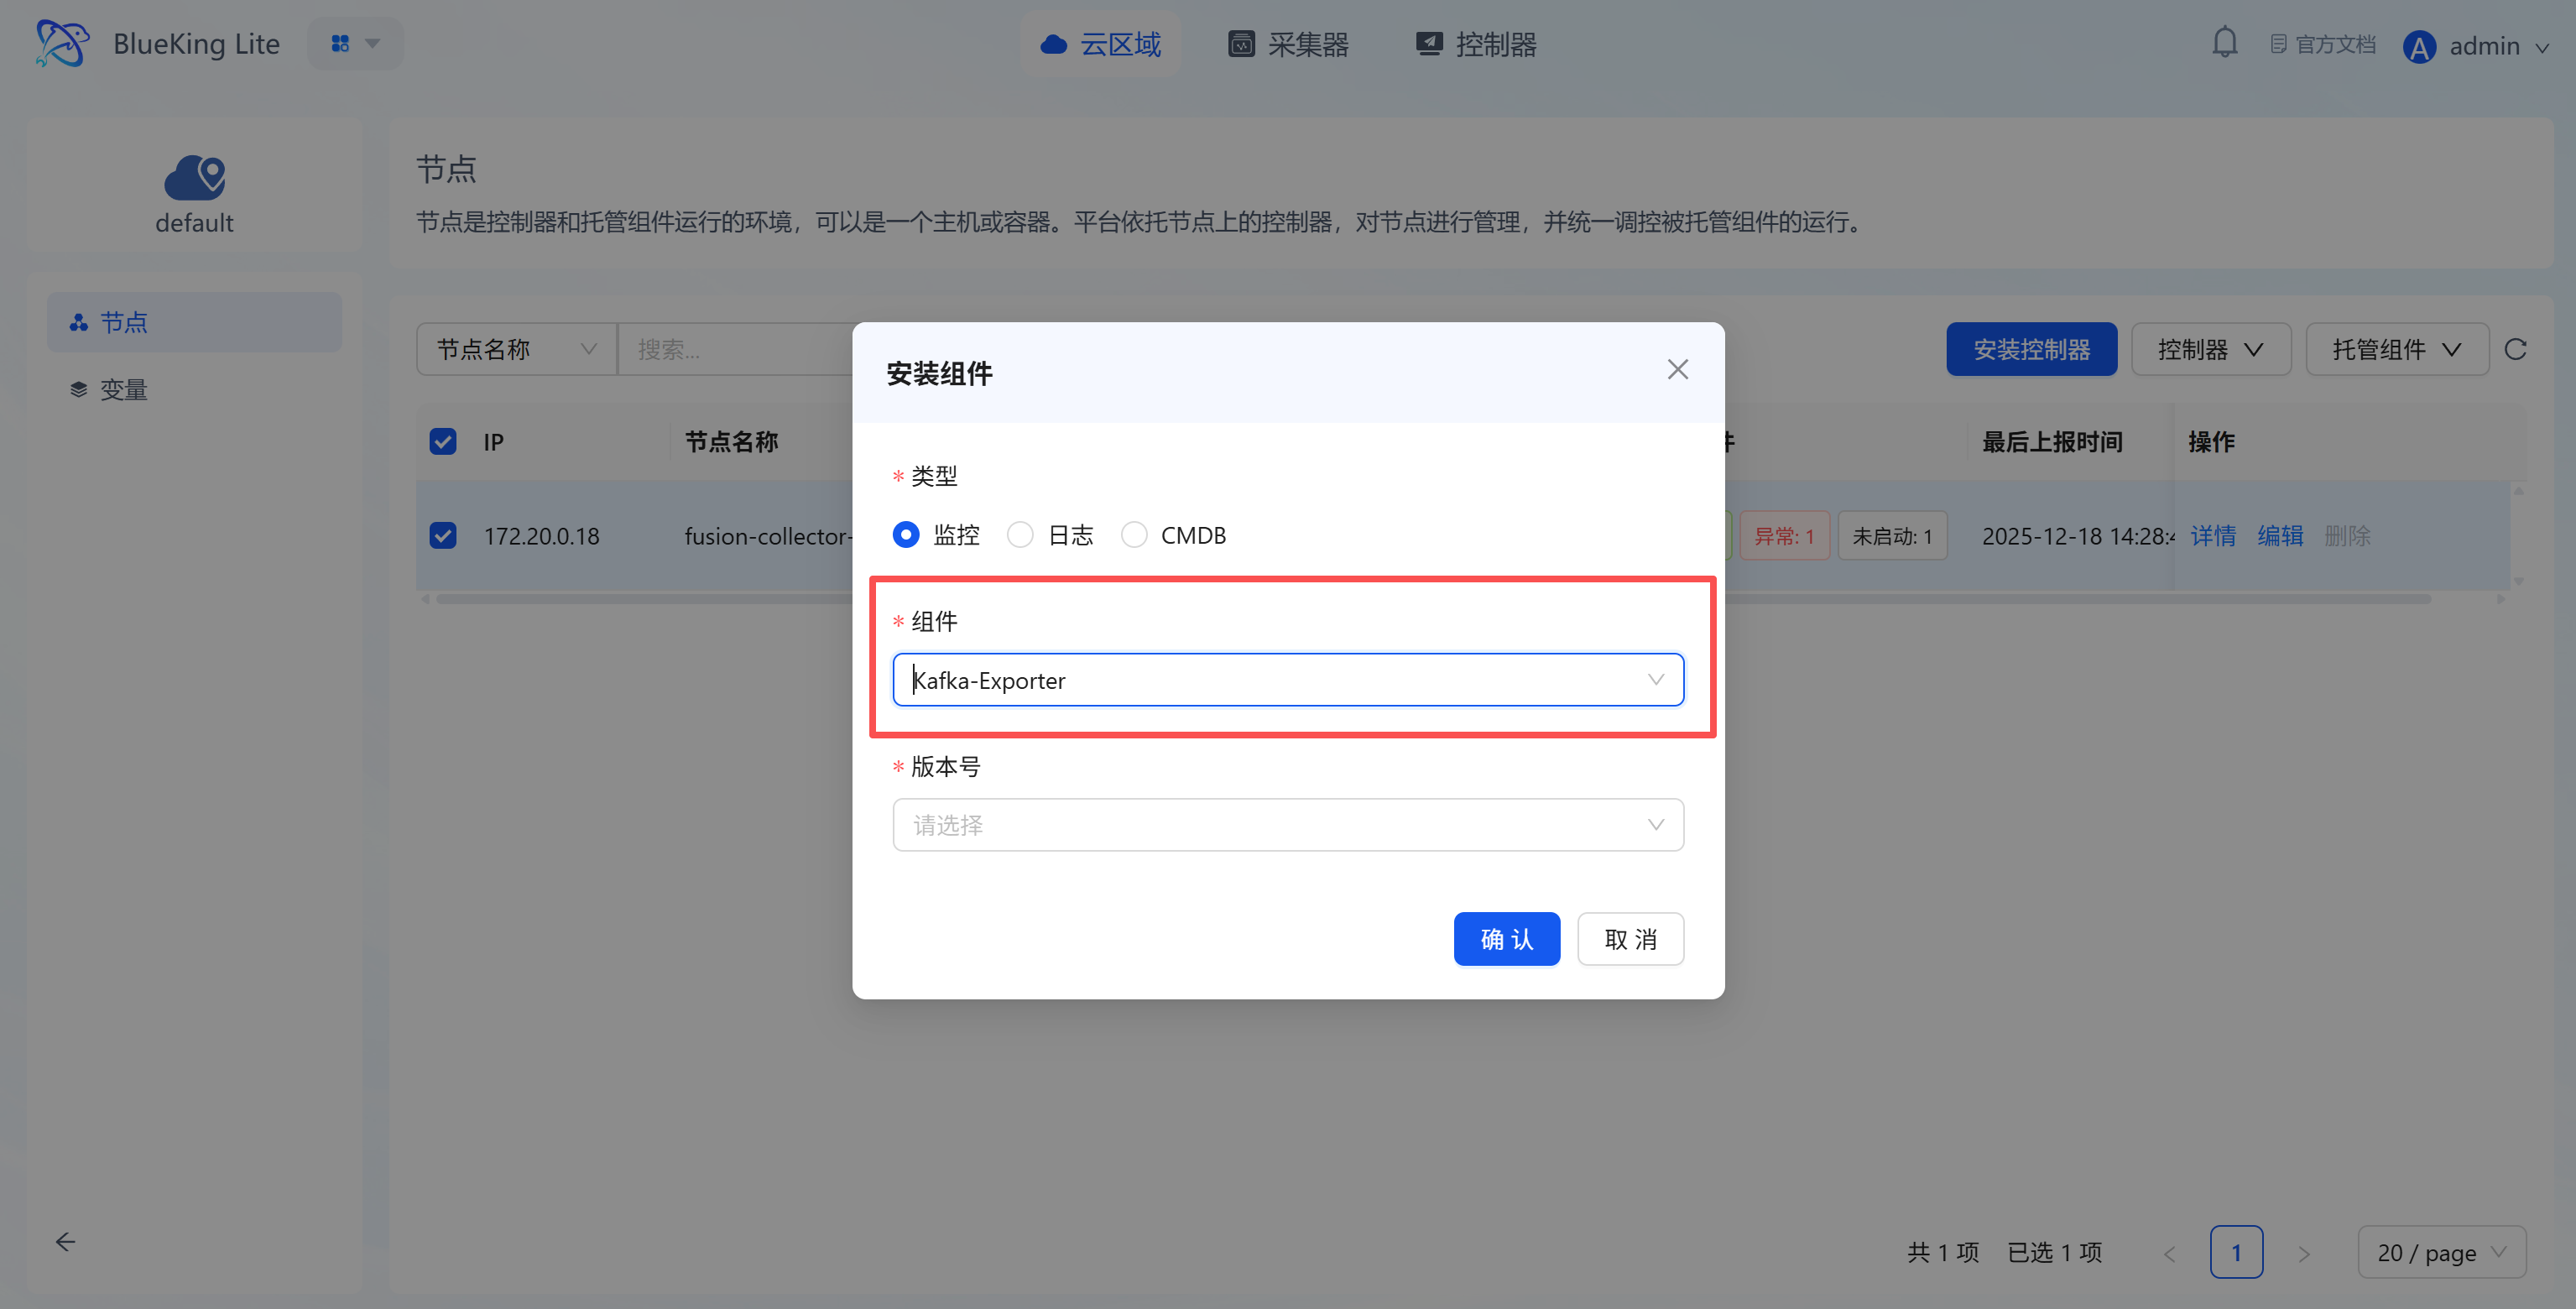
- Install Kafka-Exporter:
- Type: Select
Monitoring. - Component: Select
Kafka-Exporterfrom the dropdown. - Version: Select the latest version.
- Type: Select
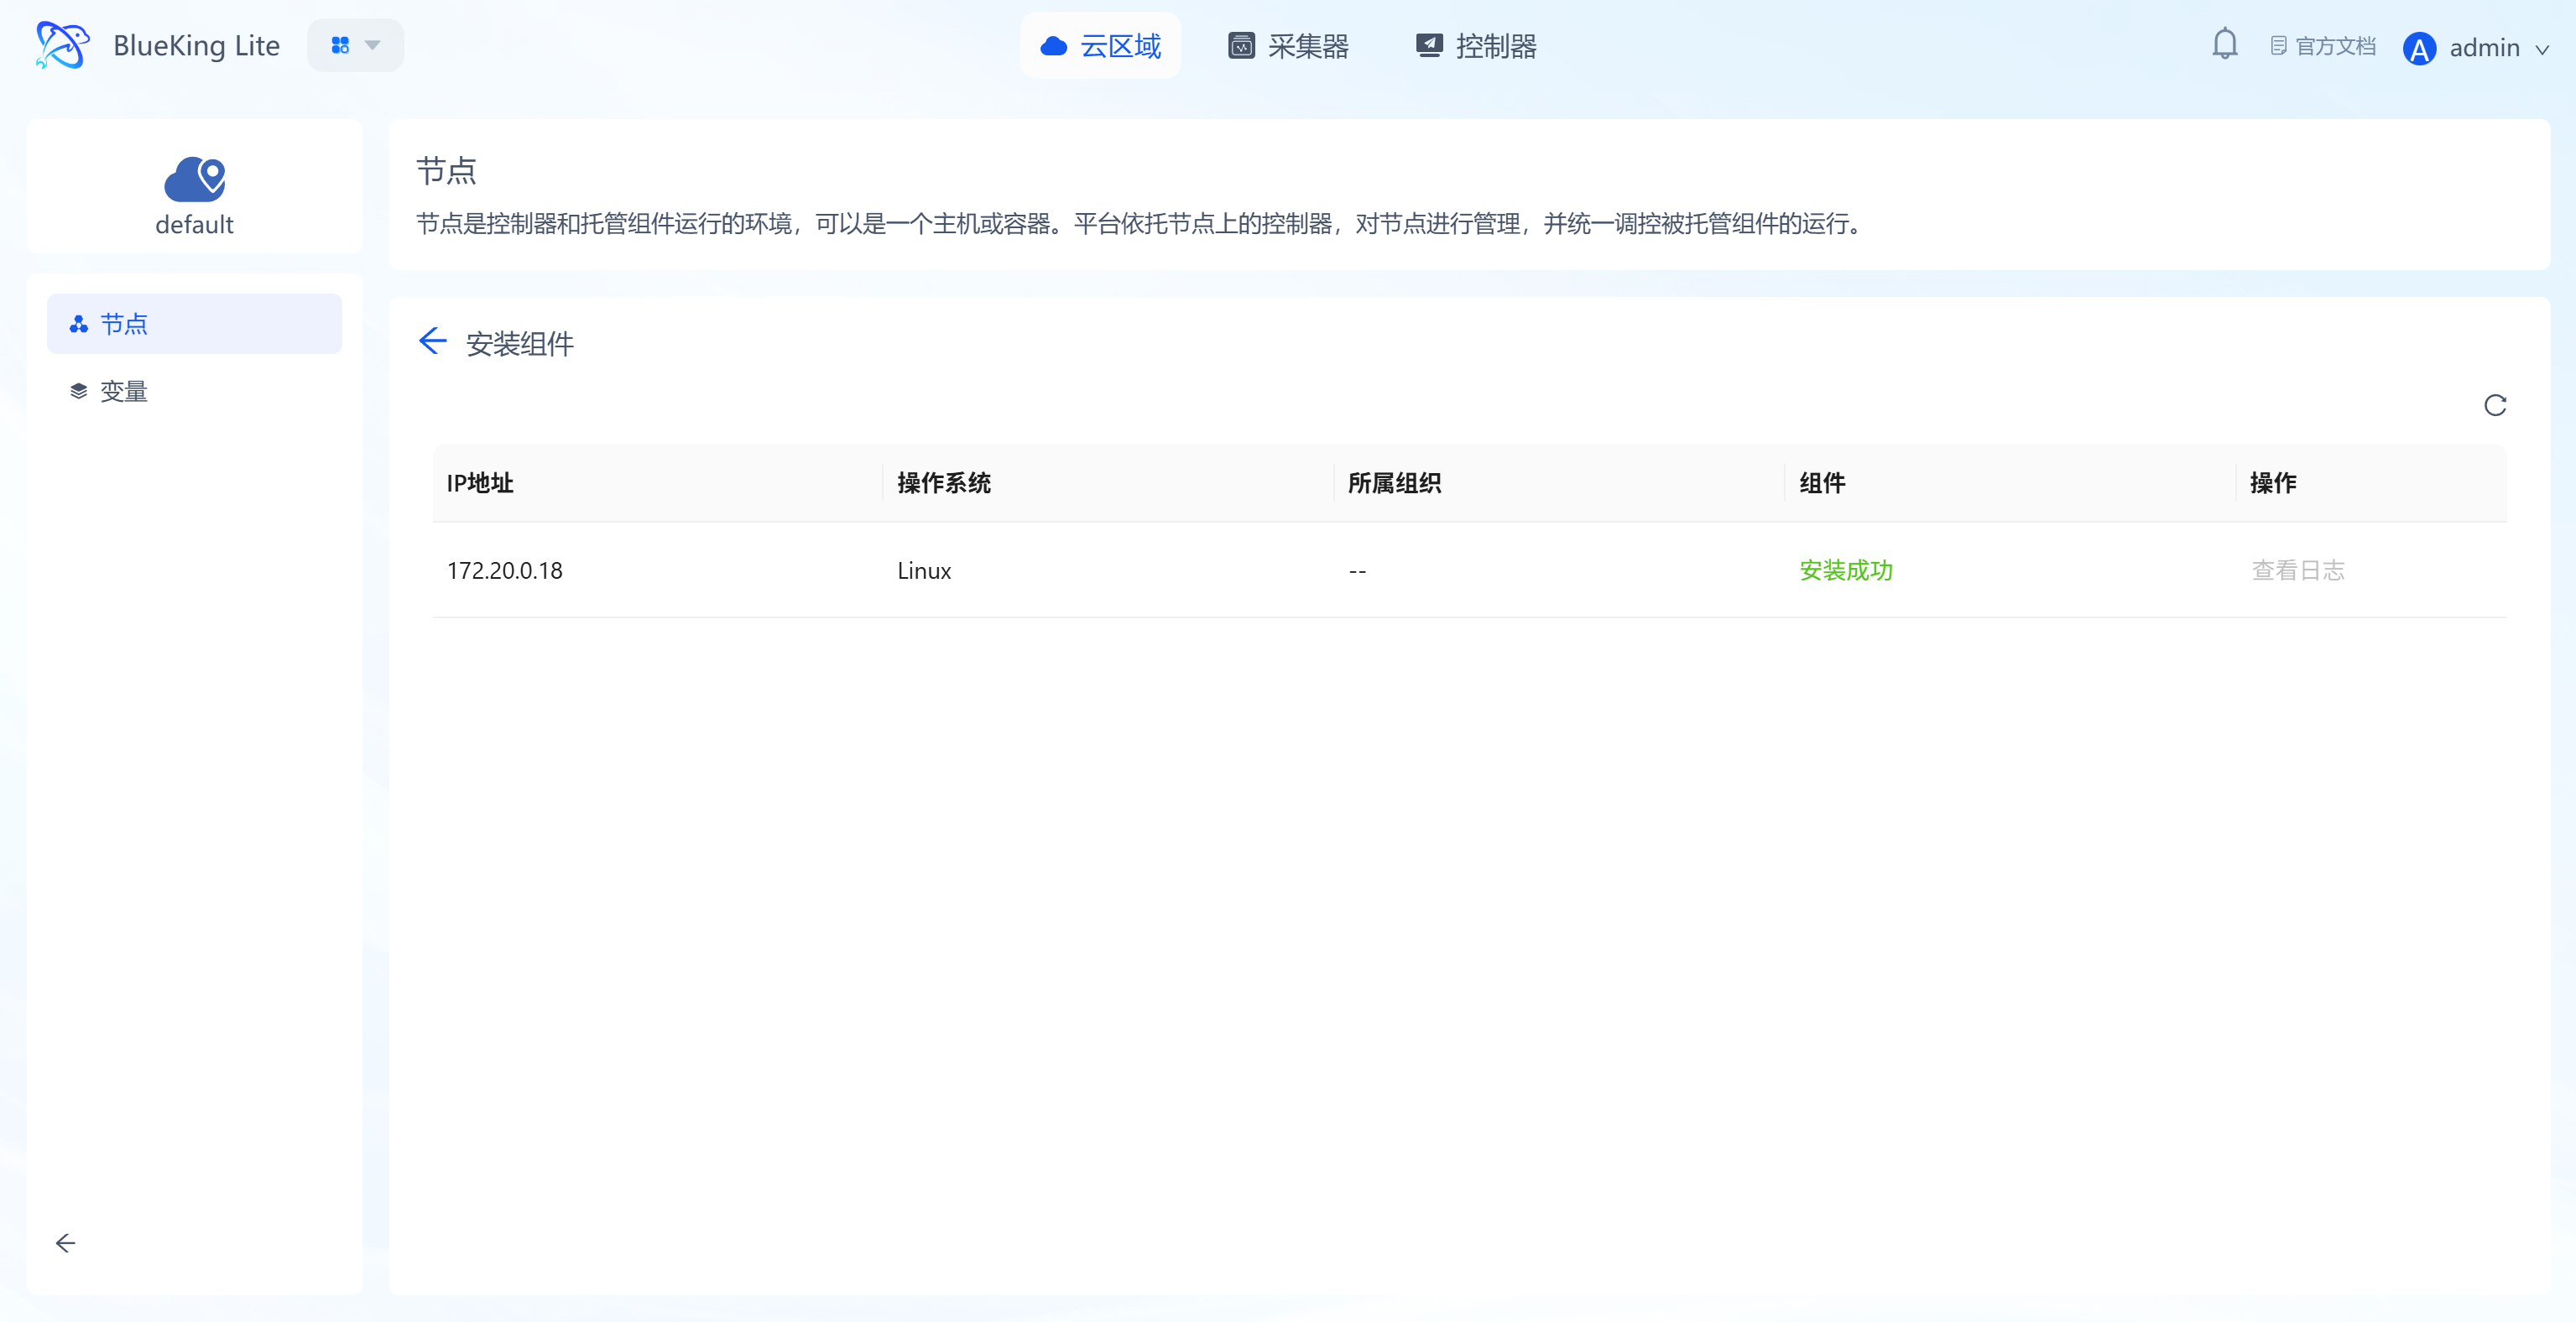
- Click "Confirm" and wait for the task to complete successfully with the component status changing to "Installation Successful".
Screenshot Guide:
- Operation logic: This step deploys a dedicated service (Exporter) on the specified collection machine that connects to Kafka and exposes metrics.
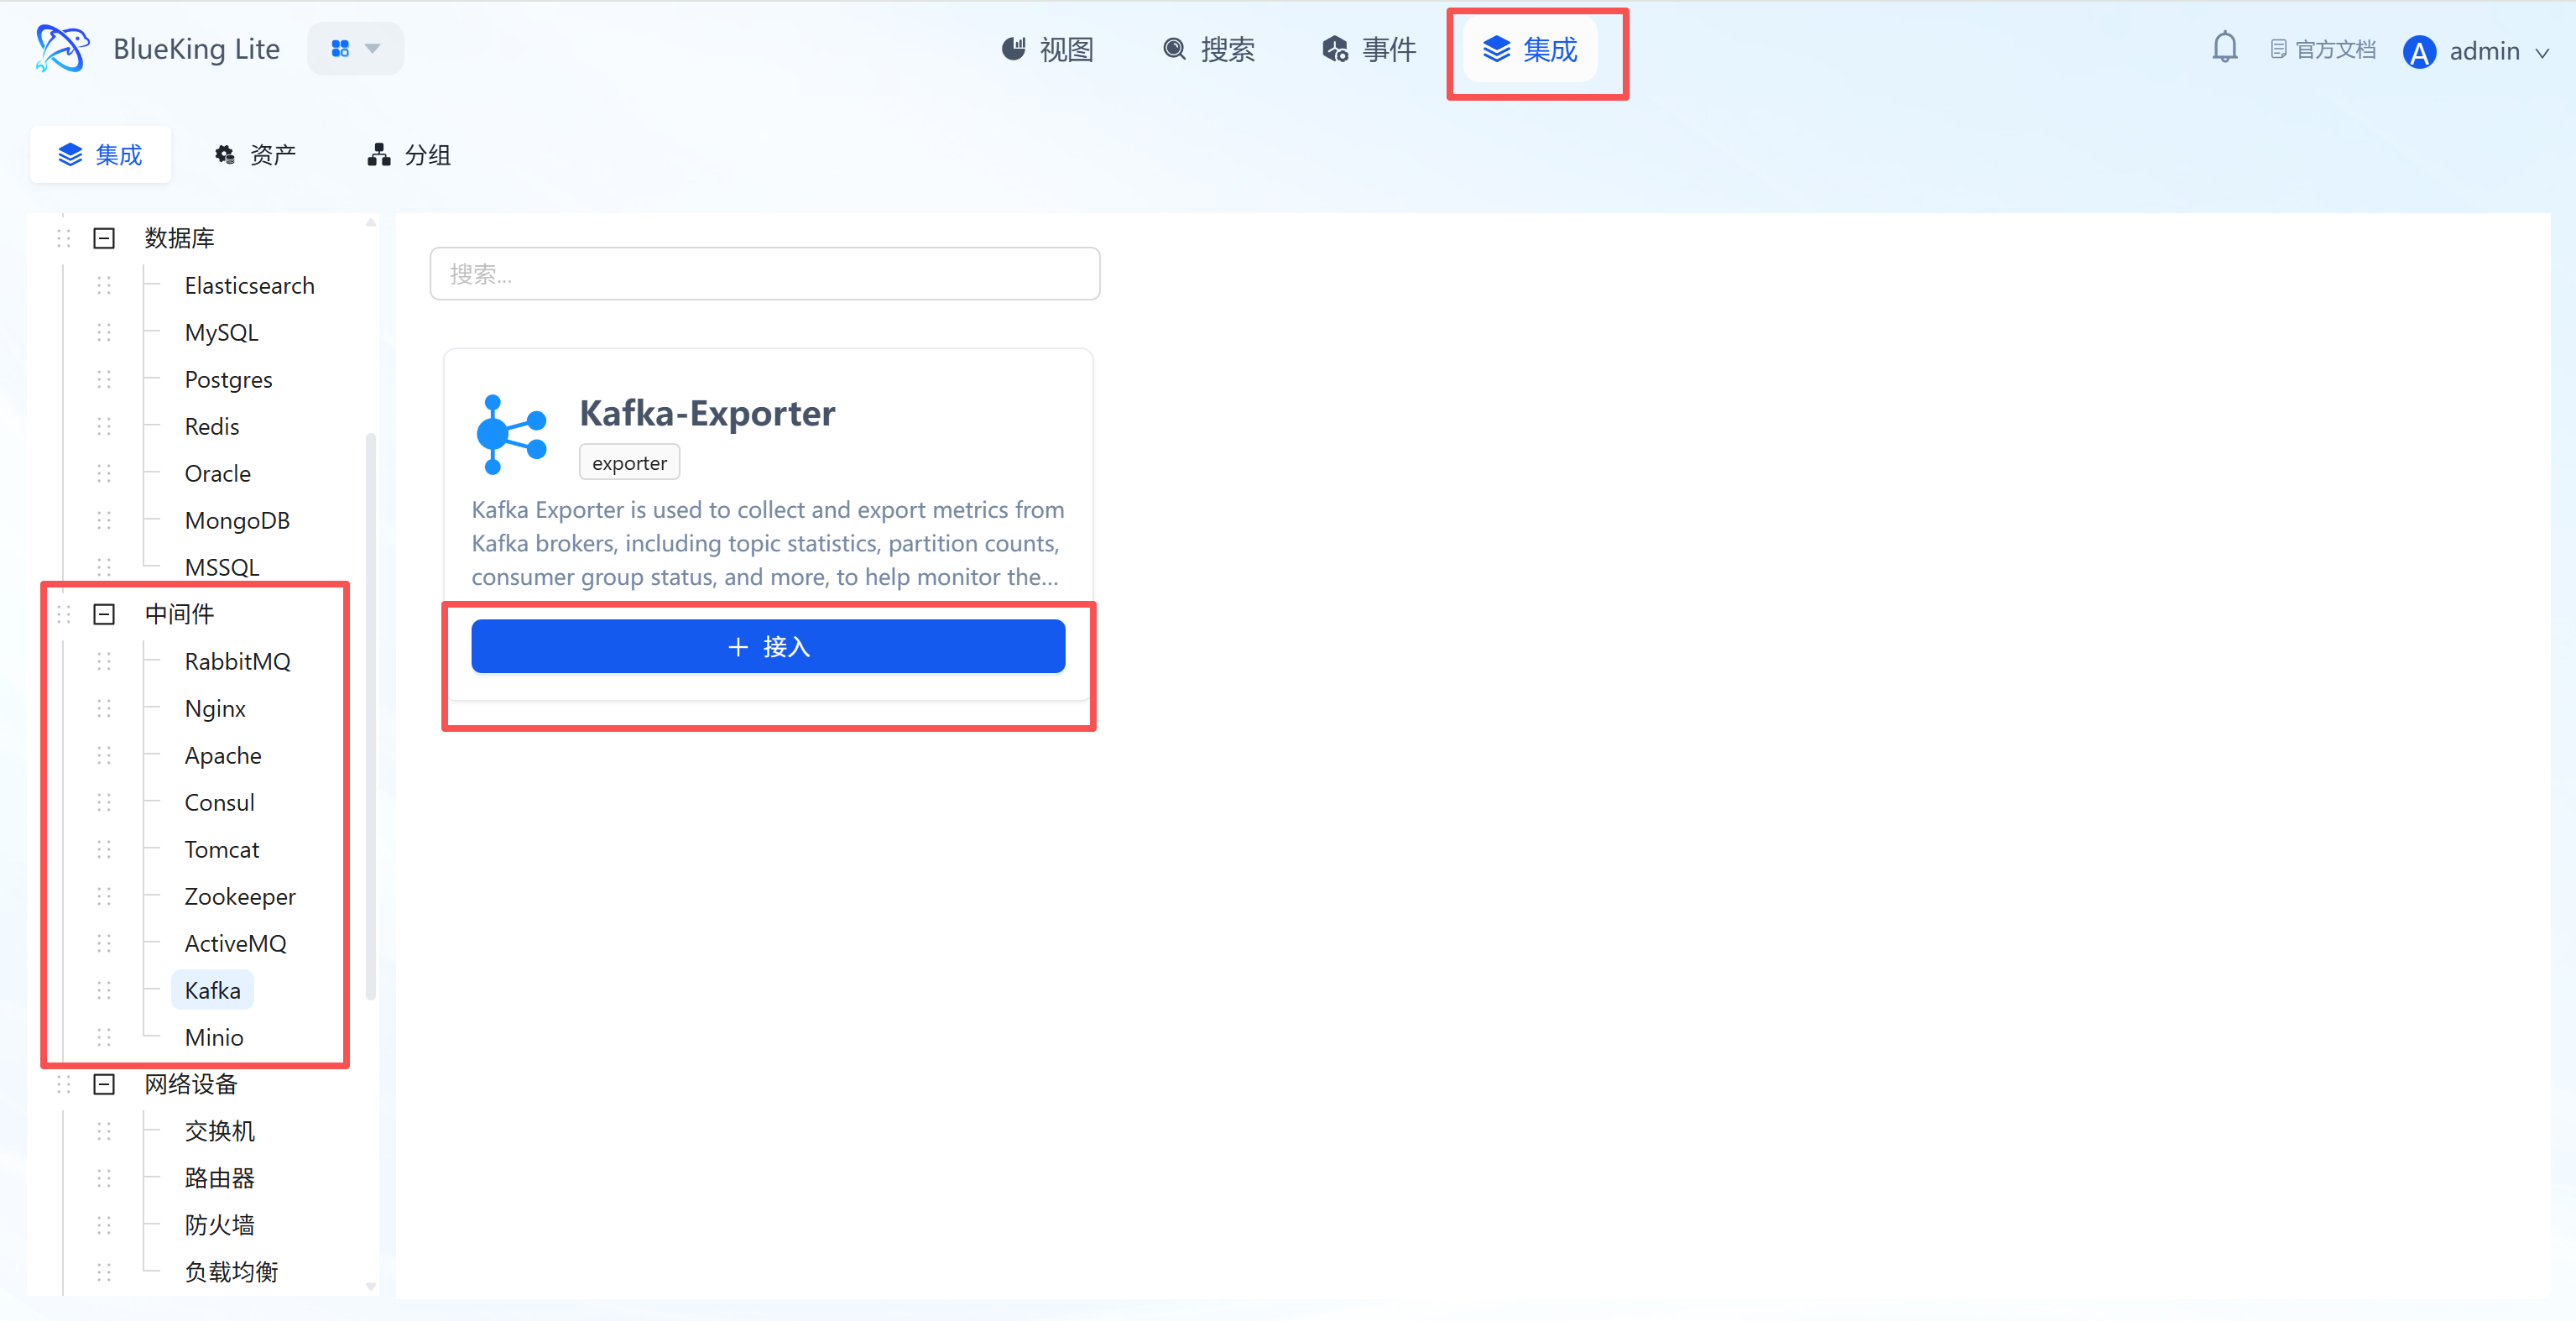
Step 1: Select an Integration Plugin
After the component installation is complete, return to the monitoring module to configure the data source integration.
- After entering Monitor, click "Integration" in the top navigation bar.
- Expand "Middleware" in the left menu and click "Kafka".
- Click "+ Integrate" at the top right of the list.
Screenshot Guide:
- Plugin description: Collects core data including Broker metrics, Topic throughput, and Consumer Group consumption lag via Kafka Exporter.
Step 2: Configure Collection Policy
In this step, you need to configure the Kafka cluster connection information.
- Collection configuration:
- Version: Specify the Kafka cluster version, e.g.,
2.0.0. - Username/Password: Fill in if your Kafka has SASL authentication enabled; otherwise, leave blank.
- Mechanism: Used for SASL authentication; keep the default
plainfor regular clusters. - Interval: Default is
10s.
- Version: Specify the Kafka cluster version, e.g.,
- Configure monitoring targets:
- Node: Must select the node where the Kafka-Exporter component was just installed.
- Kafka Server: Enter the Kafka Broker connection address.
- Example:
192.168.1.10:9092. For clusters, enter multiple Broker addresses separated by commas.
- Example:
- Instance name: It is recommended to name it "Kafka-ClusterName".
- Click "Confirm".
Screenshot Guide:
- Key configuration: In the "Node" dropdown, you can only select machines that have successfully installed Kafka-Exporter; otherwise, the collection task will fail.
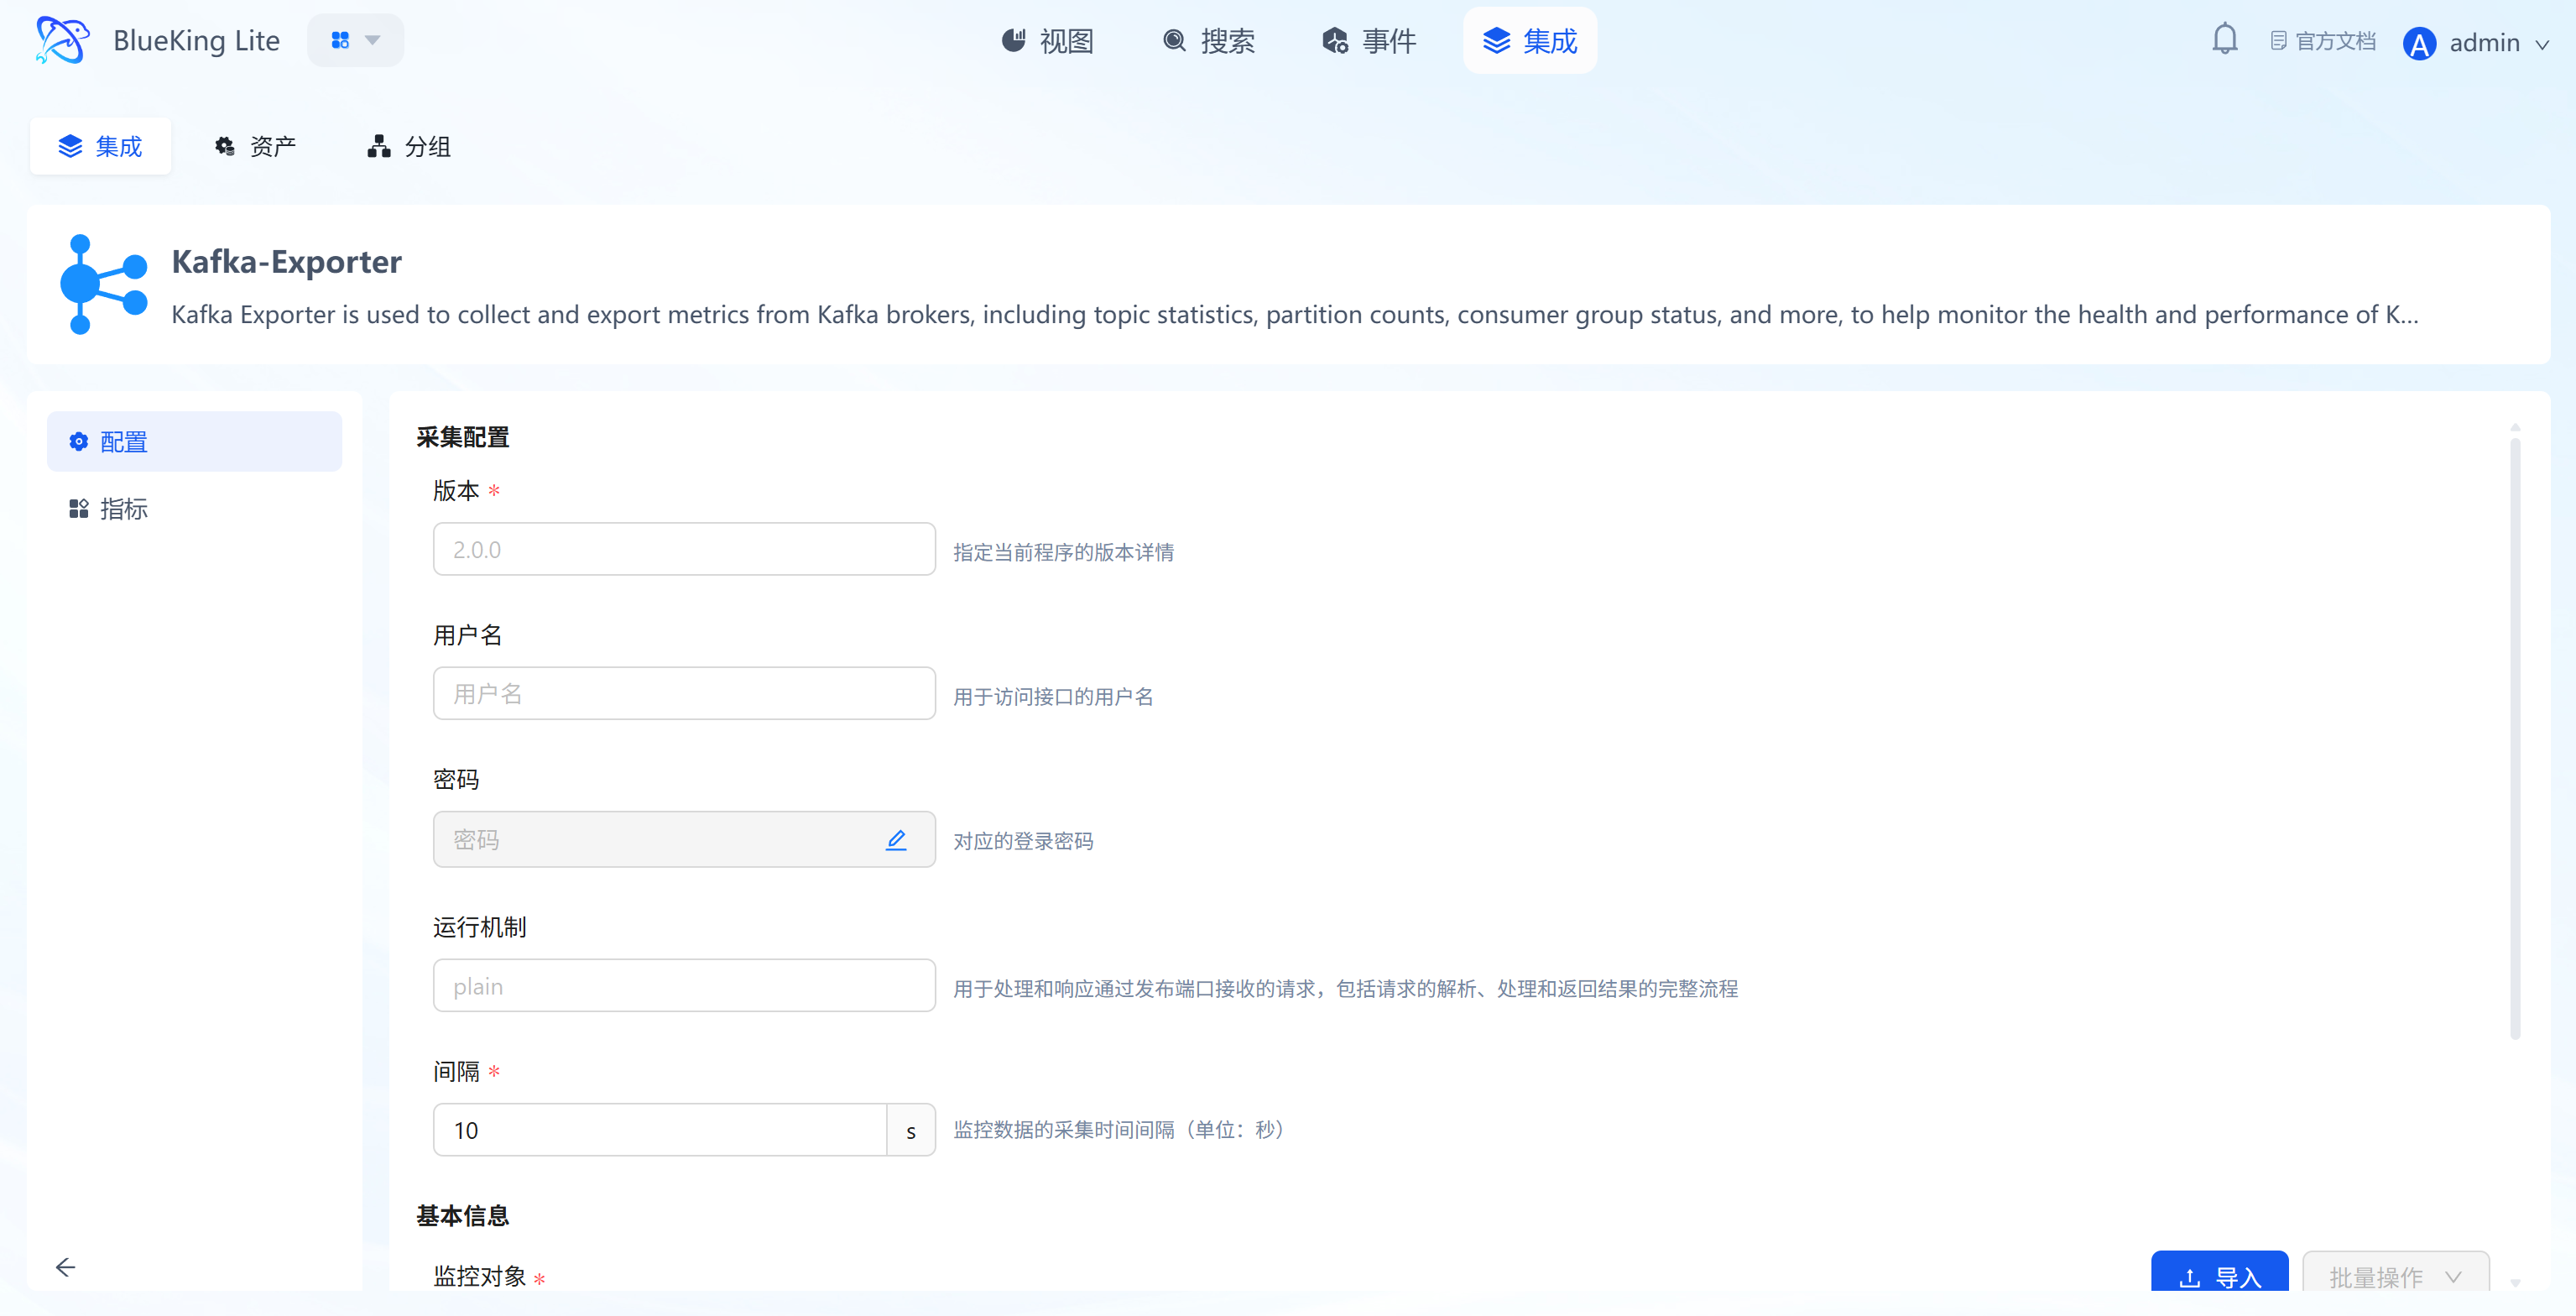
Step 3: Verify and Analyze
- Click the "View" module at the top of the page.
- In the left resource list, expand "Middleware" -> "Kafka", and click the instance name.
- Data verification:
- Consumer Group Lag: Monitor the consumer group lag (backlog) — this is the most critical metric for assessing whether consumption capacity matches production capacity.
- Messages In Rate: View the number of messages written to the Topic per second, reflecting producer throughput.
- Bytes In/Out Rate: Monitor the Broker's inbound/outbound traffic volume.
- Under Replicated Partitions: Check the number of under-replicated partitions; a value greater than 0 indicates the cluster is at risk of data loss.
Integrating MinIO
Connect to MinIO's Prometheus metrics interface via the Telegraf collector to collect key metrics for the object storage system including operational status, storage capacity, network traffic, and S3 requests.
Prerequisites
Before starting the integration, ensure network connectivity and meet the version requirements: Only MinIO Server RELEASE.2024-07-15T19-02-30Z and earlier, MinIO Client (mc) RELEASE.2024-07-11T18-01-28Z and earlier are supported.
-
Confirm service port
- MinIO typically runs on port
9000. - Verification commands: Check connectivity for the following 4 interfaces
# 1. Check cluster metrics interface
curl -I http://<MinIO_IP>:9000/minio/v2/metrics/cluster
# 2. Check bucket metrics interface
curl -I http://<MinIO_IP>:9000/minio/v2/metrics/bucket
# 3. Check resource metrics interface
curl -I http://<MinIO_IP>:9000/minio/v2/metrics/resource - Success criteria: Returns
200 OK, indicating the service and metrics interfaces are online.
- MinIO typically runs on port
-
Prepare passwordless monitoring account
MinIO's metrics interfaces require authentication by default. This configuration enables passwordless access without setting a Secret Key.
- Prerequisite: The MinIO client tool
mcof the corresponding version must be installed on the operations machine and a connection alias must be configured (example alias ismyminio). - Step 1: Define a read-only policy
Create a file named
prometheus.jsonwith the following content:{
"Version": "2012-10-17",
"Statement": [
{
"Action": ["admin:Prometheus"],
"Effect": "Allow",
"Resource": ["arn:minio:admin:::*"]
}
]
} - Step 2: Apply the policy and create a passwordless user
Execute the following mc commands to create a passwordless user and bind the policy:
# 1. Add the policy to MinIO
mc admin policy add myminio monitor_policy prometheus.json

# 2. Create a passwordless monitoring user (AccessKey: monitor, no SecretKey)
mc admin user add myminio monitor ""

# 3. Bind the read-only policy to the passwordless user
mc admin policy set myminio monitor_policy user=monitor
- Prerequisite: The MinIO client tool
Step 1: Select an Integration Plugin
- After entering Monitor, click "Integration" in the top navigation bar.
- Select resource type:
- Expand the "Middleware" category in the left menu.
- Click "MinIO".
- Click "+ Integrate" at the top right of the list.
Screenshot Guide:
- Plugin description: Collects data by accessing MinIO's built-in Prometheus metrics endpoint without installing an Agent on the MinIO node.
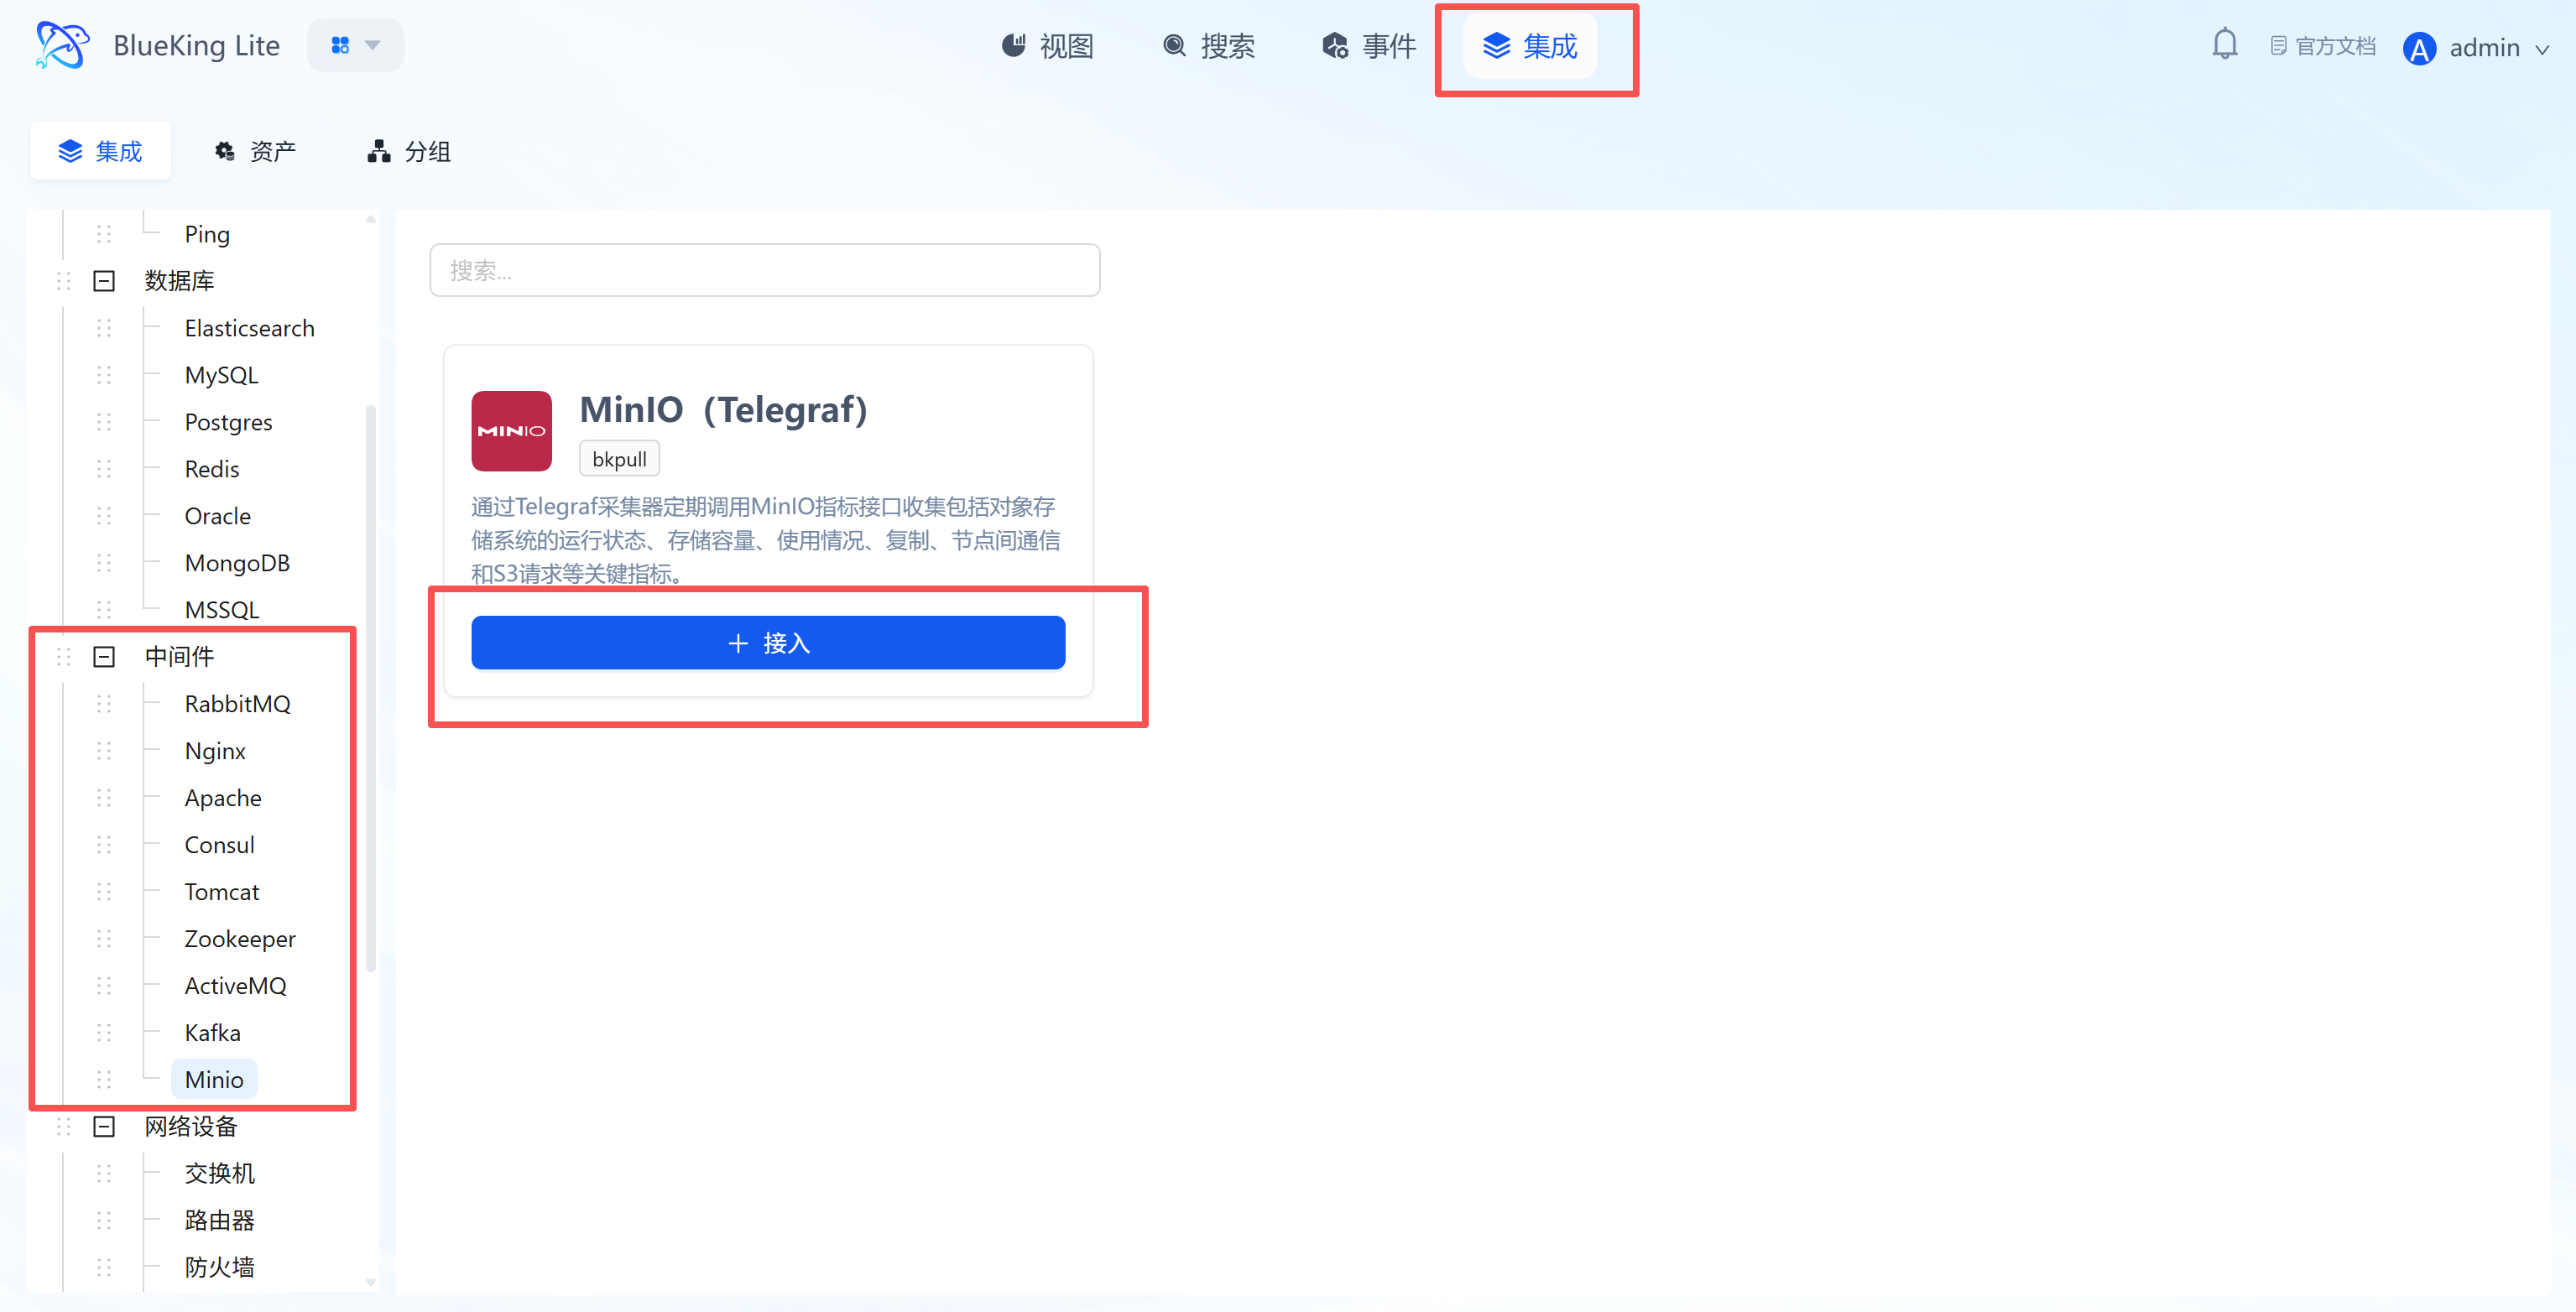
Step 2: Configure Collection Policy
In this step, you need to configure the MinIO service connection address.
- Collection configuration:
- Interval: Default is
10s, indicating the data collection frequency.
- Interval: Default is
- Configure monitoring targets:
- Node: Select a managed host as the collector (must ensure this machine can access MinIO's API port).
- Host: Enter the MinIO server's IP address.
- Port: Enter MinIO's API port (default
9000). - Instance name: It is recommended to name it "MinIO-ClusterName".
- Click "Confirm".
Screenshot Guide:
- Prerequisite: Ensure your MinIO service has Prometheus metrics enabled. The collector will access the
http://<host>:<port>/minio/prometheus/metricsendpoint to retrieve data.
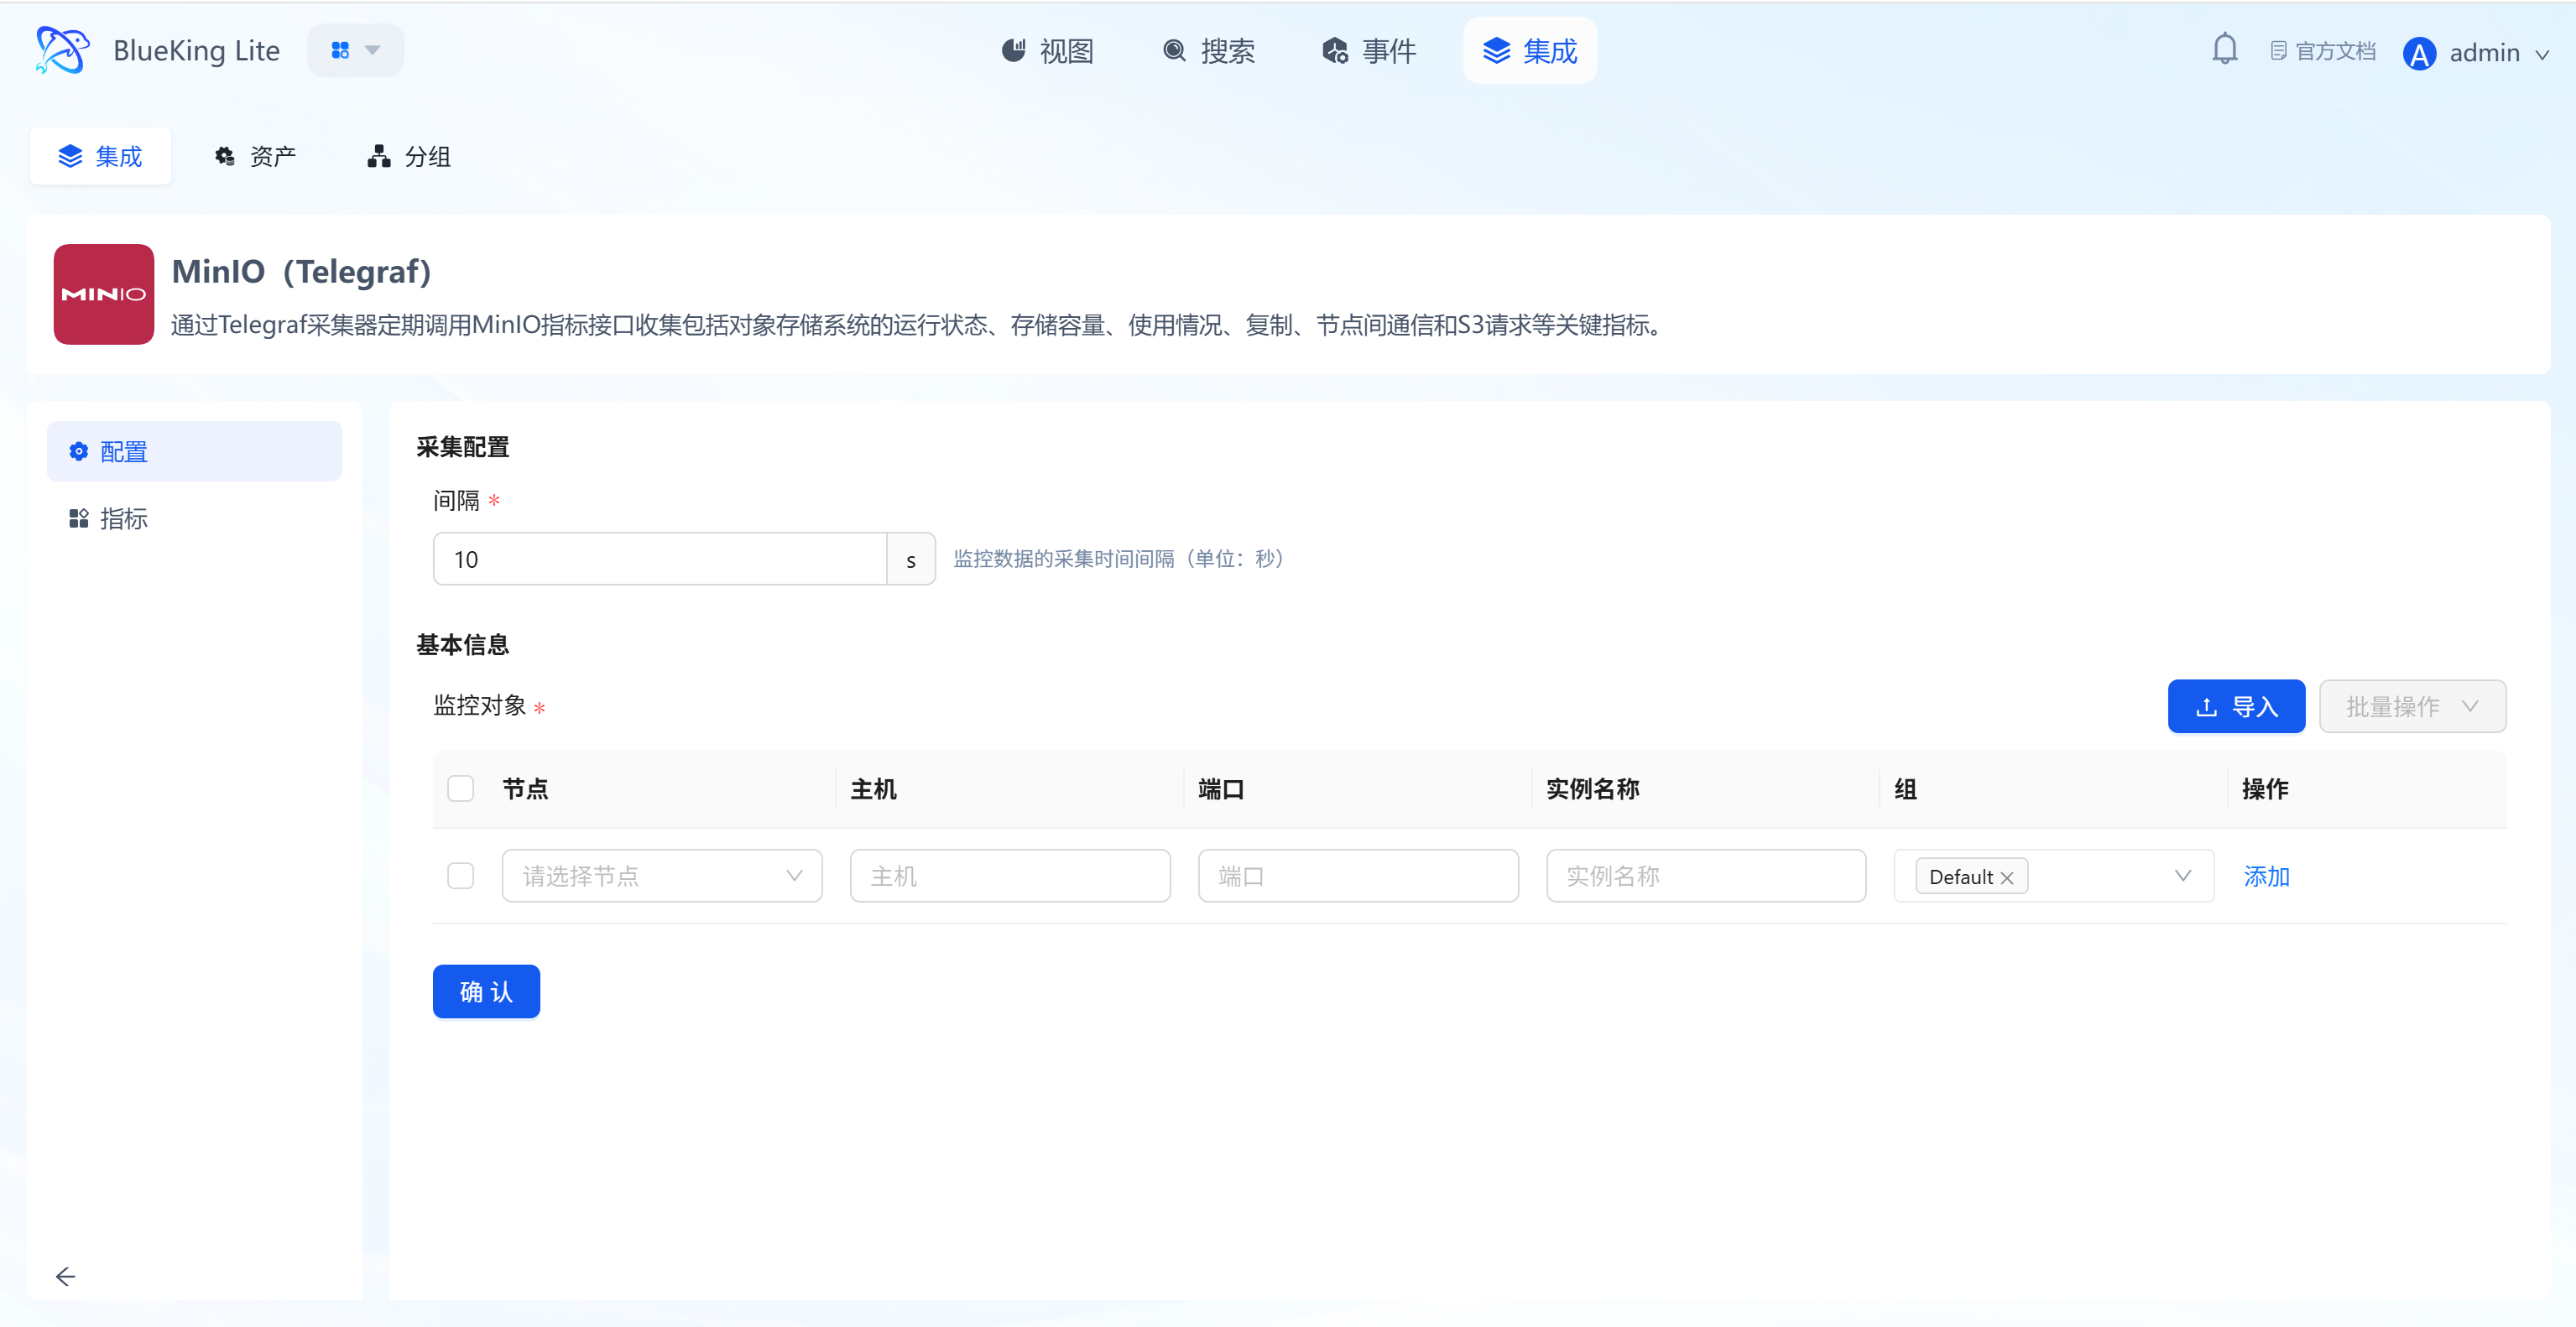
Step 3: Verify and Analyze
- Click the "View" module at the top of the page.
- In the left resource list, expand "Middleware" -> "MinIO", and click the instance name.
- Data verification:
- Total/Free Space: Monitor the cluster's total and available capacity for capacity planning and alerting.
- Nodes Offline: Monitor the number of offline nodes. For distributed deployments, this value must be 0; otherwise, the cluster is in a degraded state.
- HTTP Requests Duration: View request latency for S3 operations (such as GET, PUT, DELETE) to analyze storage performance bottlenecks.
- Network Received/Sent: Monitor MinIO's upstream and downstream network traffic.
- Total Buckets/Objects: View the total number of buckets and objects.
Network Device Monitoring
This section covers the common monitoring integration workflow for standard network devices including switches, routers, firewalls, and load balancers. Since these devices all widely support SNMP (Simple Network Management Protocol), their integration methods and configuration parameters are essentially identical.
This guide uses switches as an example for screenshots, but the steps are fully applicable to routers, firewalls, and load balancers.
Integrating Network Devices (Switches, Routers, Firewalls, Load Balancers)
Using the Telegraf collector with the SNMP protocol, periodically collect common interface metrics from network devices (such as traffic, packet loss, error packets) as well as device-specific metrics (such as CPU/memory, session count, etc.).
Step 1: Select an Integration Plugin
- After entering Monitor, click "Integration" in the top navigation bar.
- Select resource type:
- Expand the "Network Devices" category in the left menu.
- Click the specific device type you need to integrate (e.g., "Switch").
- Click "+ Integrate" at the top right of the list.
Screenshot Guide:
- Plugin description: This is a universal SNMP collection plugin applicable to all network devices that support standard MIB libraries.
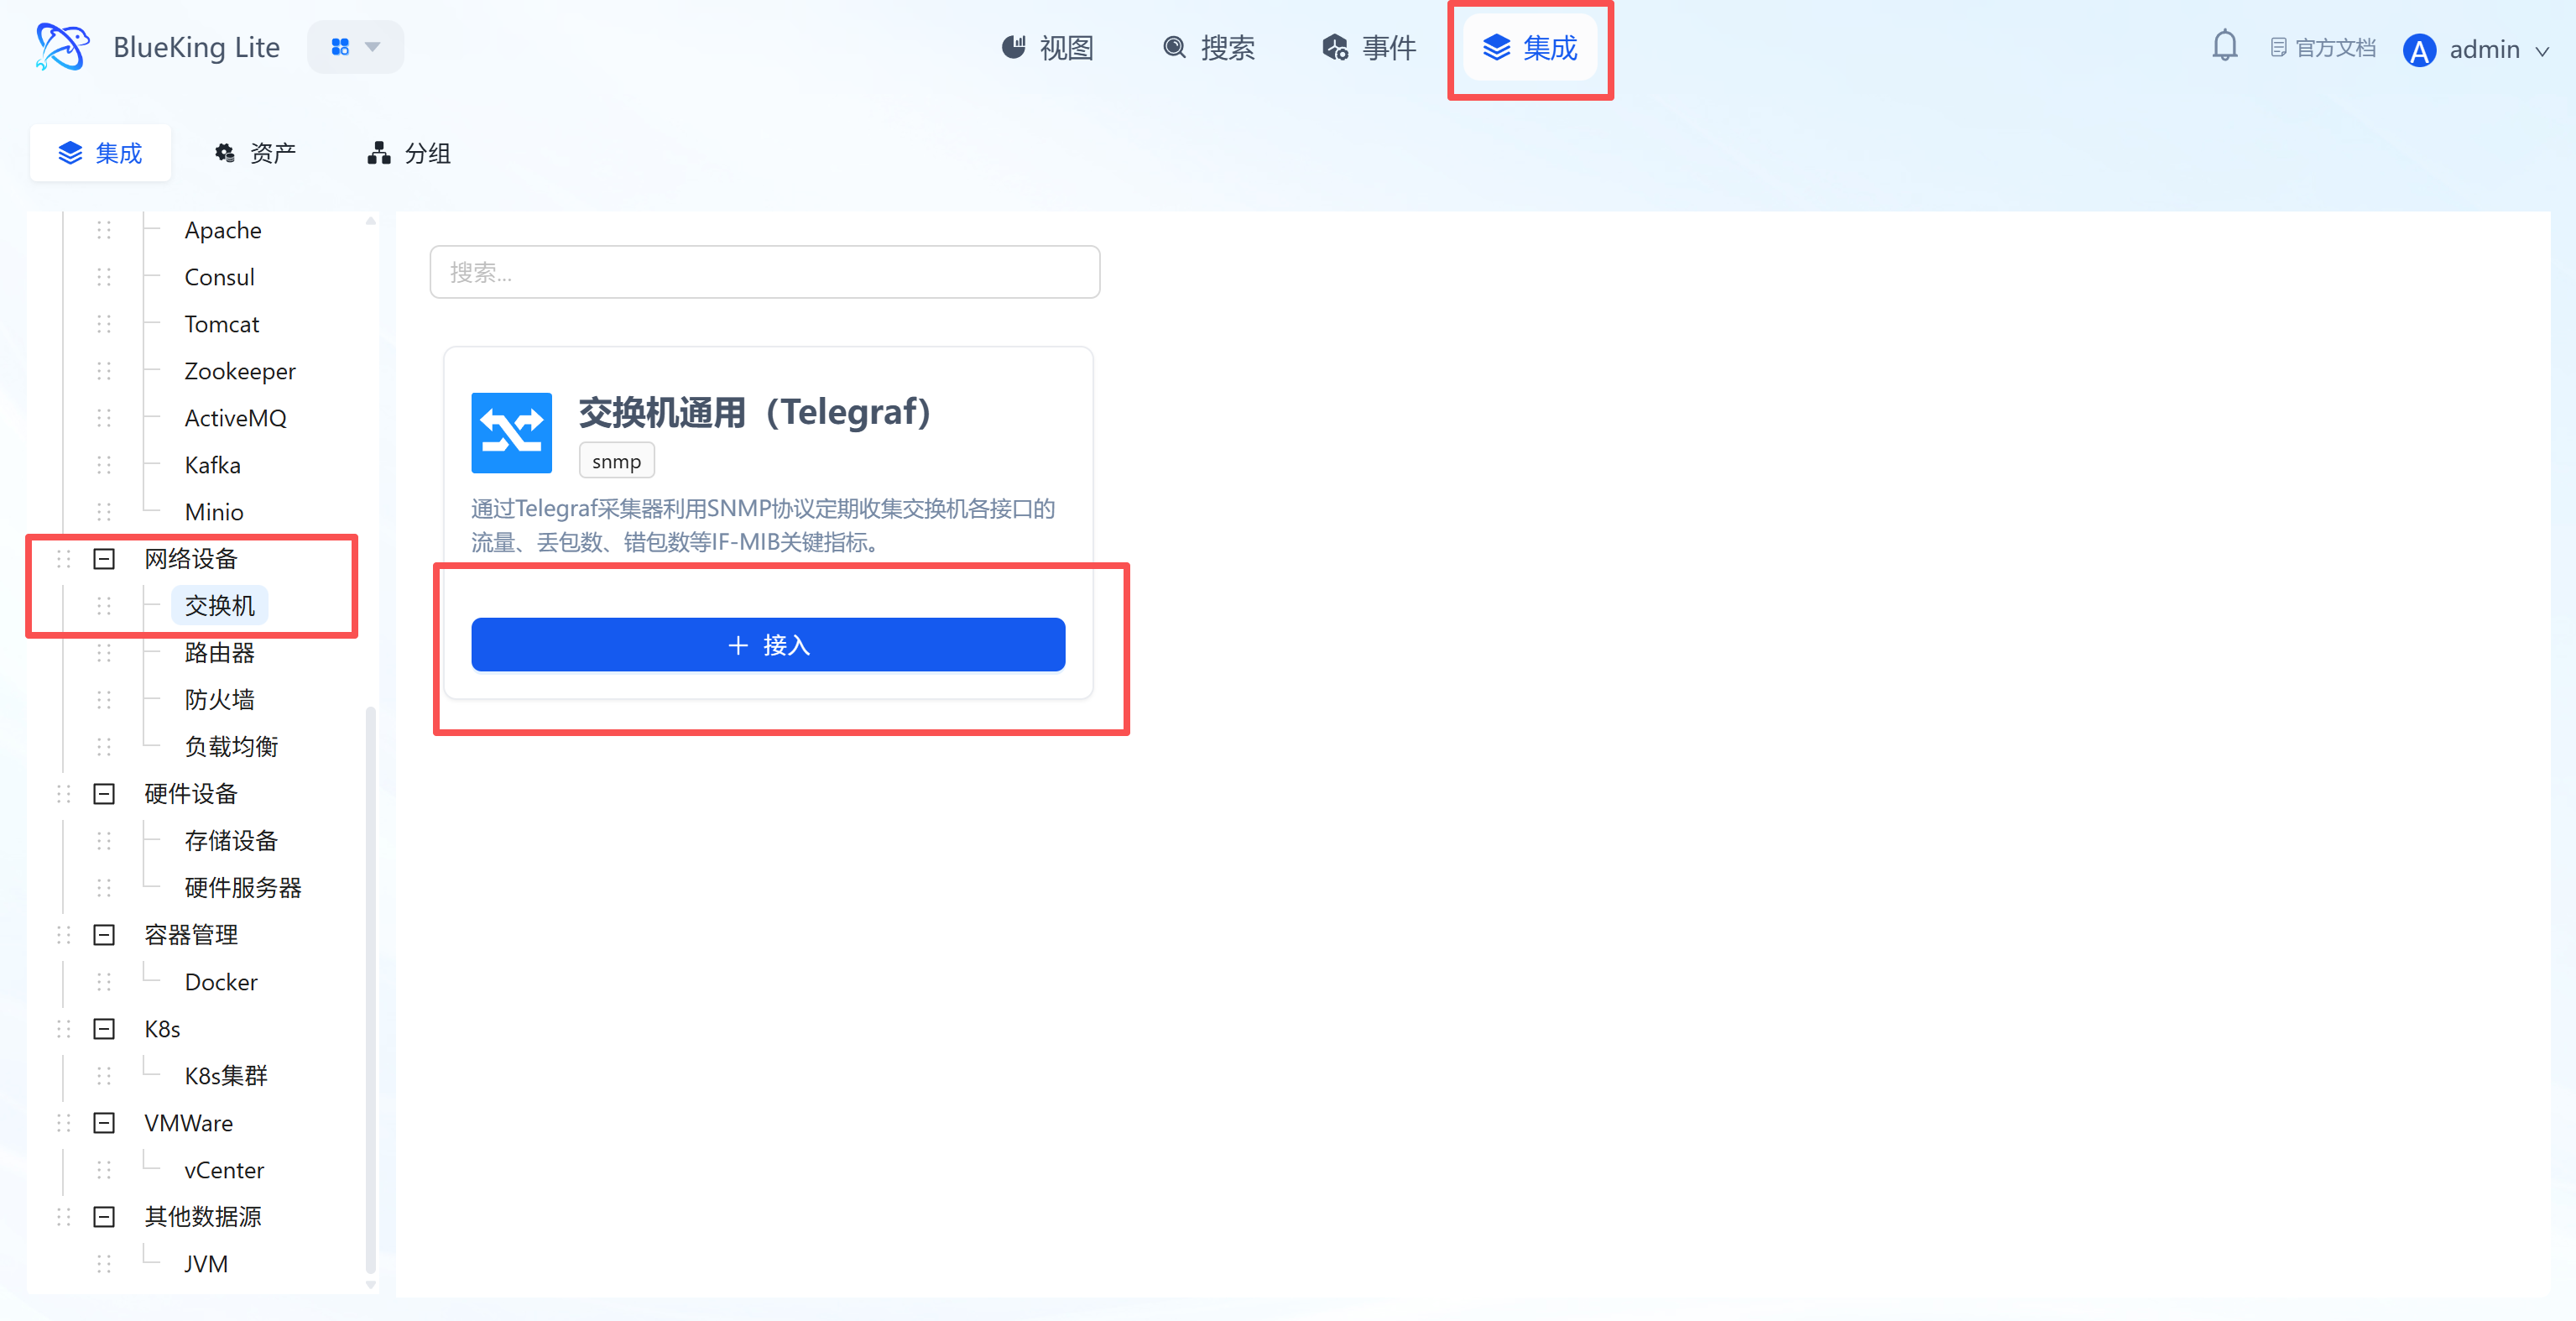
Step 2: Configure Collection Policy
In this step, you need to fill in the corresponding authentication information and device IP based on the SNMP version (v2c or v3) configured on the device.
- Collection configuration (SNMP parameters):
- Port: Enter the SNMP Agent port configured on the device, default is
161. - Version: Select the SNMP version configured on your device.
- Selecting
v2crequires filling in the "Community" field below. - Selecting
v3requires filling in the corresponding security name, level, authentication and encryption protocols/passwords, etc.
- Selecting
- Community: (v2c only) Enter the Community String used for authentication, default is
public. - Timeout: Default is
10s. - Interval: Default is
10s.
- Port: Enter the SNMP Agent port configured on the device, default is
- Configure monitoring targets:
- Node: Select a managed host as the collector (must ensure this machine has network connectivity to the target device's SNMP port).
- IP: Enter the device's management IP address.
- Instance name: It is recommended to name based on device type and purpose, for example:
Switch-Core-H3CRouter-IDC-Exit-CiscoFirewall-DMZ-PaloAltoLB-WebApp-F5
- Click "Confirm".
Screenshot Guide (v2c example):
- Prerequisite: Be sure to enable the SNMP service on your target device first, configure the corresponding authentication method based on the selected version (community string or v3 user), and ensure the collector IP is in the device's access control list (ACL).
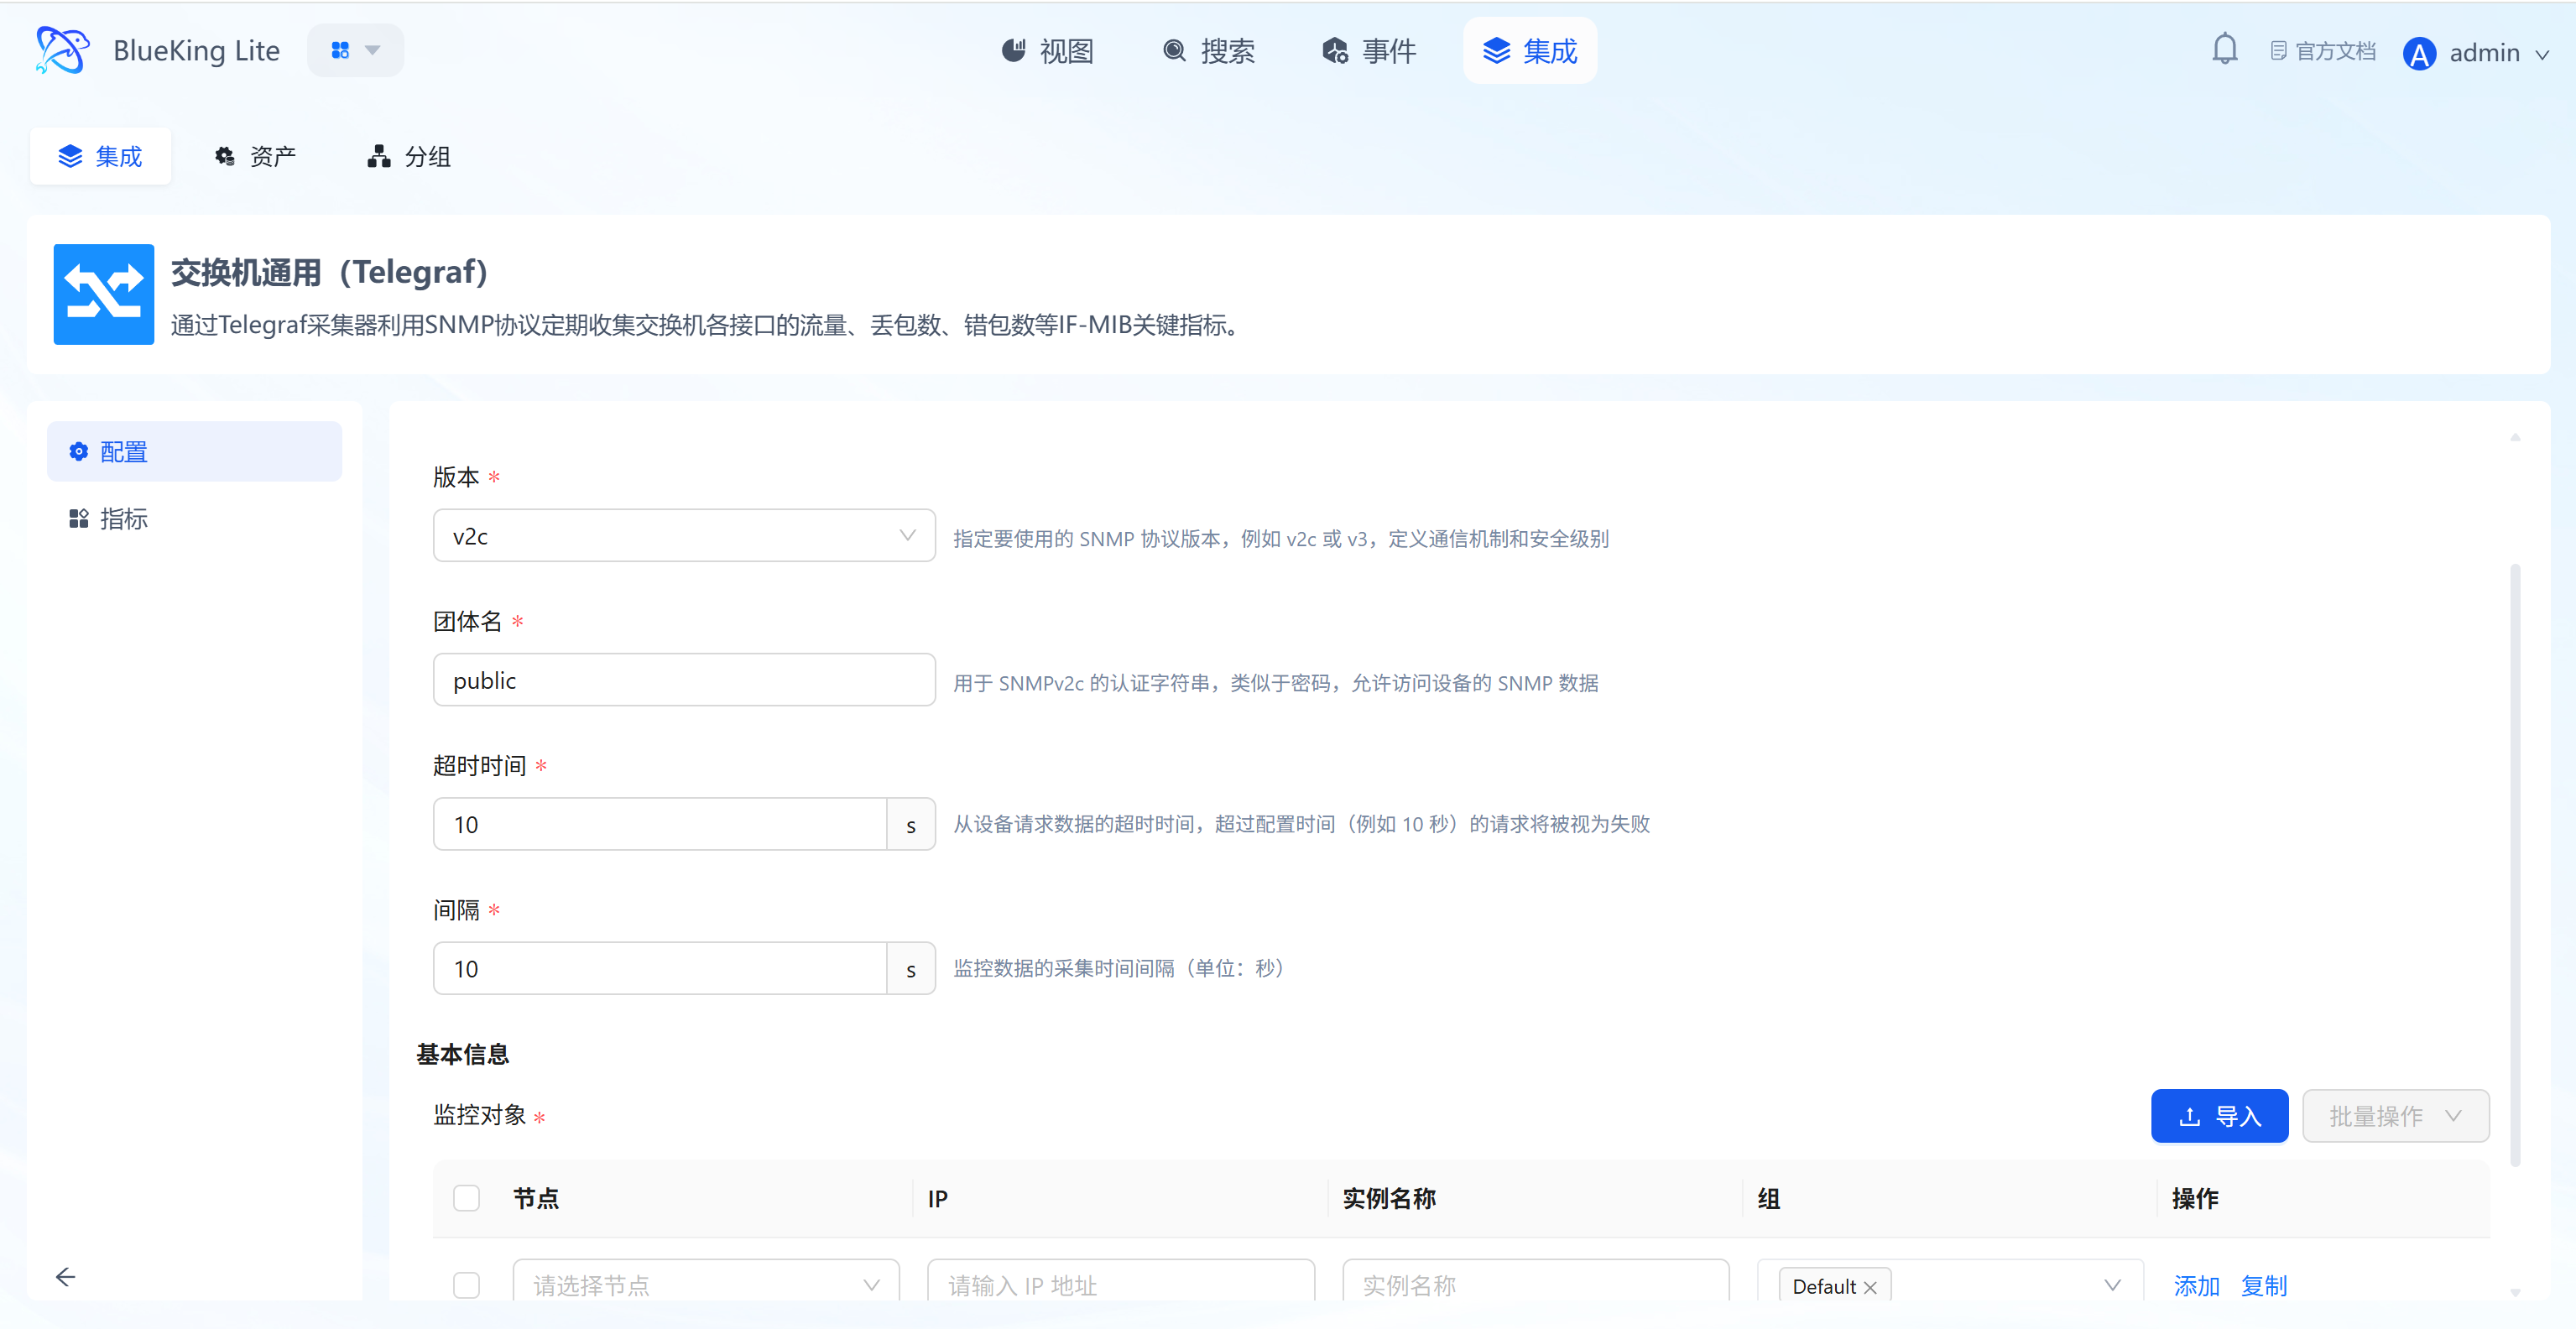
Step 3: Verify and Analyze
- Click the "View" module at the top of the page.
- In the left resource list, expand "Network Devices" -> click the corresponding device type (e.g., "Switch"), then click the instance name.
- Data verification:
- Common interface metrics (IF-MIB):
- Interface Traffic: Monitor inbound/outbound traffic on each port to determine network load.
- Interface Discards/Errors: Monitor port packet loss and error packets to troubleshoot congestion or physical link issues.
- Interface Status: Monitor port online status (
up/down).
- Device-specific metrics (vendor private MIB):
- Routers/Switches: Typically include CPU and memory utilization.
- Firewalls: Monitor concurrent connection count and NAT session count.
- Load Balancers: Monitor virtual server (VS) connection count, backend pool member status, and health check conditions.
- Common interface metrics (IF-MIB):
Hardware Device Monitoring
This section covers the monitoring integration workflow for storage devices and hardware servers. There are typically two protocols for monitoring hardware devices:
- IPMI (Intelligent Platform Management Interface): Monitors the lowest-level physical status through the device's independent management port (out-of-band), such as temperature, fans, power supplies, etc. This is the core method for monitoring hardware health and is supported by both storage devices and hardware servers.
- SNMP (Simple Network Management Protocol): Primarily monitors network interface traffic status through the device operating system (in-band). This method is typically used for hardware servers.
Generic IPMI Integration (Storage Devices and Hardware Servers)
This method communicates directly with the hardware's management chip (such as Dell iDRAC, HP iLO) via the IPMI protocol, enabling OS-independent low-level hardware monitoring.
This guide uses storage devices as an example for screenshots, but the steps are fully applicable to hardware servers for IPMI integration.
Step 1: Select the IPMI Plugin
- After entering Monitor, click "Integration" in the top navigation bar.
- Select resource type:
- Expand the "Hardware Devices" category in the left menu.
- Click "Storage Devices" or "Hardware Servers".
- Select the plugin with "IPMI Generic" in the name and click "+ Integrate".
Screenshot Guide:
- Plugin description: IPMI is the core monitoring method for ensuring the physical safety of servers, storage, and other hardware.
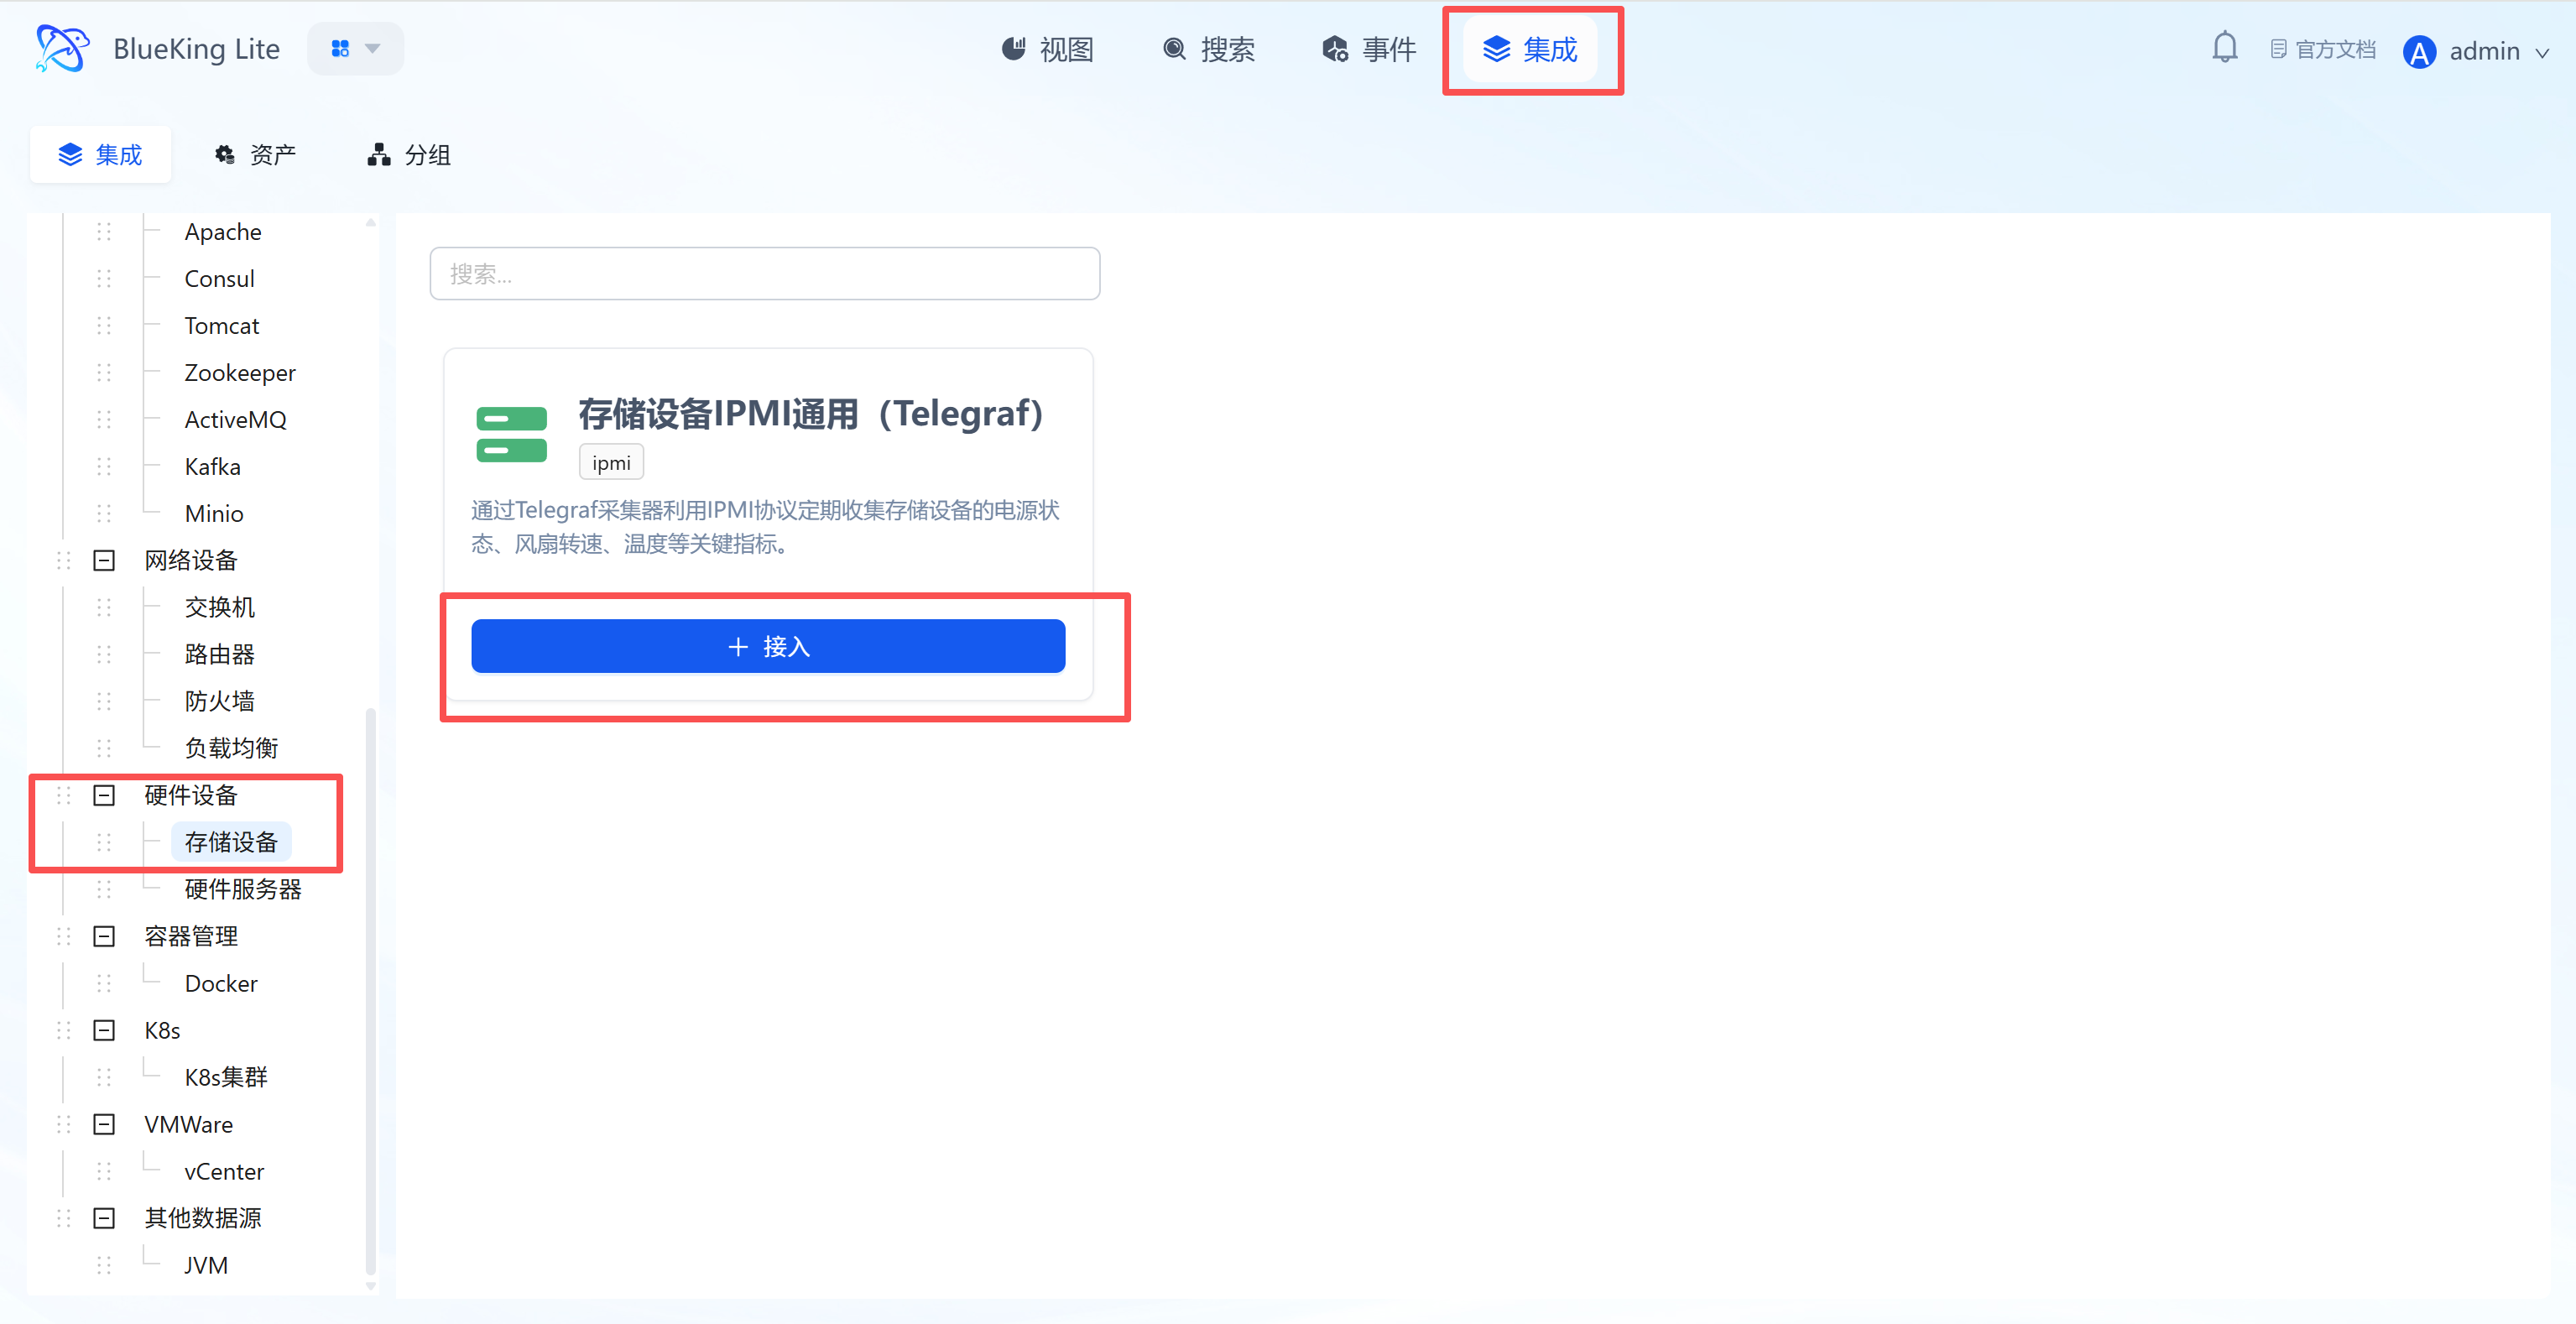
Step 2: Configure IPMI Policy
In this step, you need to configure the device's IPMI management port address and authentication credentials.
- Collection configuration (IPMI parameters):
- Username: Enter the IPMI management port login username (e.g.,
admin,root). - Password: Enter the corresponding password.
- Timeout: Default is
20s(IPMI responses can be slow; it is recommended to set a longer timeout). - Interval: Default is
60s(hardware status changes infrequently, so high frequency is unnecessary).
- Username: Enter the IPMI management port login username (e.g.,
- Configure monitoring targets:
- Node: Select a managed host as the collector (must ensure this machine has network connectivity to the target device's IPMI management port).
- IP: Enter the device's IPMI management port IP address.
- Instance name: It is recommended to name based on device purpose, e.g.,
Storage-Ceph-Node01orServer-ESXi-Host05.
- Click "Confirm".
Screenshot Guide:
- Ensure that IPMI over LAN is enabled in the device's out-of-band management plane (such as iDRAC, iLO).
- The collection task depends on the
ipmitoolutility. Ensure the collector node has this tool installed.
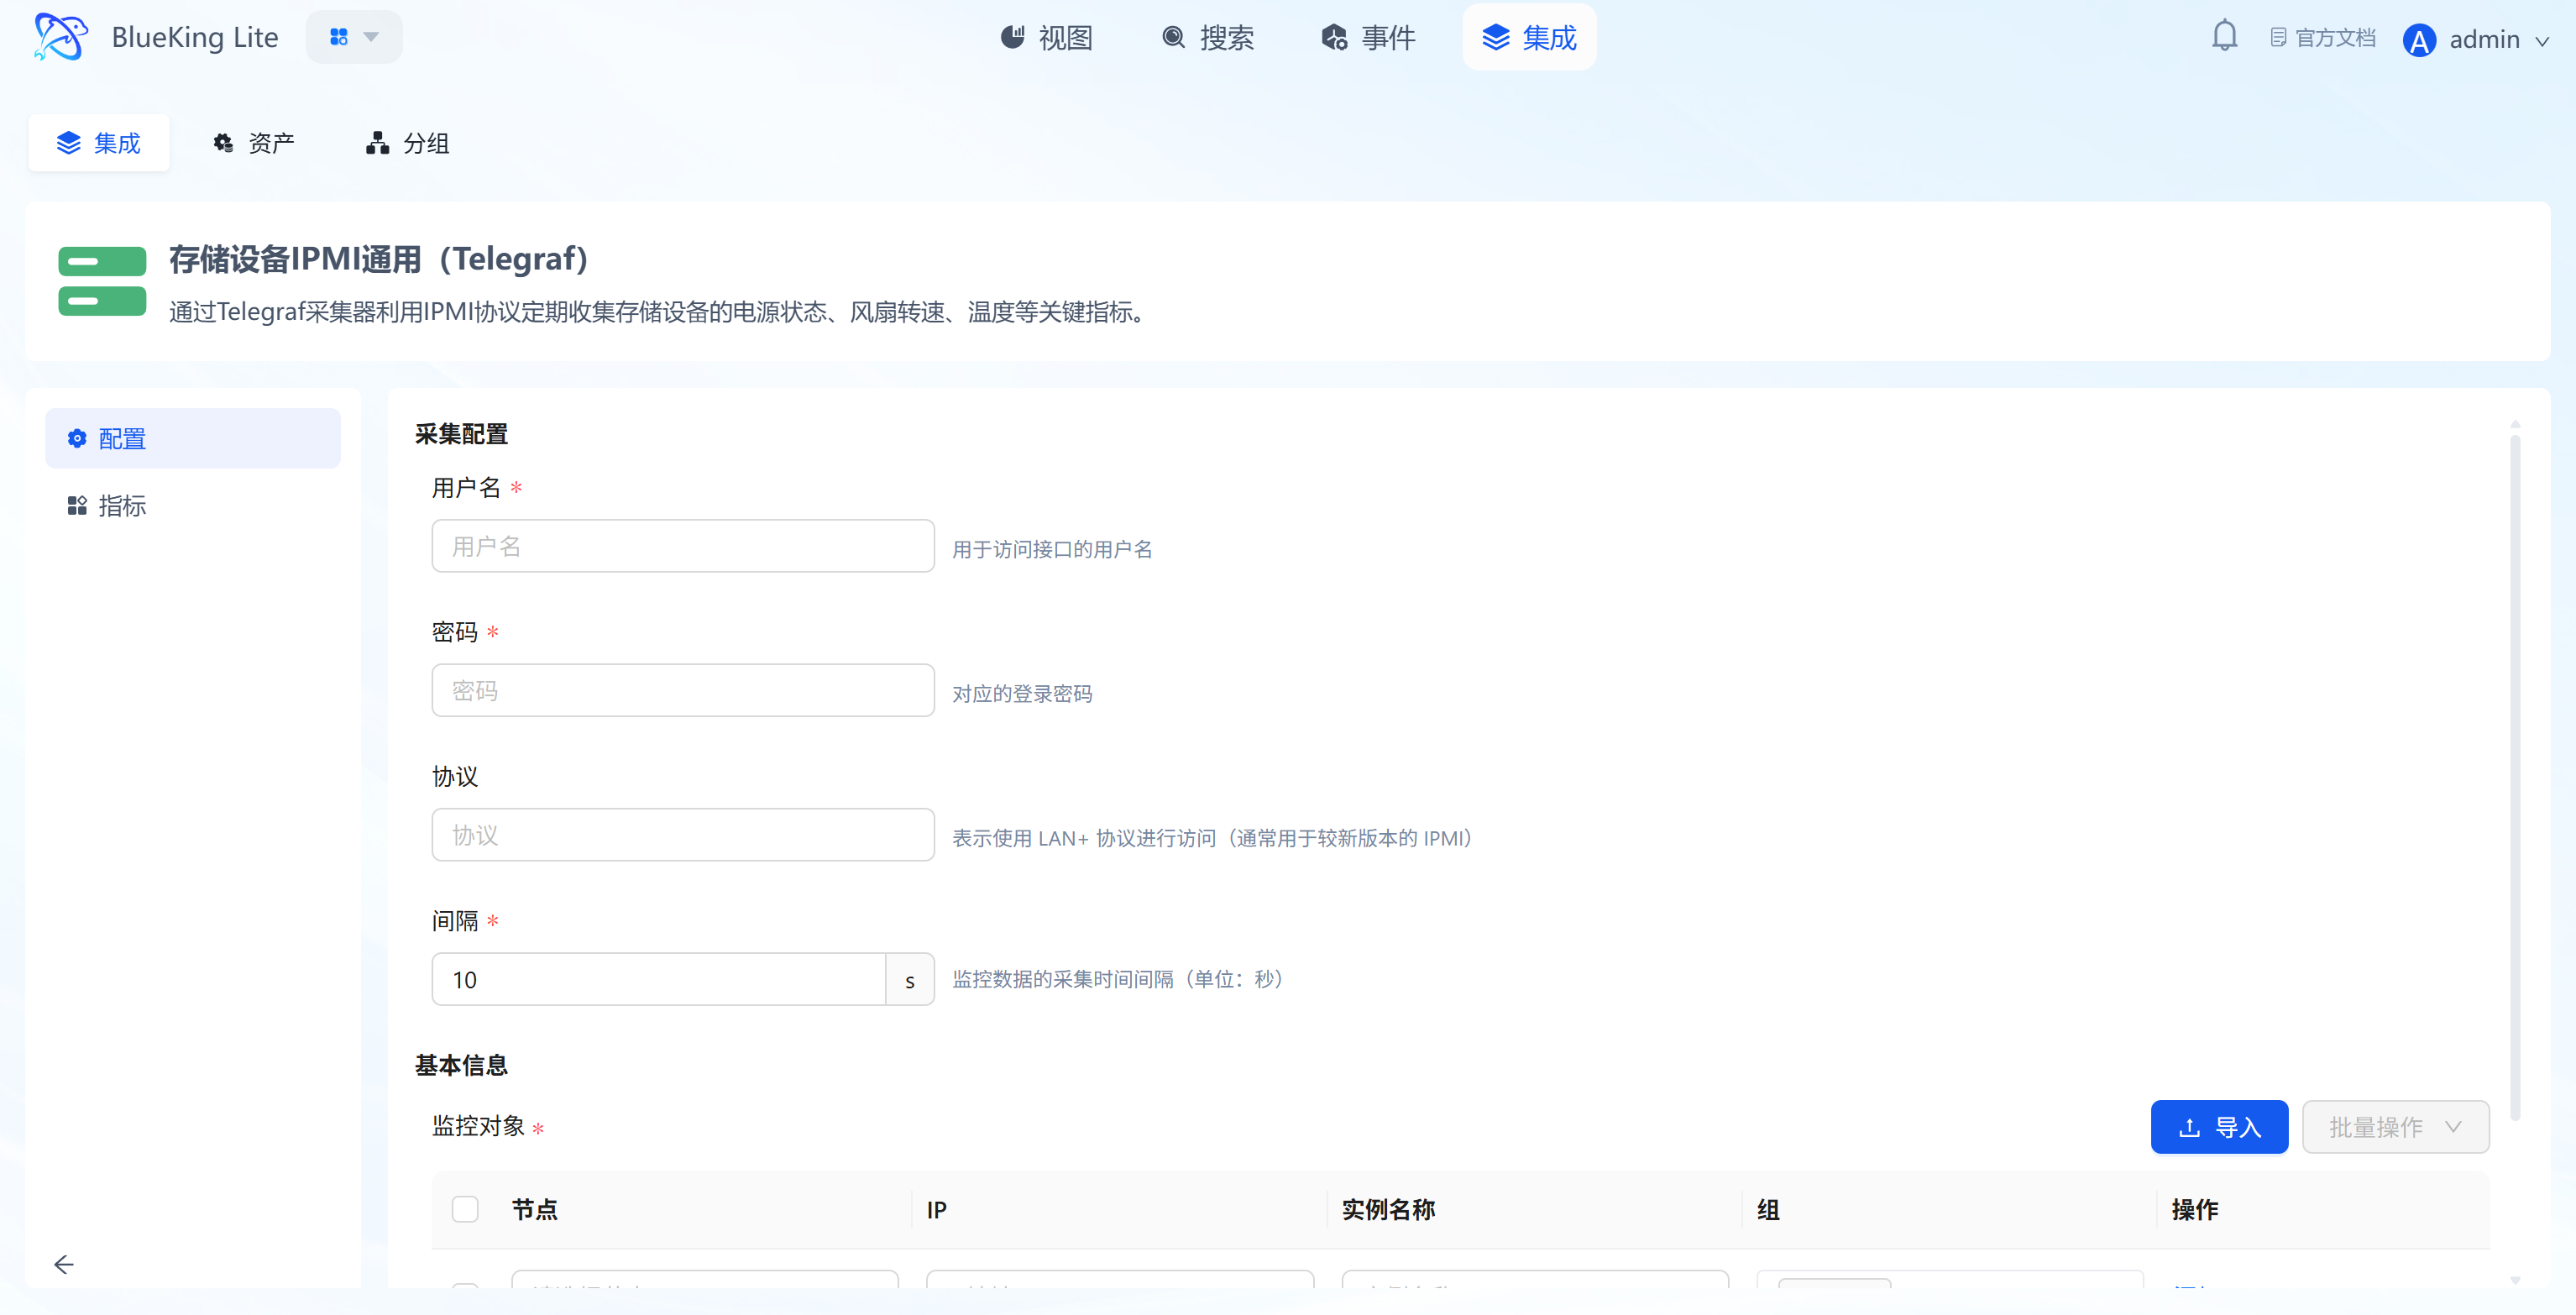
SNMP Integration for Hardware Servers
This method is primarily used to supplement monitoring of server operating system NIC traffic and other information. Its configuration is identical to monitoring network devices.
Step 1: Select the SNMP Plugin
- Enter "Integration" -> "Hardware Devices" -> "Hardware Servers".
- Select the "Hardware Server SNMP Generic" plugin and click "+ Integrate".
Screenshot Guide:
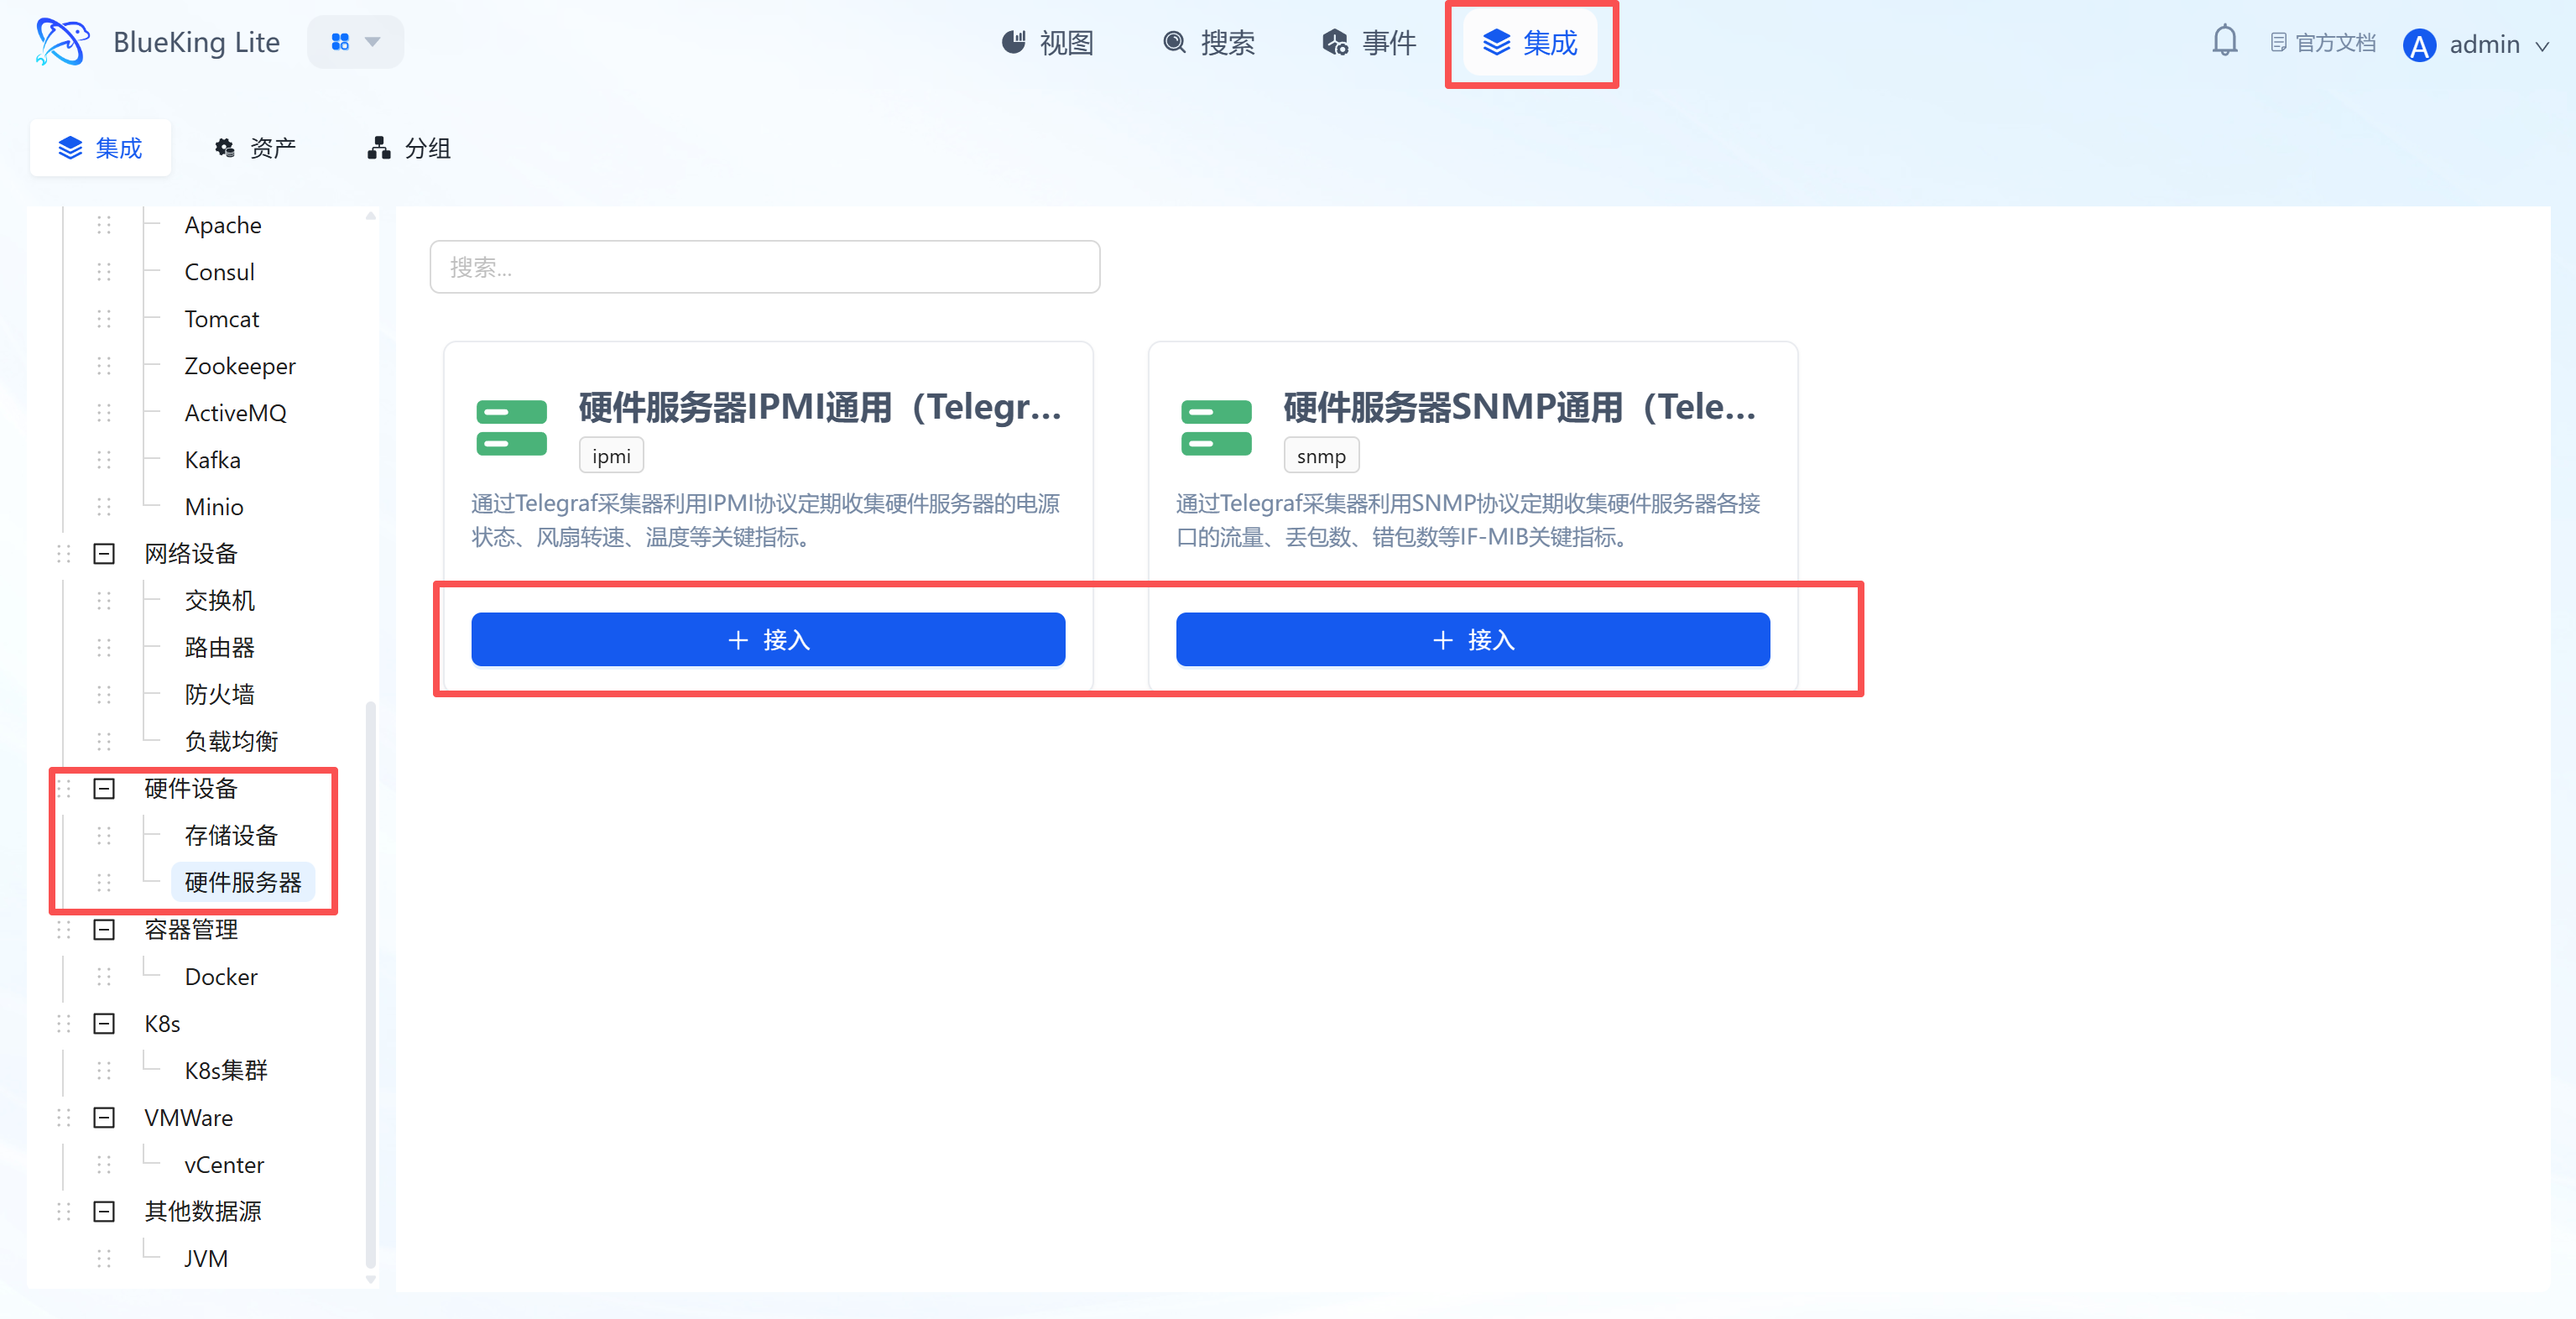
Step 2: Configure SNMP Policy
- Collection configuration: Follow the exact same steps as described in the "Network Device Monitoring (Generic SNMP Integration)" section's Step 2, entering the server's business IP and SNMP parameters.
- Instance name: It is recommended to name it
Server-IDC1-Host05-SNMPfor distinction. - Click "Confirm".
Screenshot Guide:
- SNMP service must be installed and enabled in the server's operating system (Windows or Linux).
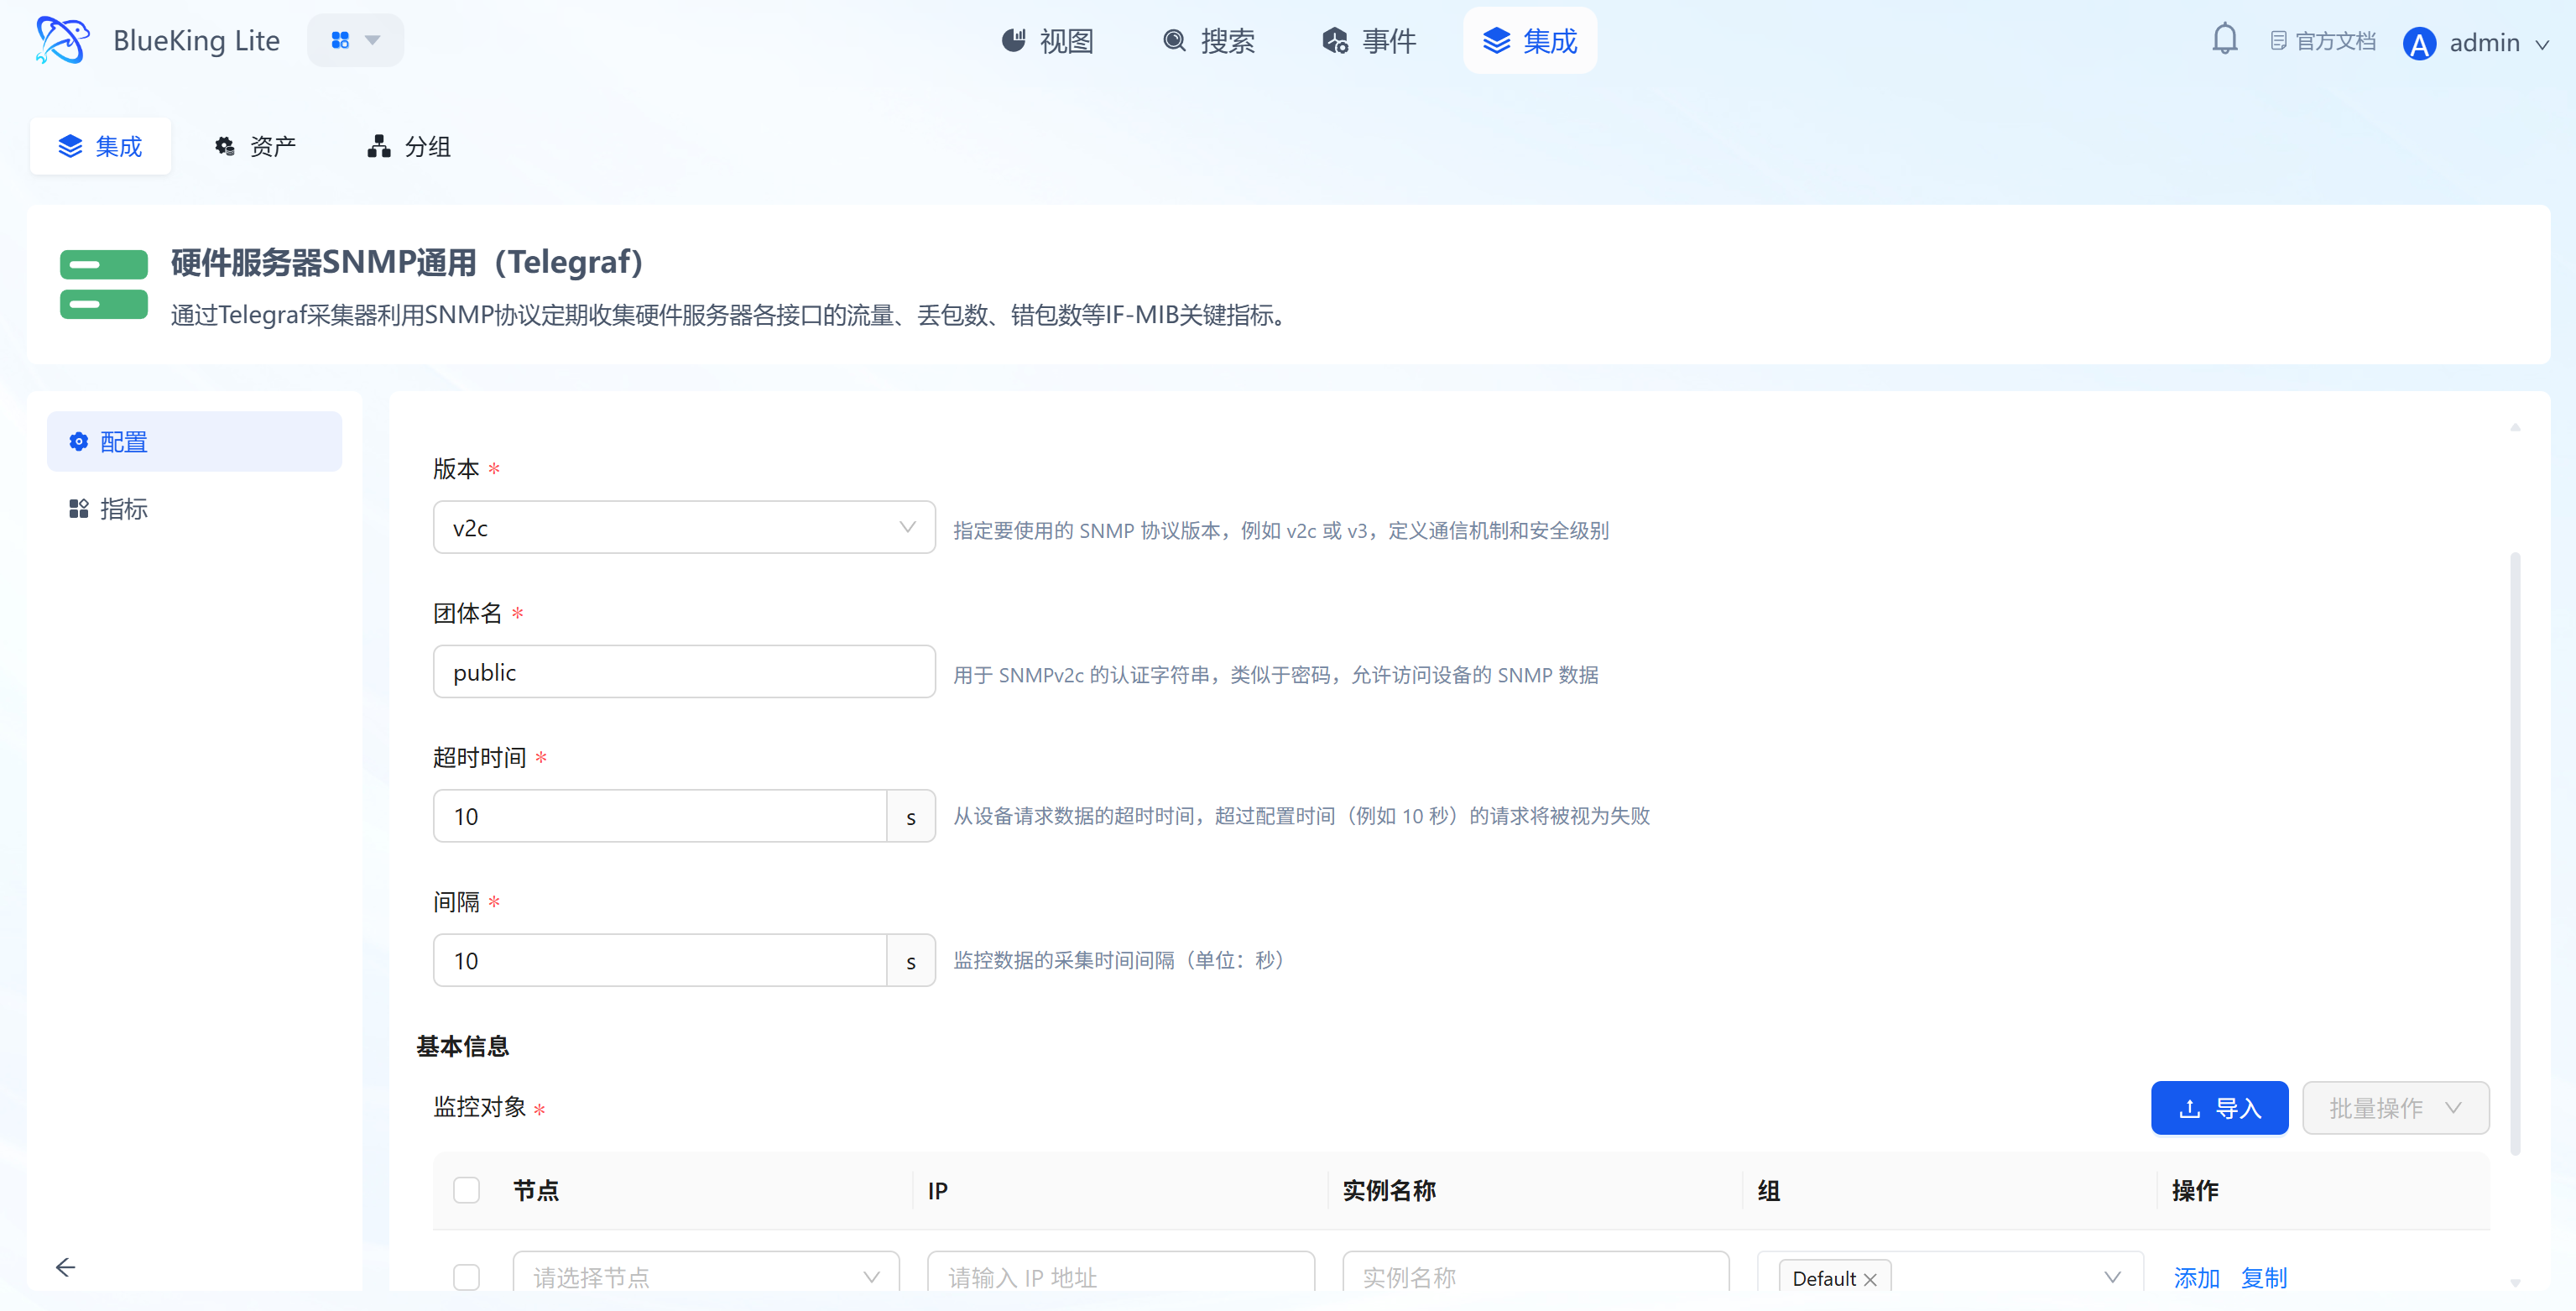
Step 3: Unified Verification and Analysis
- Click the "View" module at the top of the page.
- In the left resource list, expand "Hardware Devices" -> click the corresponding device type, then click the instance name.
- Data verification:
- For IPMI instances: Focus on Temperature, Fan Speed, and Power Supply sensor readings to ensure hardware is operating within safe ranges.
- For SNMP instances (hardware servers only): View inbound/outbound traffic, packet loss, and error packet data for each network interface (e.g.,
eth0,bond0) on the server.
Container Management
This section covers the monitoring integration workflow for mainstream container platforms including Docker and Kubernetes.
Integrating Docker
Connect to the Docker Engine API endpoint via the Telegraf collector to collect core performance metrics for each container including CPU, memory, network IO, and disk IO.
Step 1: Select an Integration Plugin
- After entering Monitor, click "Integration" in the top navigation bar.
- Select resource type:
- Expand the "Container Management" category in the left menu.
- Click "Docker".
- Click "+ Integrate" at the top right of the list.
Screenshot Guide:
- Plugin description: Collects data through the standard interface provided by the Docker Daemon without deploying an Agent inside each container.
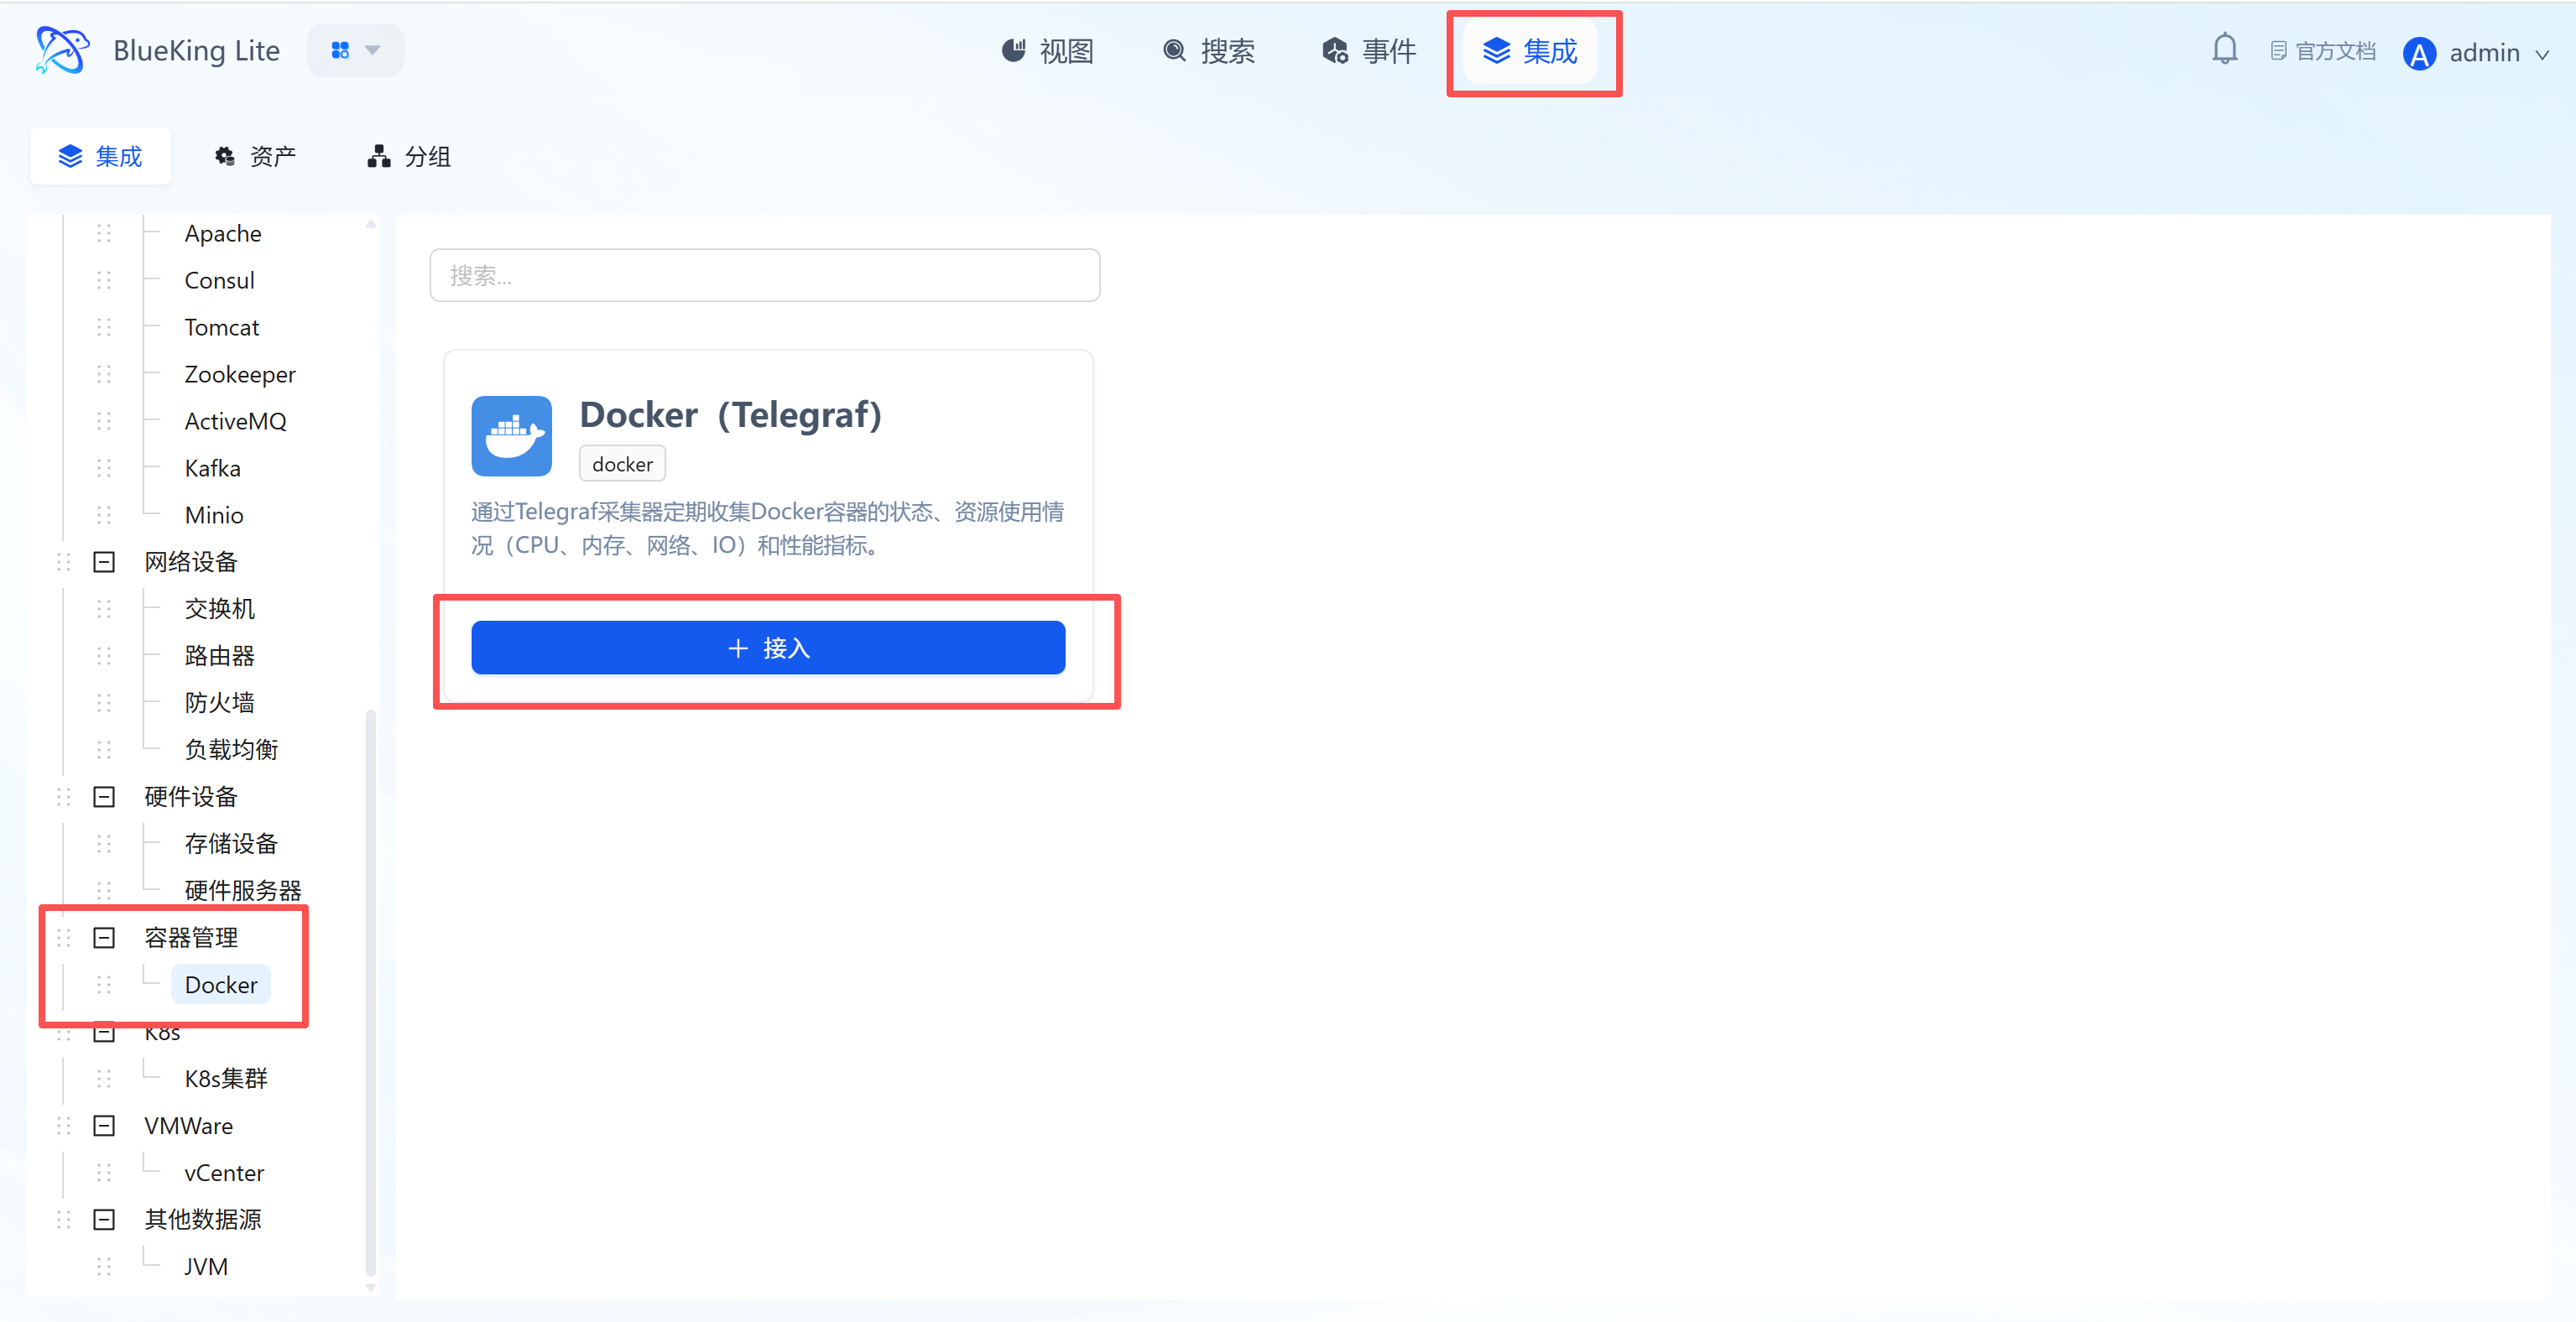
Step 2: Configure Collection Policy
In this step, you need to specify the Docker Daemon's API endpoint address.
- Collection configuration:
- Interval: Default is
10s, indicating the data collection frequency.
- Interval: Default is
- Configure monitoring targets:
- Node: Select a managed host as the collector (typically must be the host where Docker is running).
- Endpoint: Enter the Docker Daemon's API address.
- Default value:
unix:///var/run/docker.sock - This communicates through a local socket file, which is also the safest and most efficient method.
- Default value:
- Instance name: It is recommended to name it "Docker-HostIP".
- Click "Confirm".
Screenshot Guide:
- Key configuration: Ensure the Telegraf process (typically the
telegrafuser) has read/write permissions for the/var/run/docker.sockfile. Usually, you need to add thetelegrafuser to thedockeruser group (sudo usermod -aG docker telegraf) and restart the Telegraf service.

Step 3: Verify and Analyze
- Click the "View" module at the top of the page.
- In the left resource list, expand "Container Management" -> "Docker", and click the instance name.
- Data verification:
- Total Containers: Monitor the total count of running, stopped, and paused containers.
- CPU Usage: View CPU usage for each container to quickly identify containers consuming large amounts of CPU resources.
- Memory Usage: Monitor container memory usage, RSS, etc. — key for troubleshooting memory leaks.
- Network IO: View container network receive/send traffic to analyze container network activity.
- Block IO: Monitor container disk read/write activity to locate IO-intensive applications.
Kubernetes (K8s) Monitoring
This section covers the monitoring integration workflow for Kubernetes (K8s) clusters. By deploying a lightweight collector within the cluster via kubectl, automated collection of performance metrics, status, and health information for cluster nodes, containers, and Pods is achieved.
Integrating K8s Cluster
K8s monitoring leverages the cluster's active reporting capability to synchronize the entire cluster's topology and operational data in real time.
Step 1: Select an Integration Plugin
- After entering Monitor, click "Integration" in the top navigation bar.
- Select resource type:
- Expand the "Container Management" category in the left menu.
- Click "K8s".
- Click "+ Integrate" in the list.
Screenshot Guide:
- Plugin description: Supports actively collecting Kubernetes cluster status and health, covering core performance metrics for Nodes, Containers, and Pods.
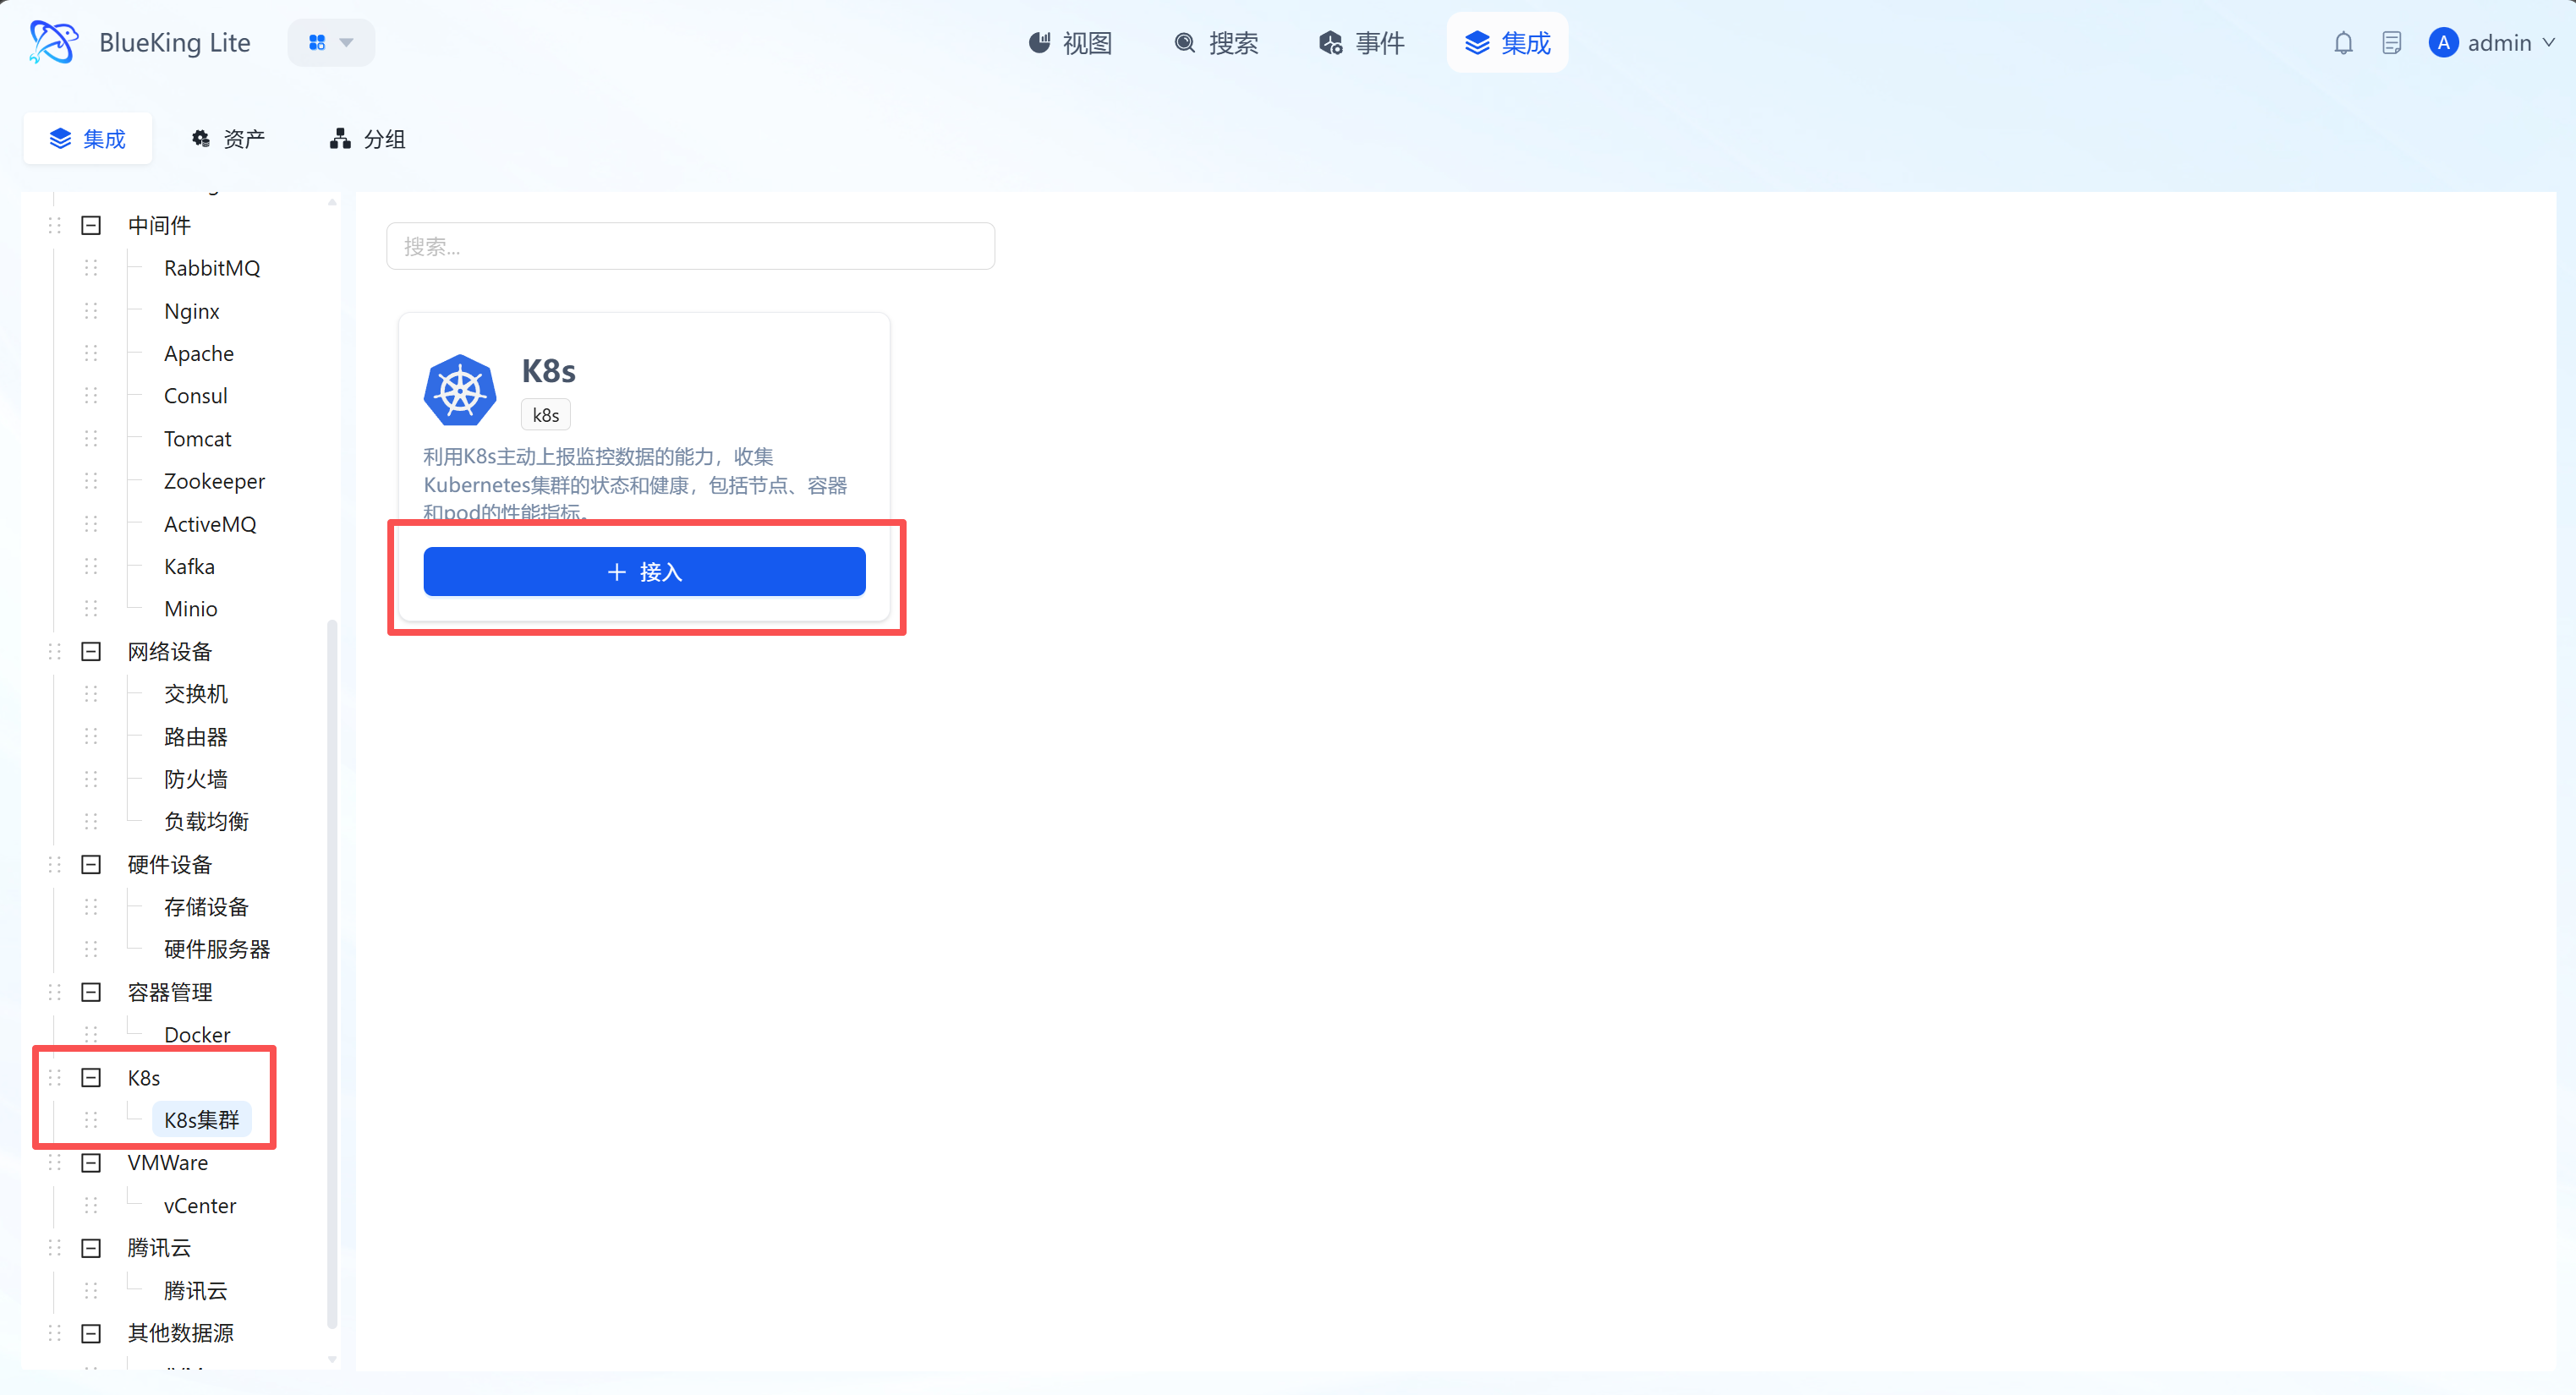
Step 2: Integration Configuration and Prerequisites
Before starting configuration, ensure your environment meets the following prerequisites:
- Kubernetes version: >= 1.16.
- Resource reservation: It is recommended to reserve 1 Core CPU and 2GB memory per node for running the collector.
- Permission requirements: Cluster administrator privileges (
kubectlaccess).
Configuration parameter descriptions:
- Integration asset:
- Create new asset: Select this if you are integrating this cluster for the first time to create a new K8s cluster resource.
- Select existing asset: Provides integration guidance based on existing asset information.
- Cluster name: Define an easily identifiable name for the cluster (e.g.,
Production-K8s-Aliyun). - Organization/Cloud region: Select the business organization and network region the cluster belongs to.
- Reporting interval: Default is
60s. A shorter interval provides higher data timeliness but correspondingly increases network and system load.
Screenshot Guide:
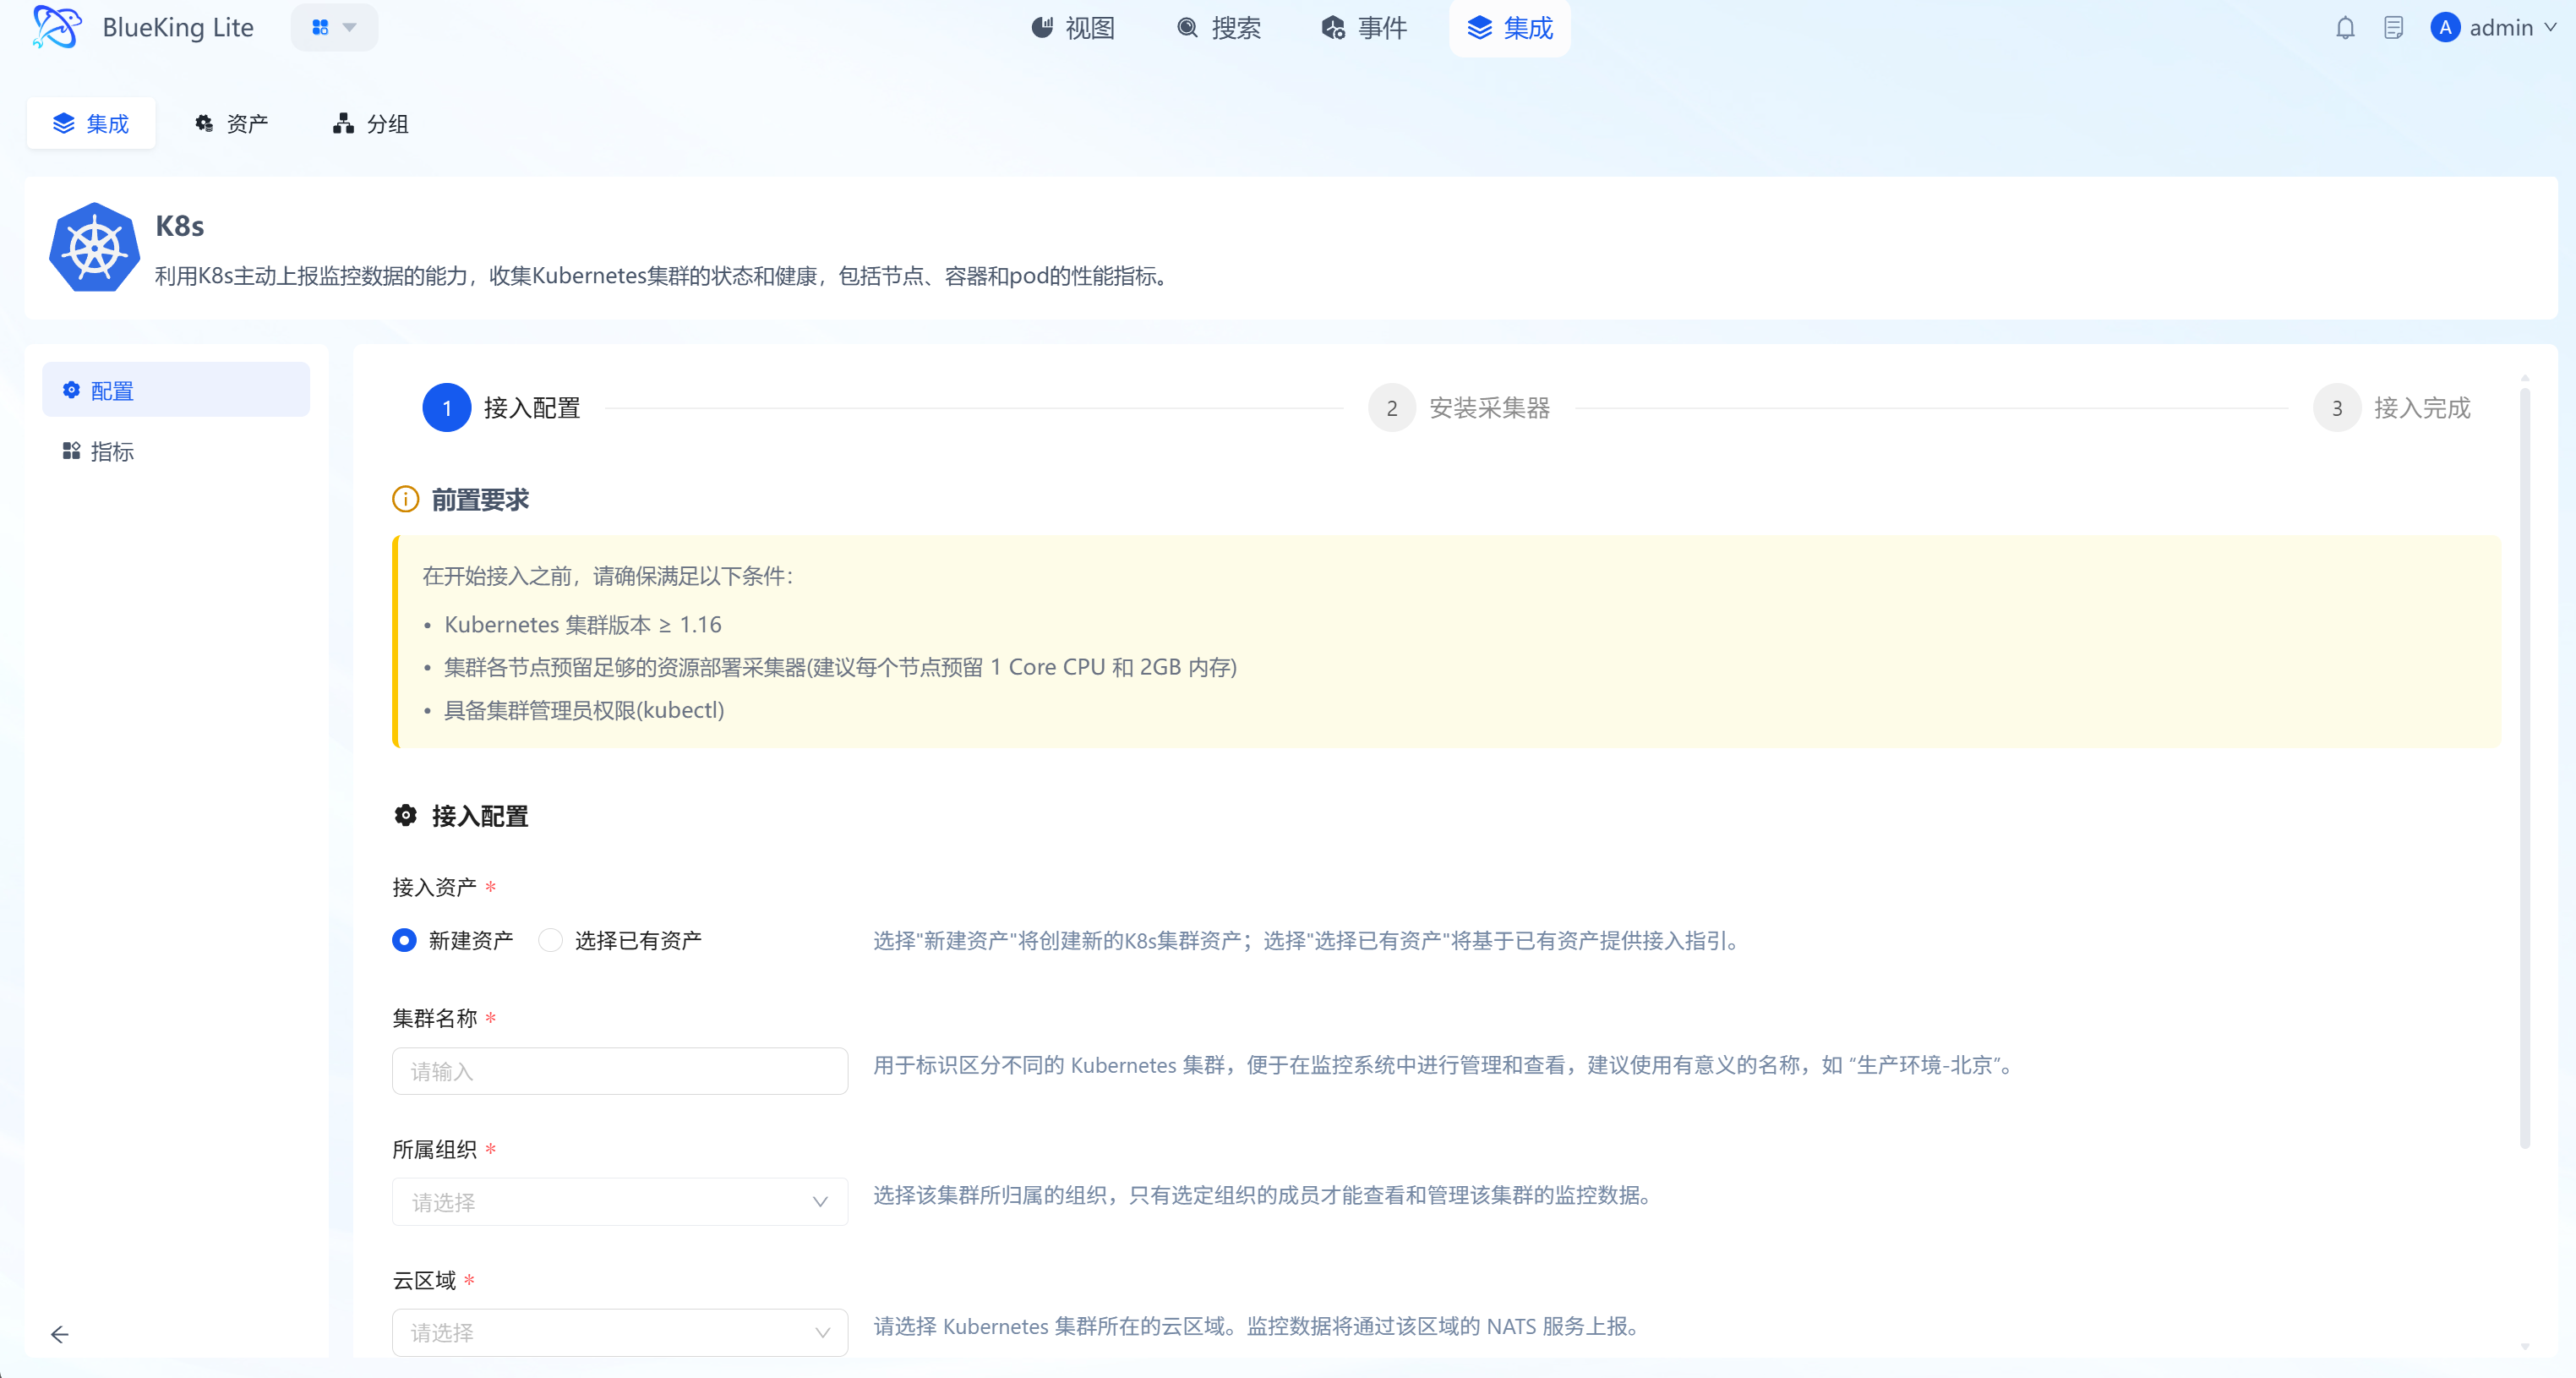
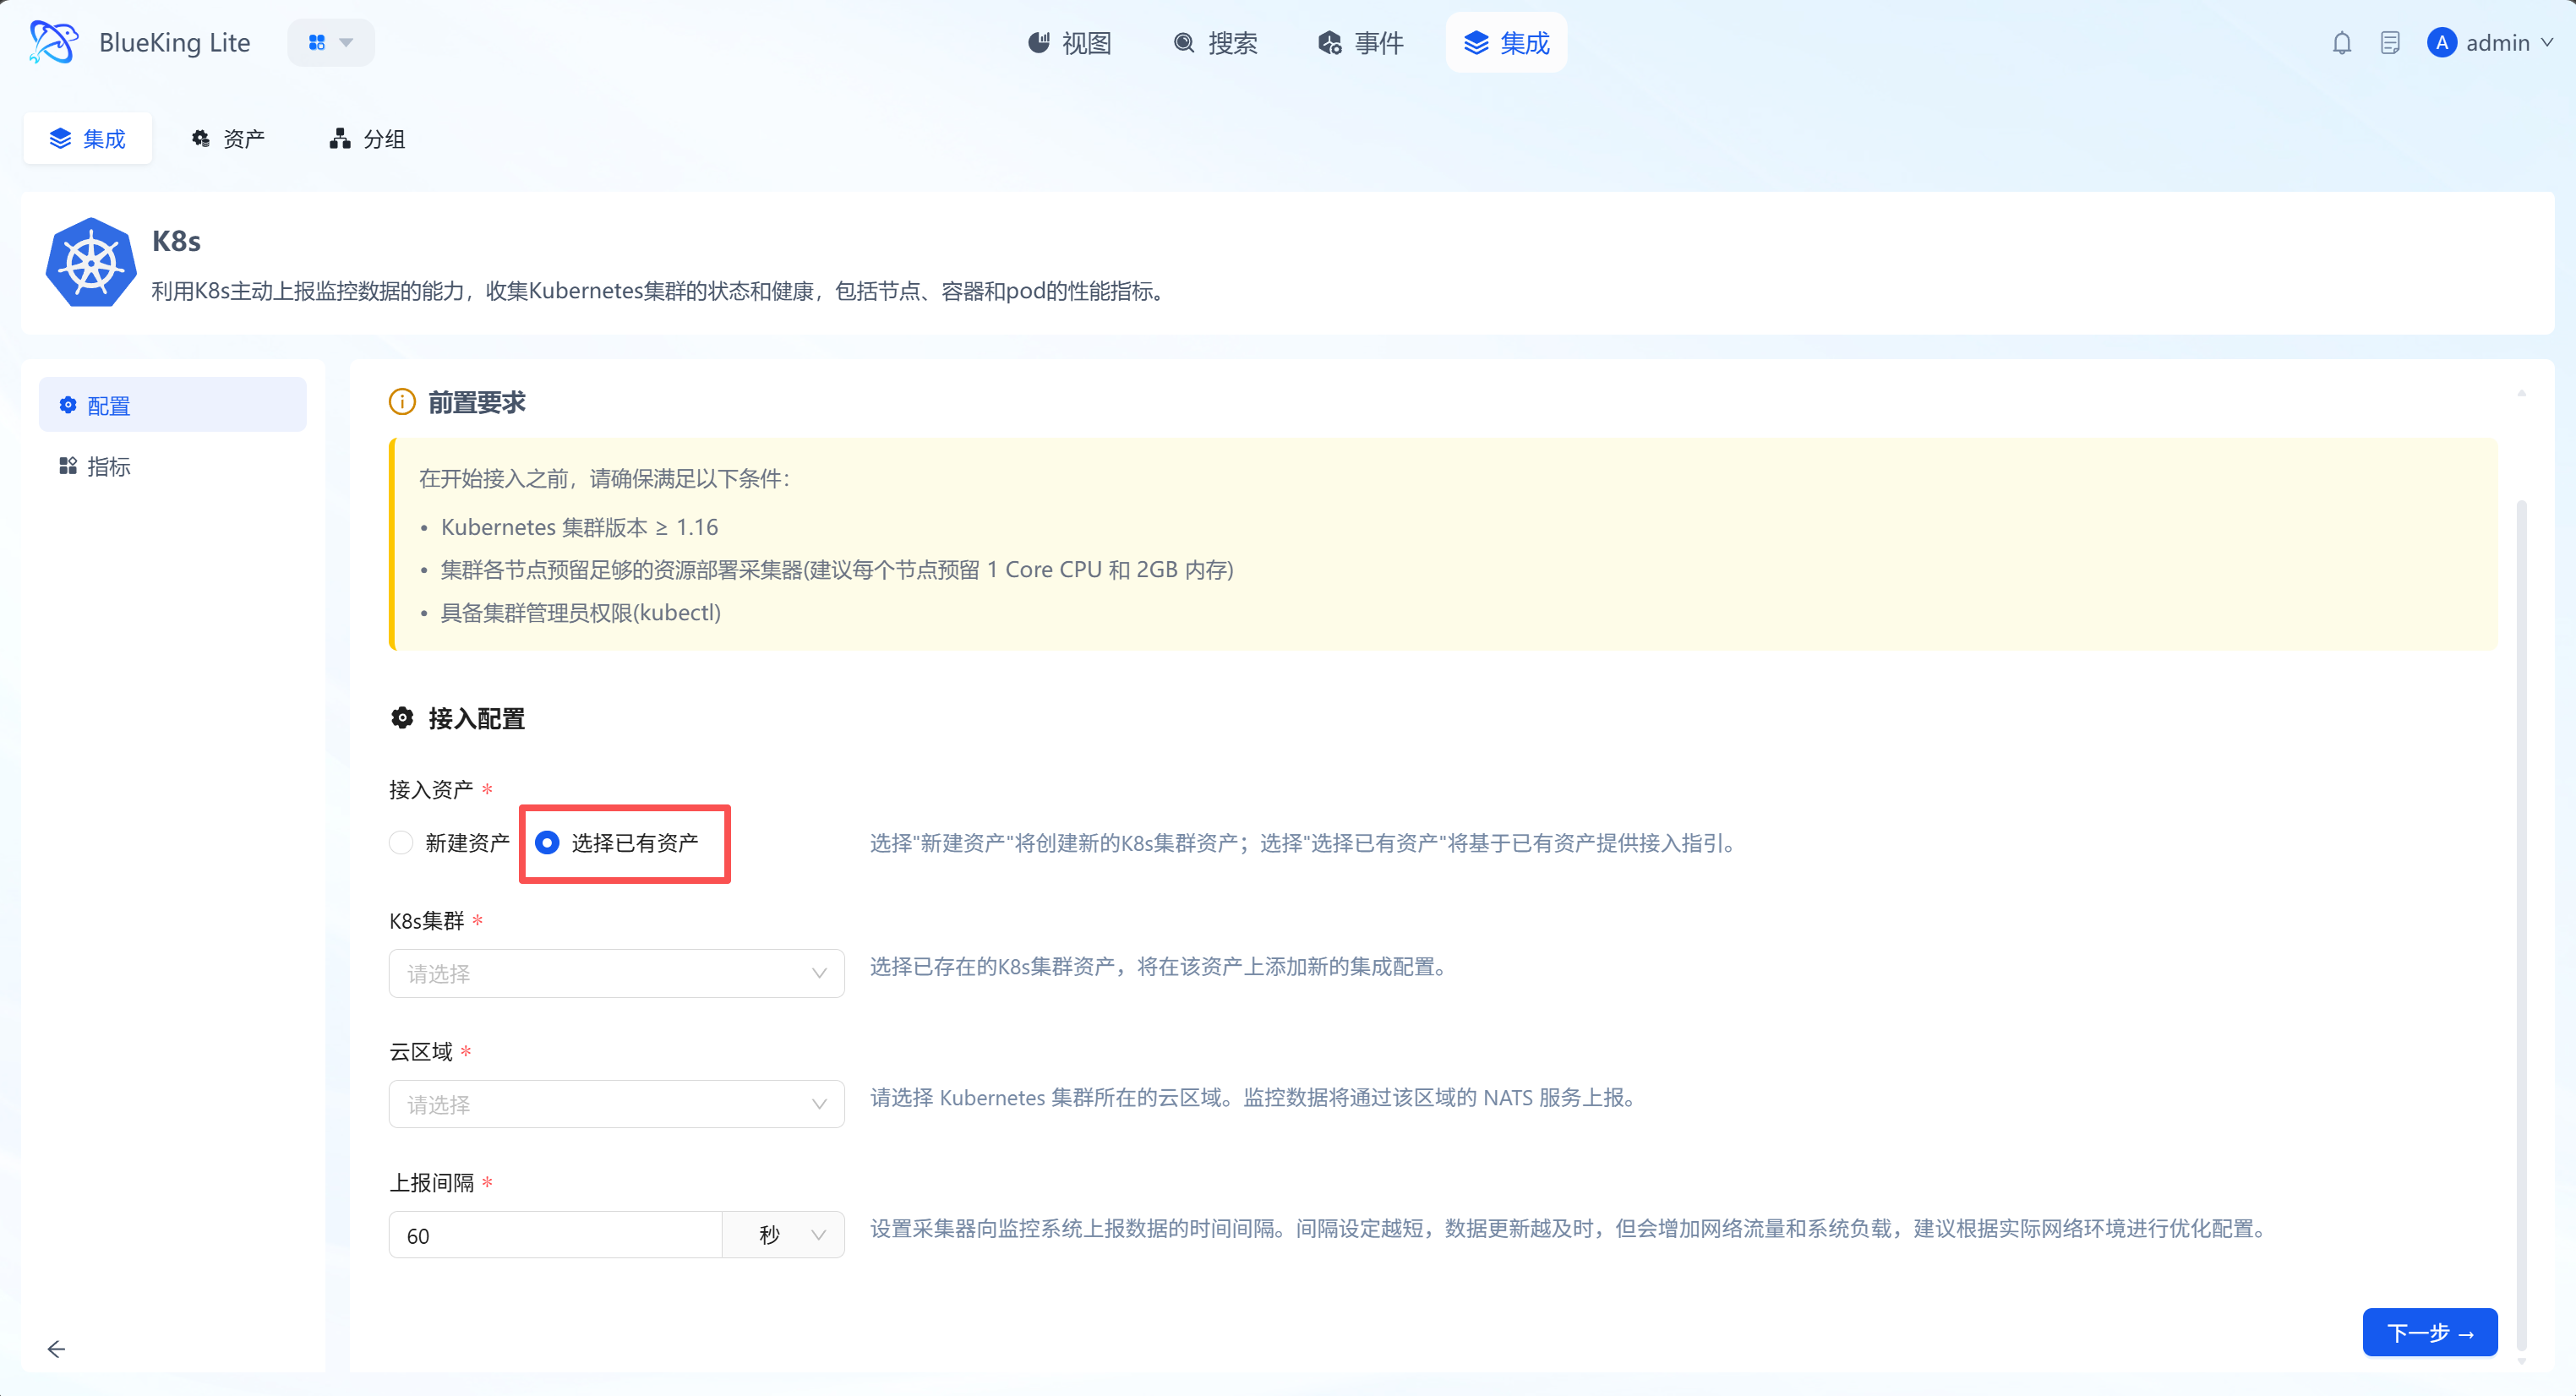
Step 3: Install the Collector
After configuration is complete, the system will generate a one-click installation command based on your settings.
- Execute installation: On a K8s management node with
kubectlconfigured, copy and run thecurlcommand provided on the page.- This command will automatically download the configuration template, render the Token, and deploy monitoring components via
kubectl apply -f -.
- This command will automatically download the configuration template, render the Token, and deploy monitoring components via
- Verify status: After the command executes successfully, click the "Verify" button.
- Since Pod startup and data initialization take time, wait at least one reporting cycle (default 60 seconds) after executing the command before verifying.
Screenshot Guide:
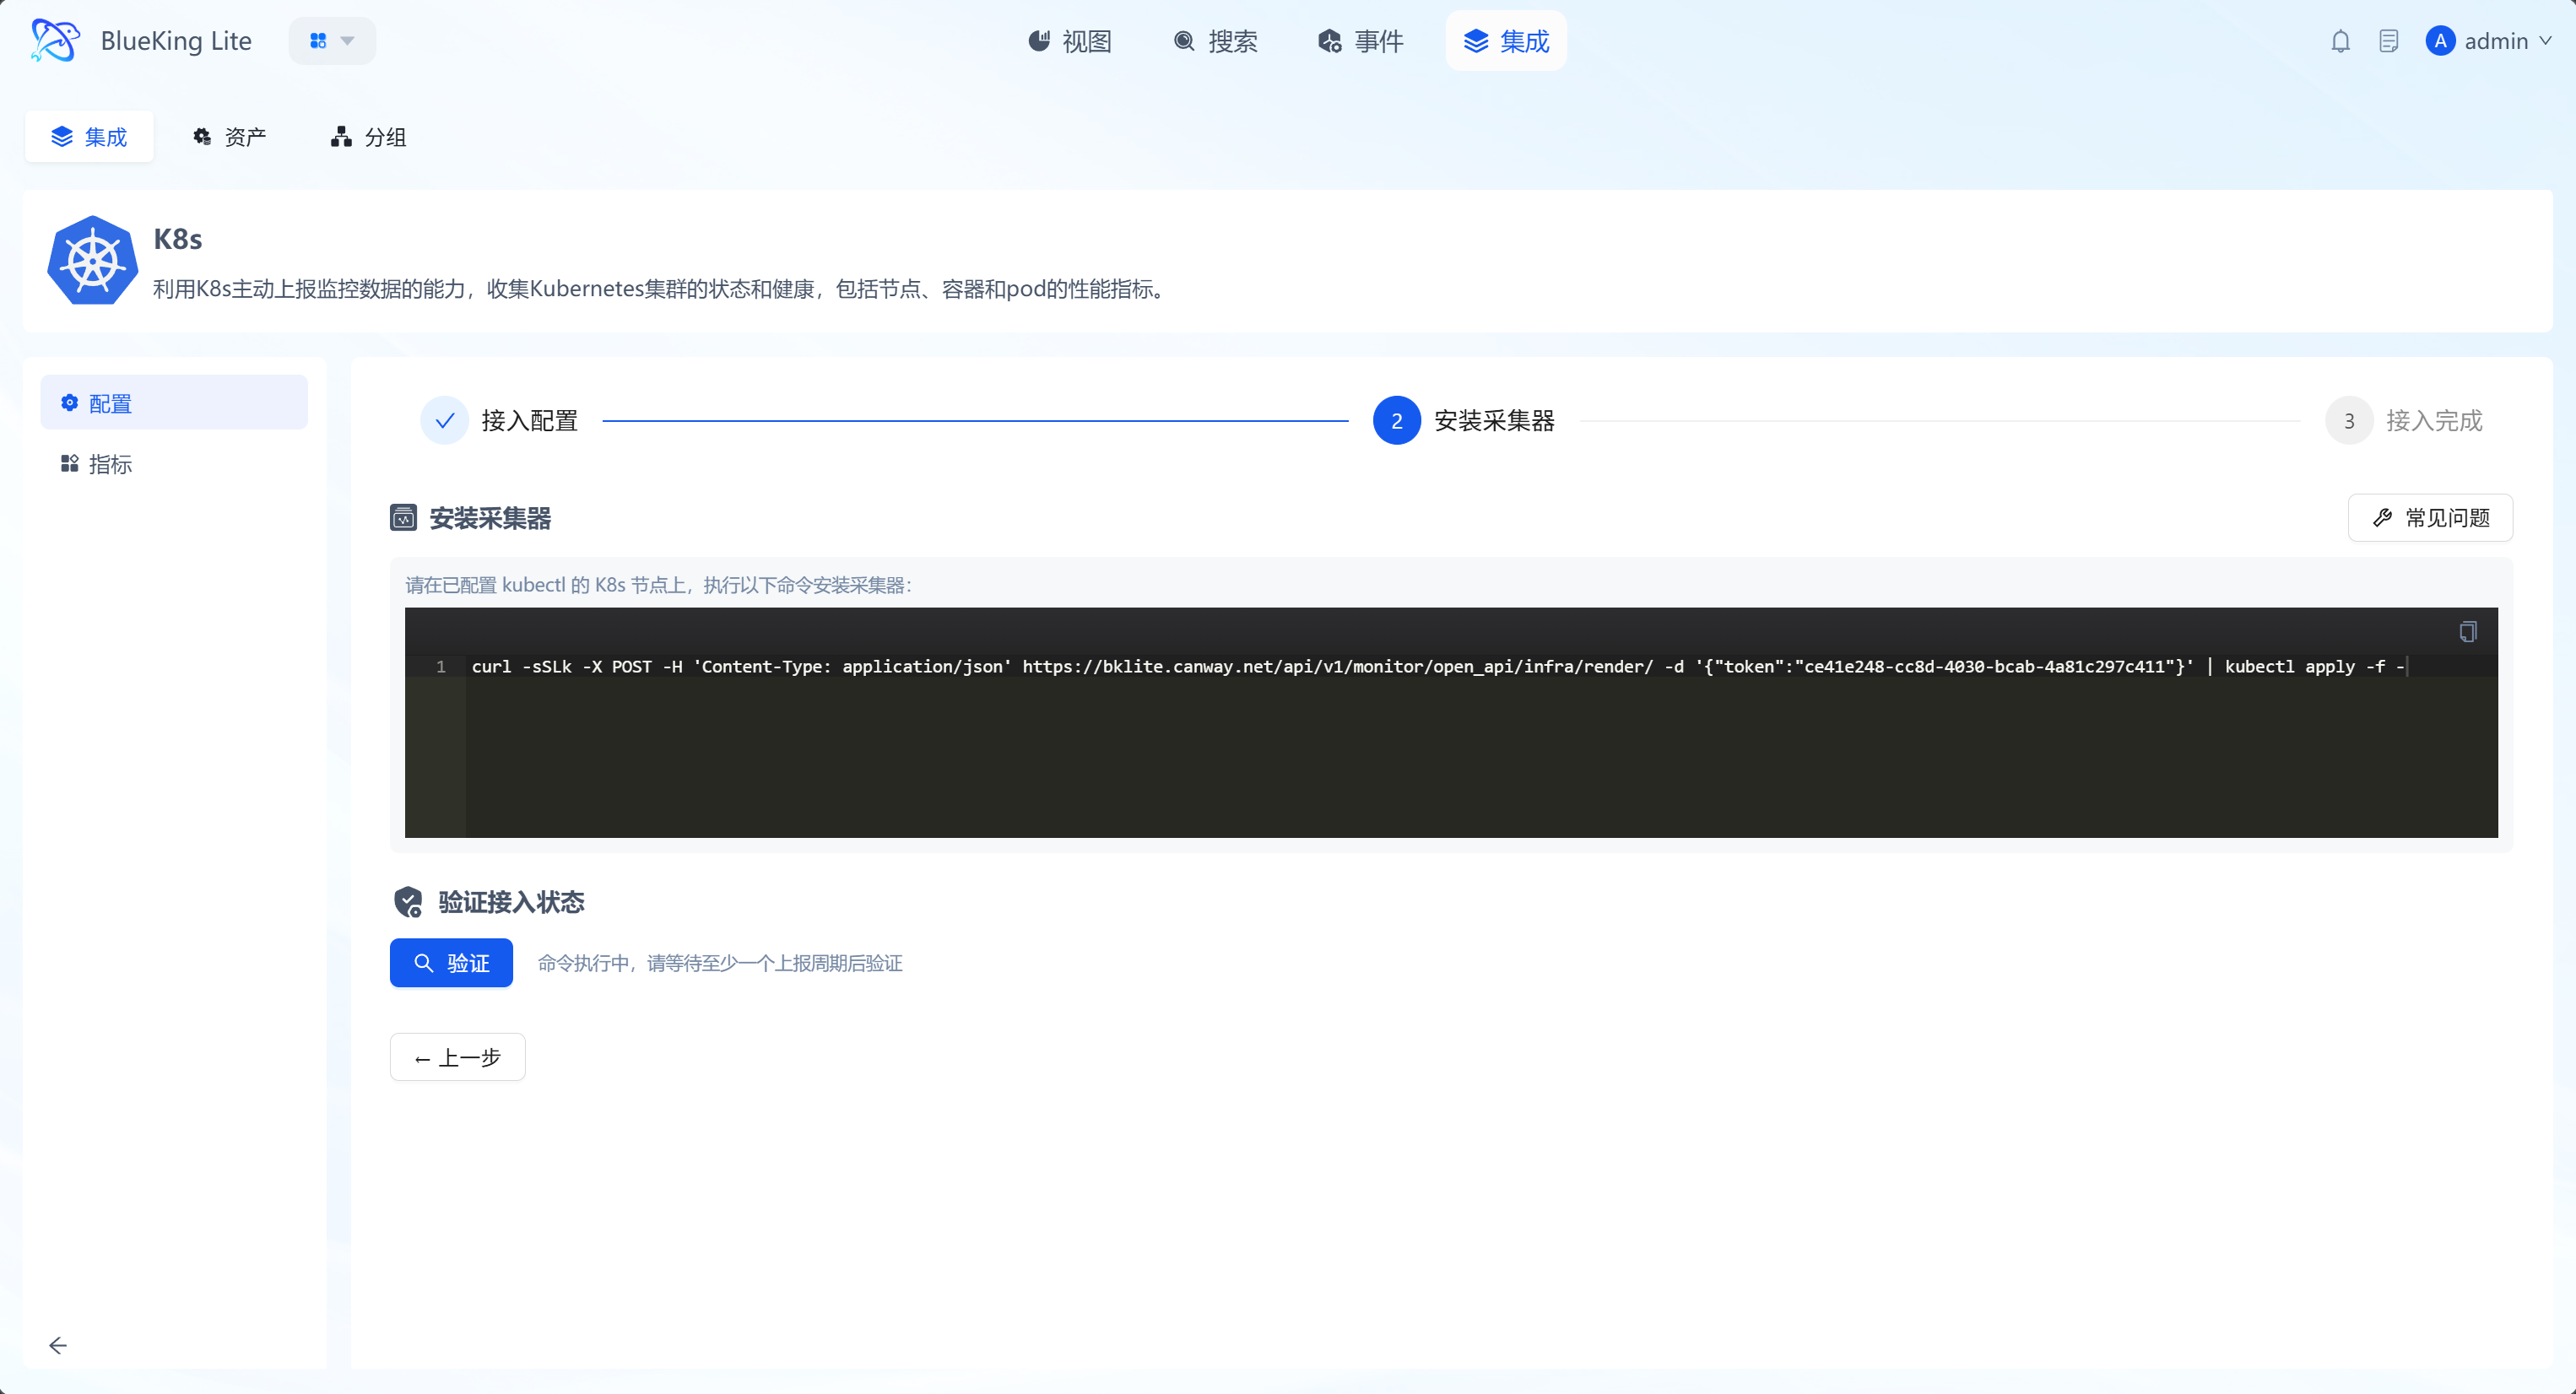
Common Troubleshooting
If you find that data is not being reported normally during the verification phase, refer to the following common issues:
- Pod stuck in Pending status:
- Cause: Insufficient cluster resources to schedule the collector Pod.
- Solution: Check node resource usage (
kubectl top nodes), adjust resource requests, or add cluster nodes.
- Pod cannot connect to NATS service:
- Cause: Network unreachable or authentication certificate errors.
- Solution: Check network connectivity from the collector Pod to the cloud region NATS service, and review Pod logs for detailed errors.
VMware Monitoring
This section describes how to monitor the entire VMware vSphere environment by connecting to vCenter Server.
Integrating vCenter
Connect to vCenter Server's API interface via the Telegraf collector to comprehensively collect performance metrics for Datacenters, Clusters, ESXi hosts, Virtual Machines (VMs), and Datastores.
Step 1: Select an Integration Plugin
- After entering Monitor, click "Integration" in the top navigation bar.
- Select resource type:
- Expand the "VMware" category in the left menu.
- Click "vCenter".
- Click "+ Integrate" at the top right of the list.
Screenshot Guide:
- Plugin description: Through a single vCenter data source, this plugin can automatically discover and monitor all ESXi hosts, virtual machines, and datastores it manages without configuring each object individually.
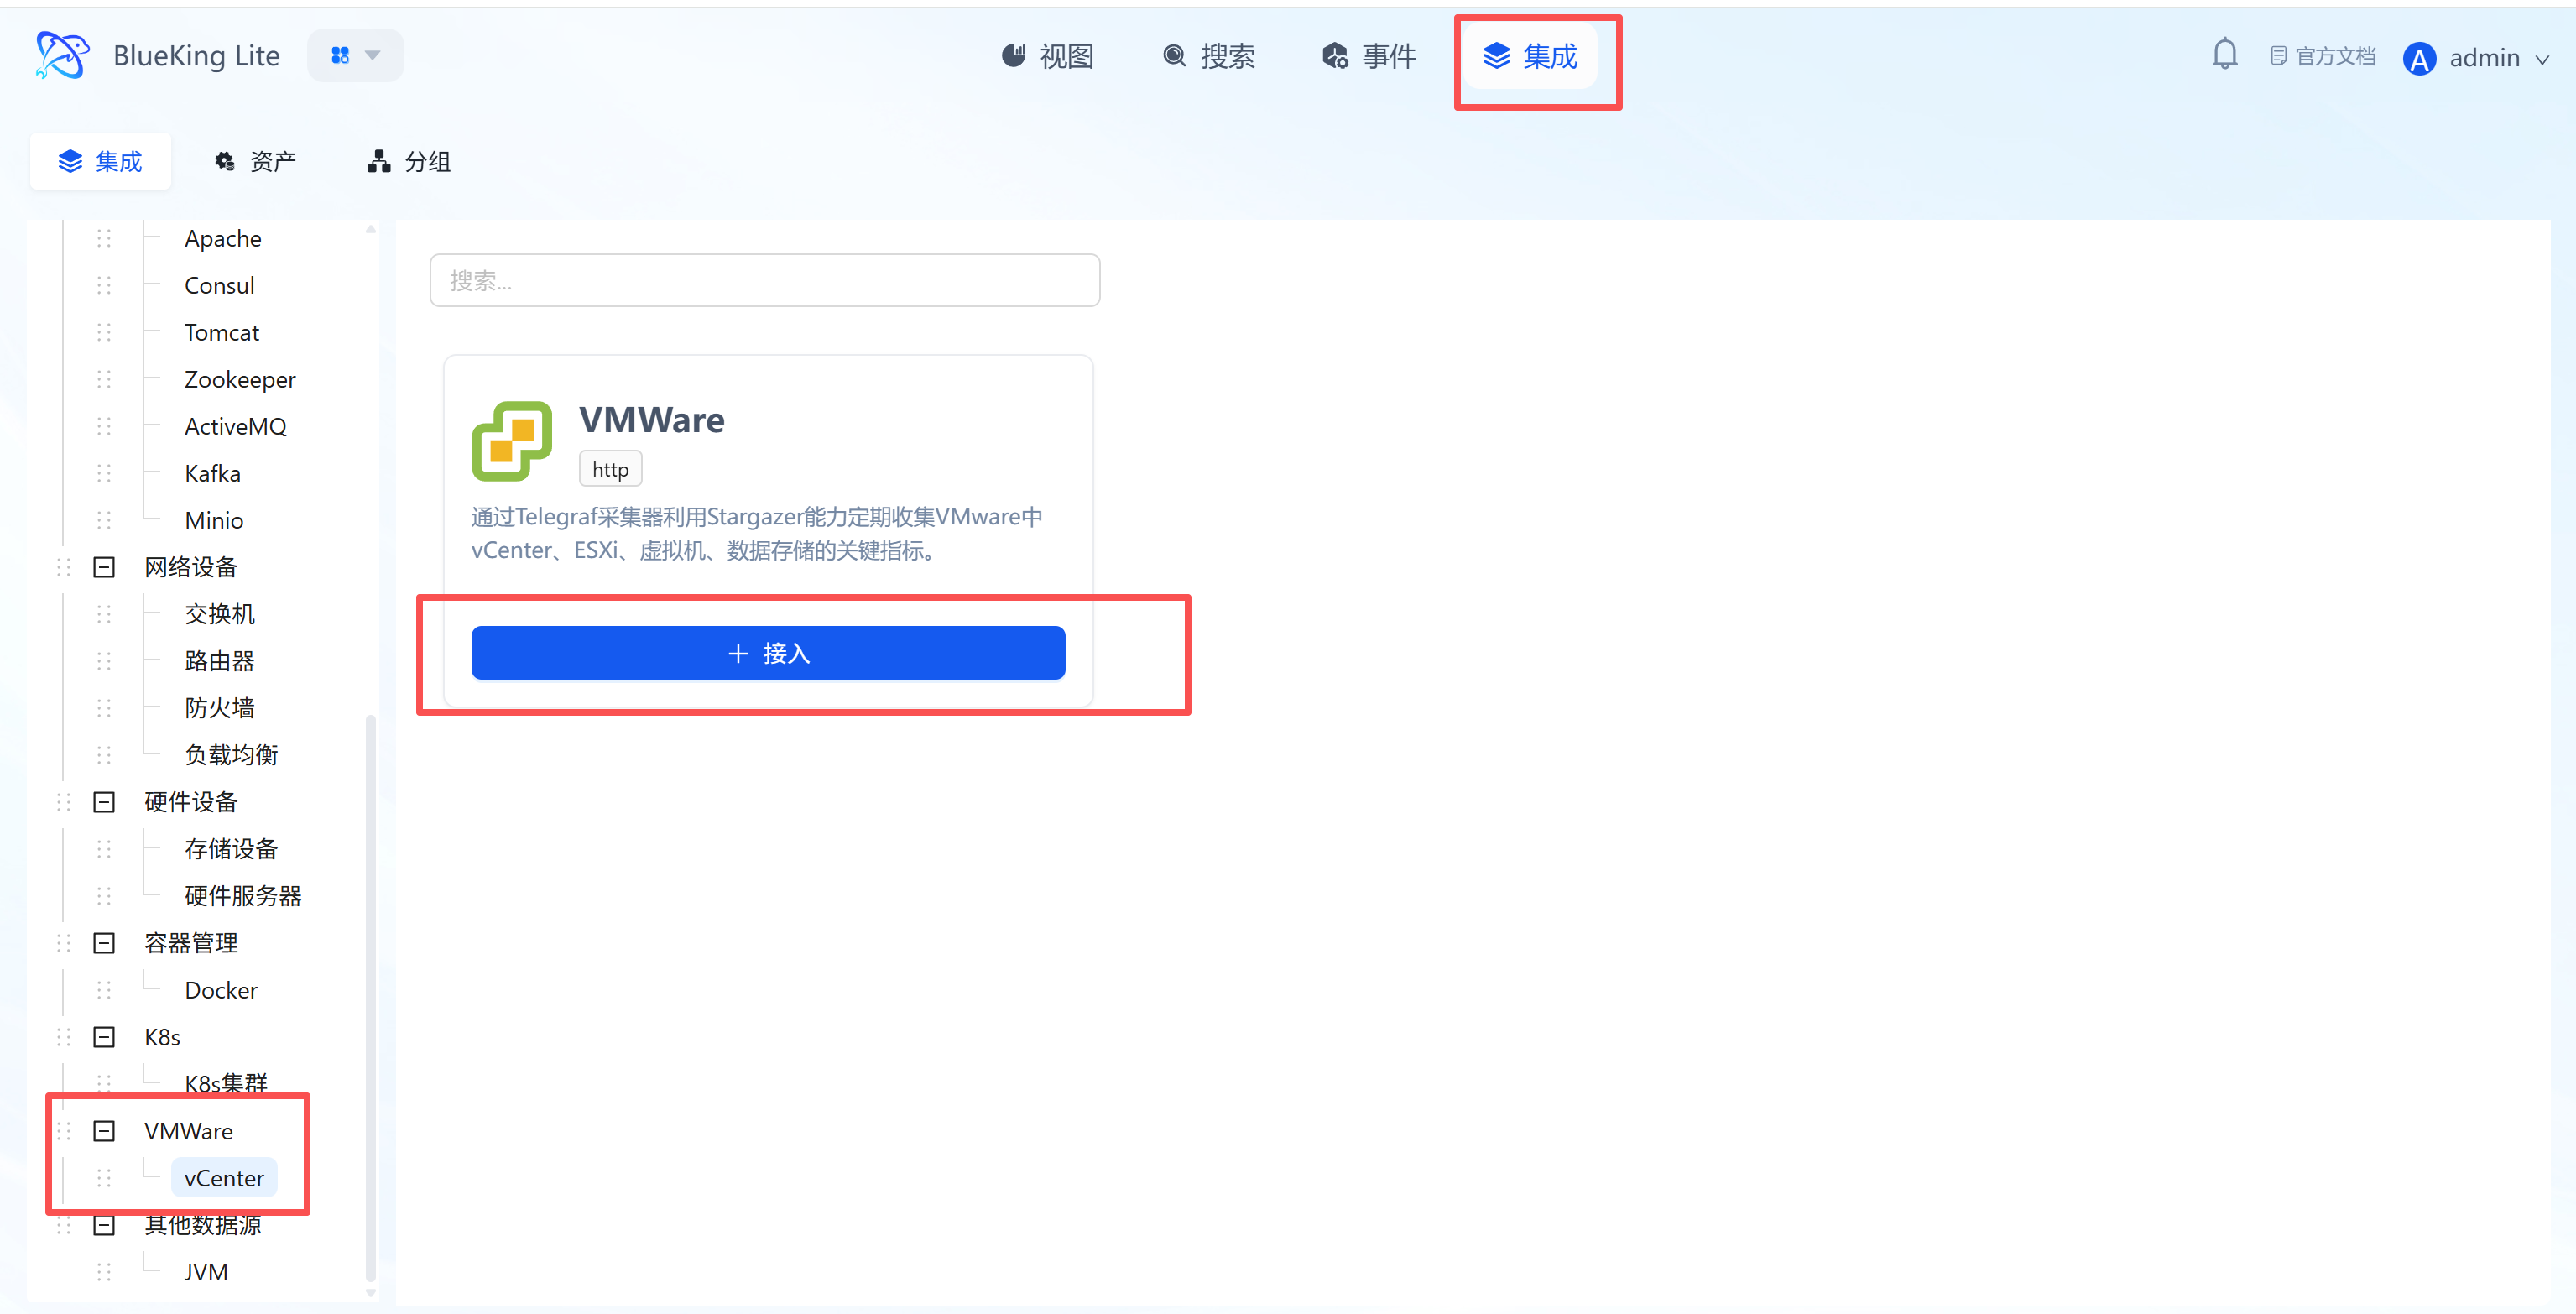
Step 2: Configure Collection Policy
In this step, you need to configure the vCenter Server access credentials and connection address.
- Collection configuration (authentication information):
- Username: Enter a username with vCenter access privileges (e.g.,
administrator@vsphere.localor a read-only role user). - Password: Enter the corresponding password.
- Interval: Default is
10s.
- Username: Enter a username with vCenter access privileges (e.g.,
- Configure monitoring targets:
- Node: Select a managed host as the collector (must ensure this machine has network connectivity to vCenter Server, typically HTTPS port 443).
- Host: Enter the vCenter Server's IP address or FQDN (domain name).
- Instance name: It is recommended to name it "vCenter-DatacenterName".
- Click "Confirm".
Screenshot Guide:
- Permission note: Please use a vCenter user with global Read-only privileges to ensure the collector can traverse all hierarchical objects. For security purposes, it is recommended to create a dedicated read-only monitoring account.
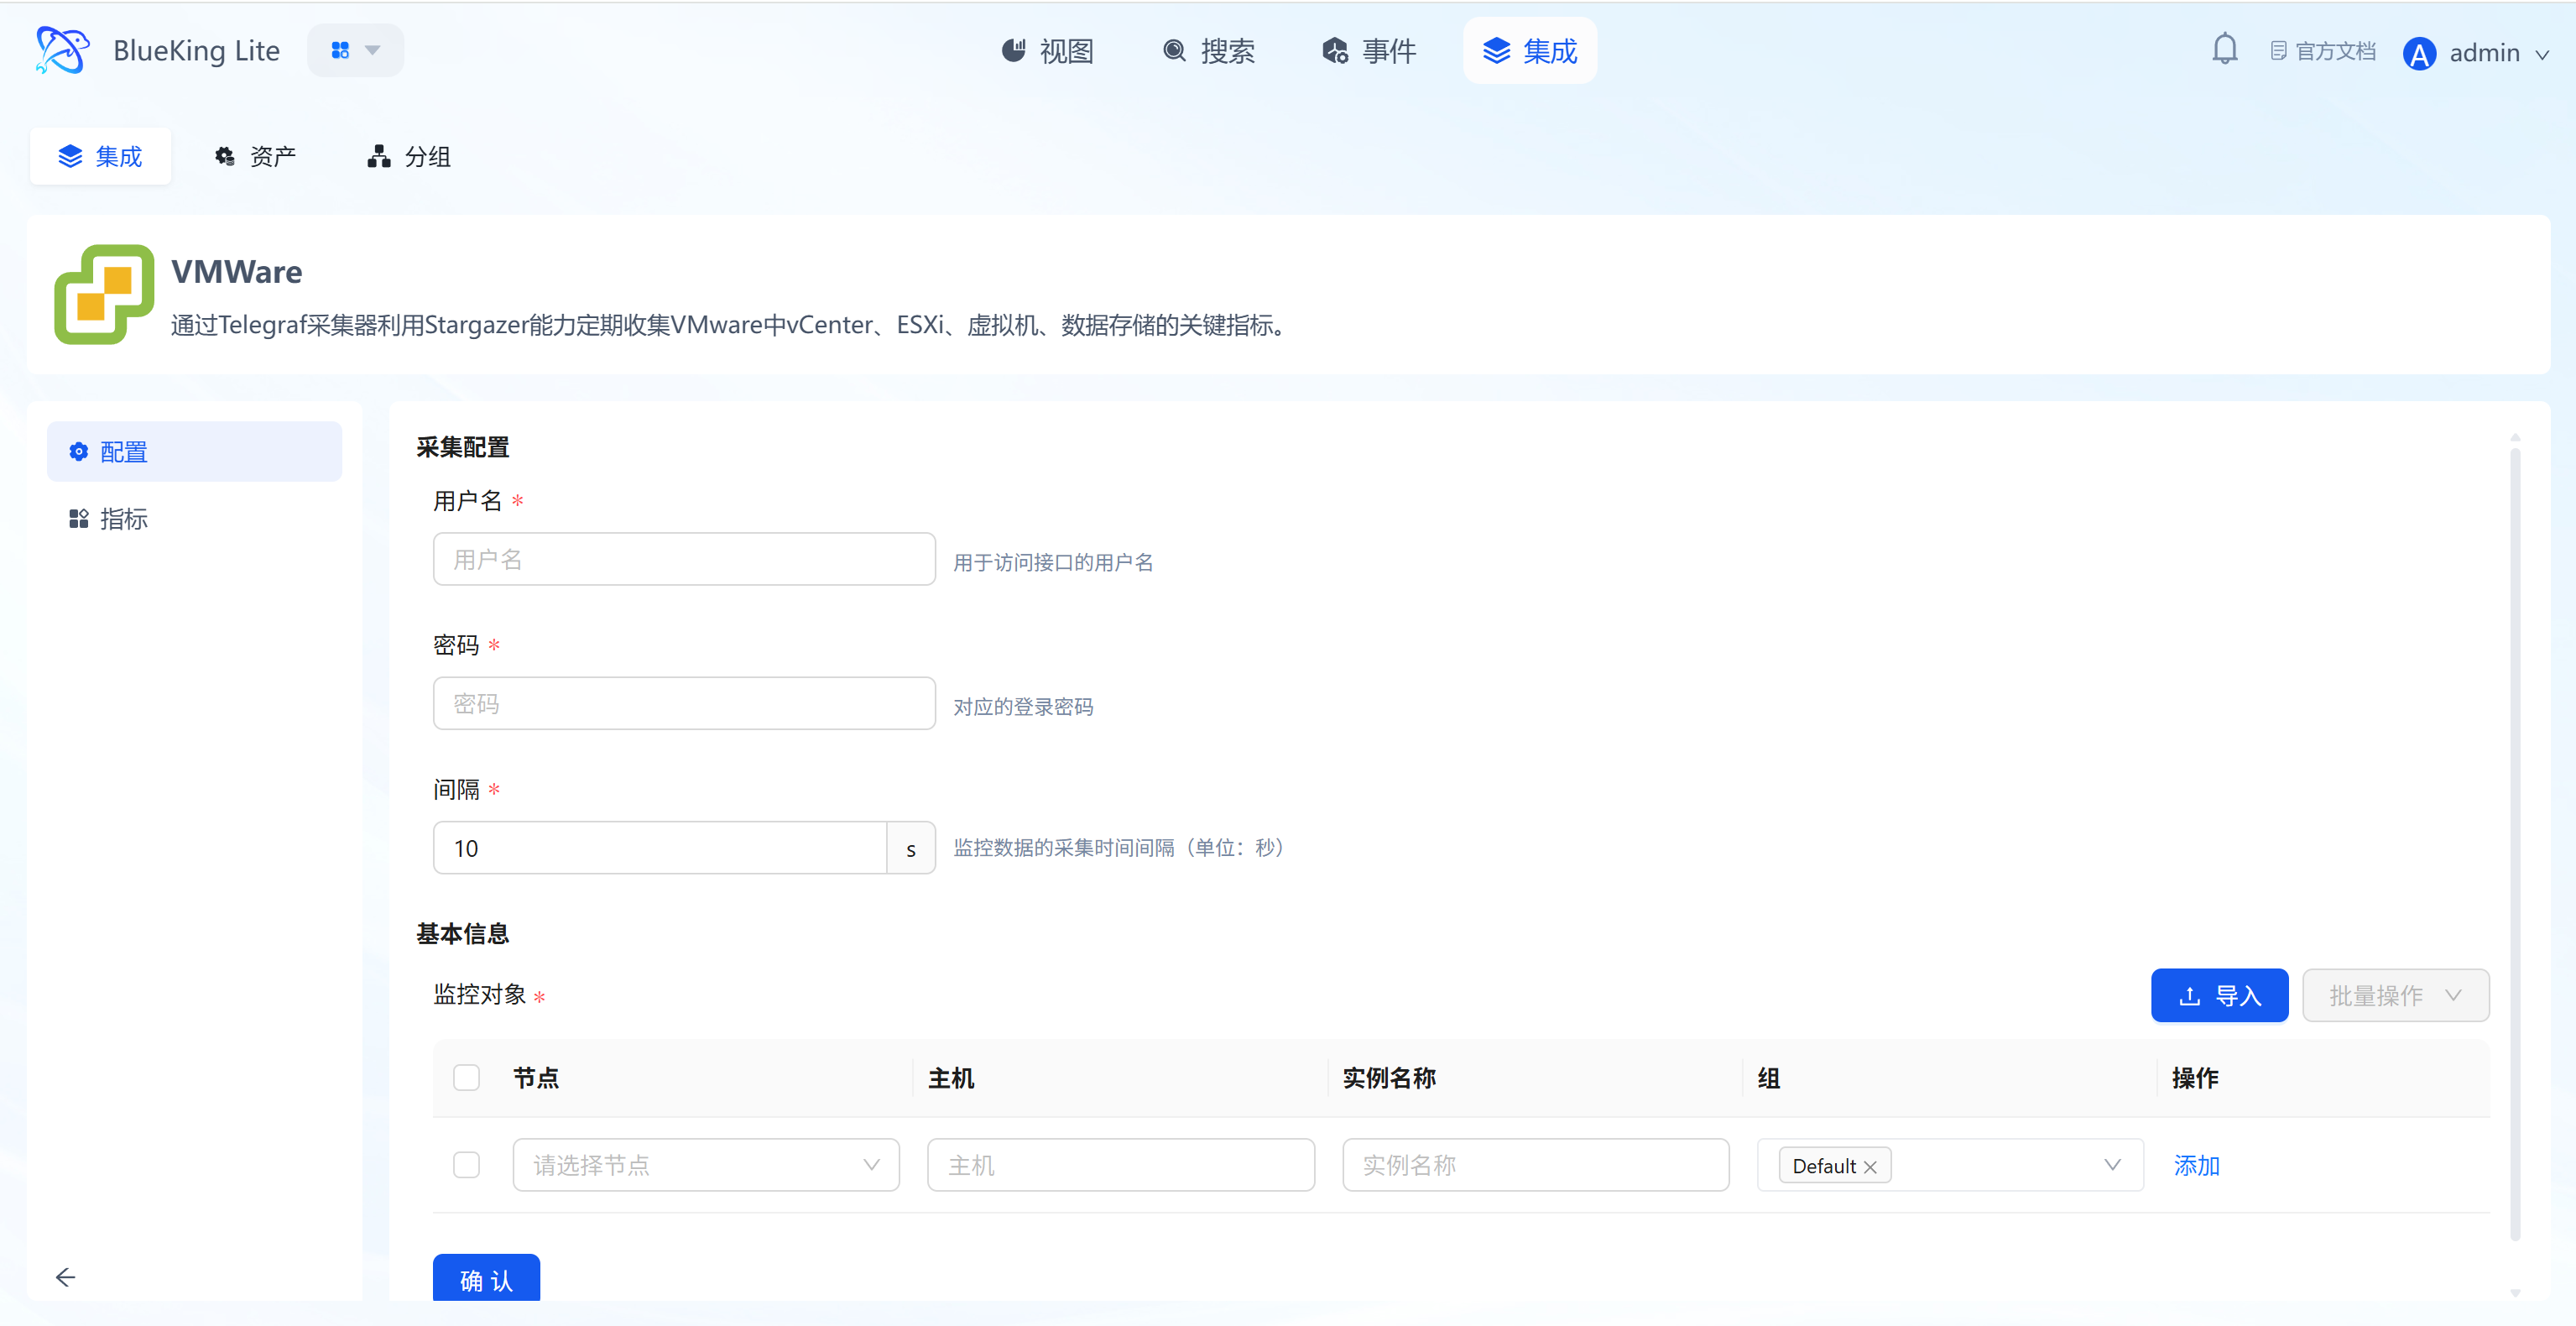
Step 3: Verify and Analyze
- Click the "View" module at the top of the page.
- In the left resource list, expand "VMware" -> "vCenter", and click the instance name.
- Data verification:
- ESXi Host - CPU/Memory Usage: Monitor physical host CPU and memory resource utilization for capacity planning and load balancing decisions.
- Virtual Machine - CPU Ready (%rdy): Monitor the virtual machine's CPU ready time. This is a critical value for performance analysis; persistently high values indicate severe CPU resource contention on the host.
- Virtual Machine - Memory Balloon/Swap: Monitor memory swap and balloon activity. The presence of these metrics indicates the ESXi host has insufficient memory and is already impacting VM performance.
- Datastore - Usage & Latency: Monitor datastore available space and read/write latency to alert on storage capacity risks and performance bottlenecks.
Other Data Sources
This section covers monitoring for specific applications or runtime environments, such as the Java Virtual Machine (JVM).
Integrating JVM (JMX)
Connect to the target Java application via a JMX (Java Management Extensions) collector to gather core runtime metrics including heap memory, garbage collection (GC), thread pools, and class loading.
Step 1: Select an Integration Plugin
- After entering Monitor, click "Integration" in the top navigation bar.
- Select resource type:
- Expand the "Other Data Sources" category in the left menu.
- Click "JVM".
- Click "+ Integrate" at the top right of the list.
Screenshot Guide:
- Plugin description: This plugin remotely accesses JMX MBeans through Jolokia (a JMX-HTTP bridge), avoiding the complexity and firewall issues associated with the JMX RMI protocol.
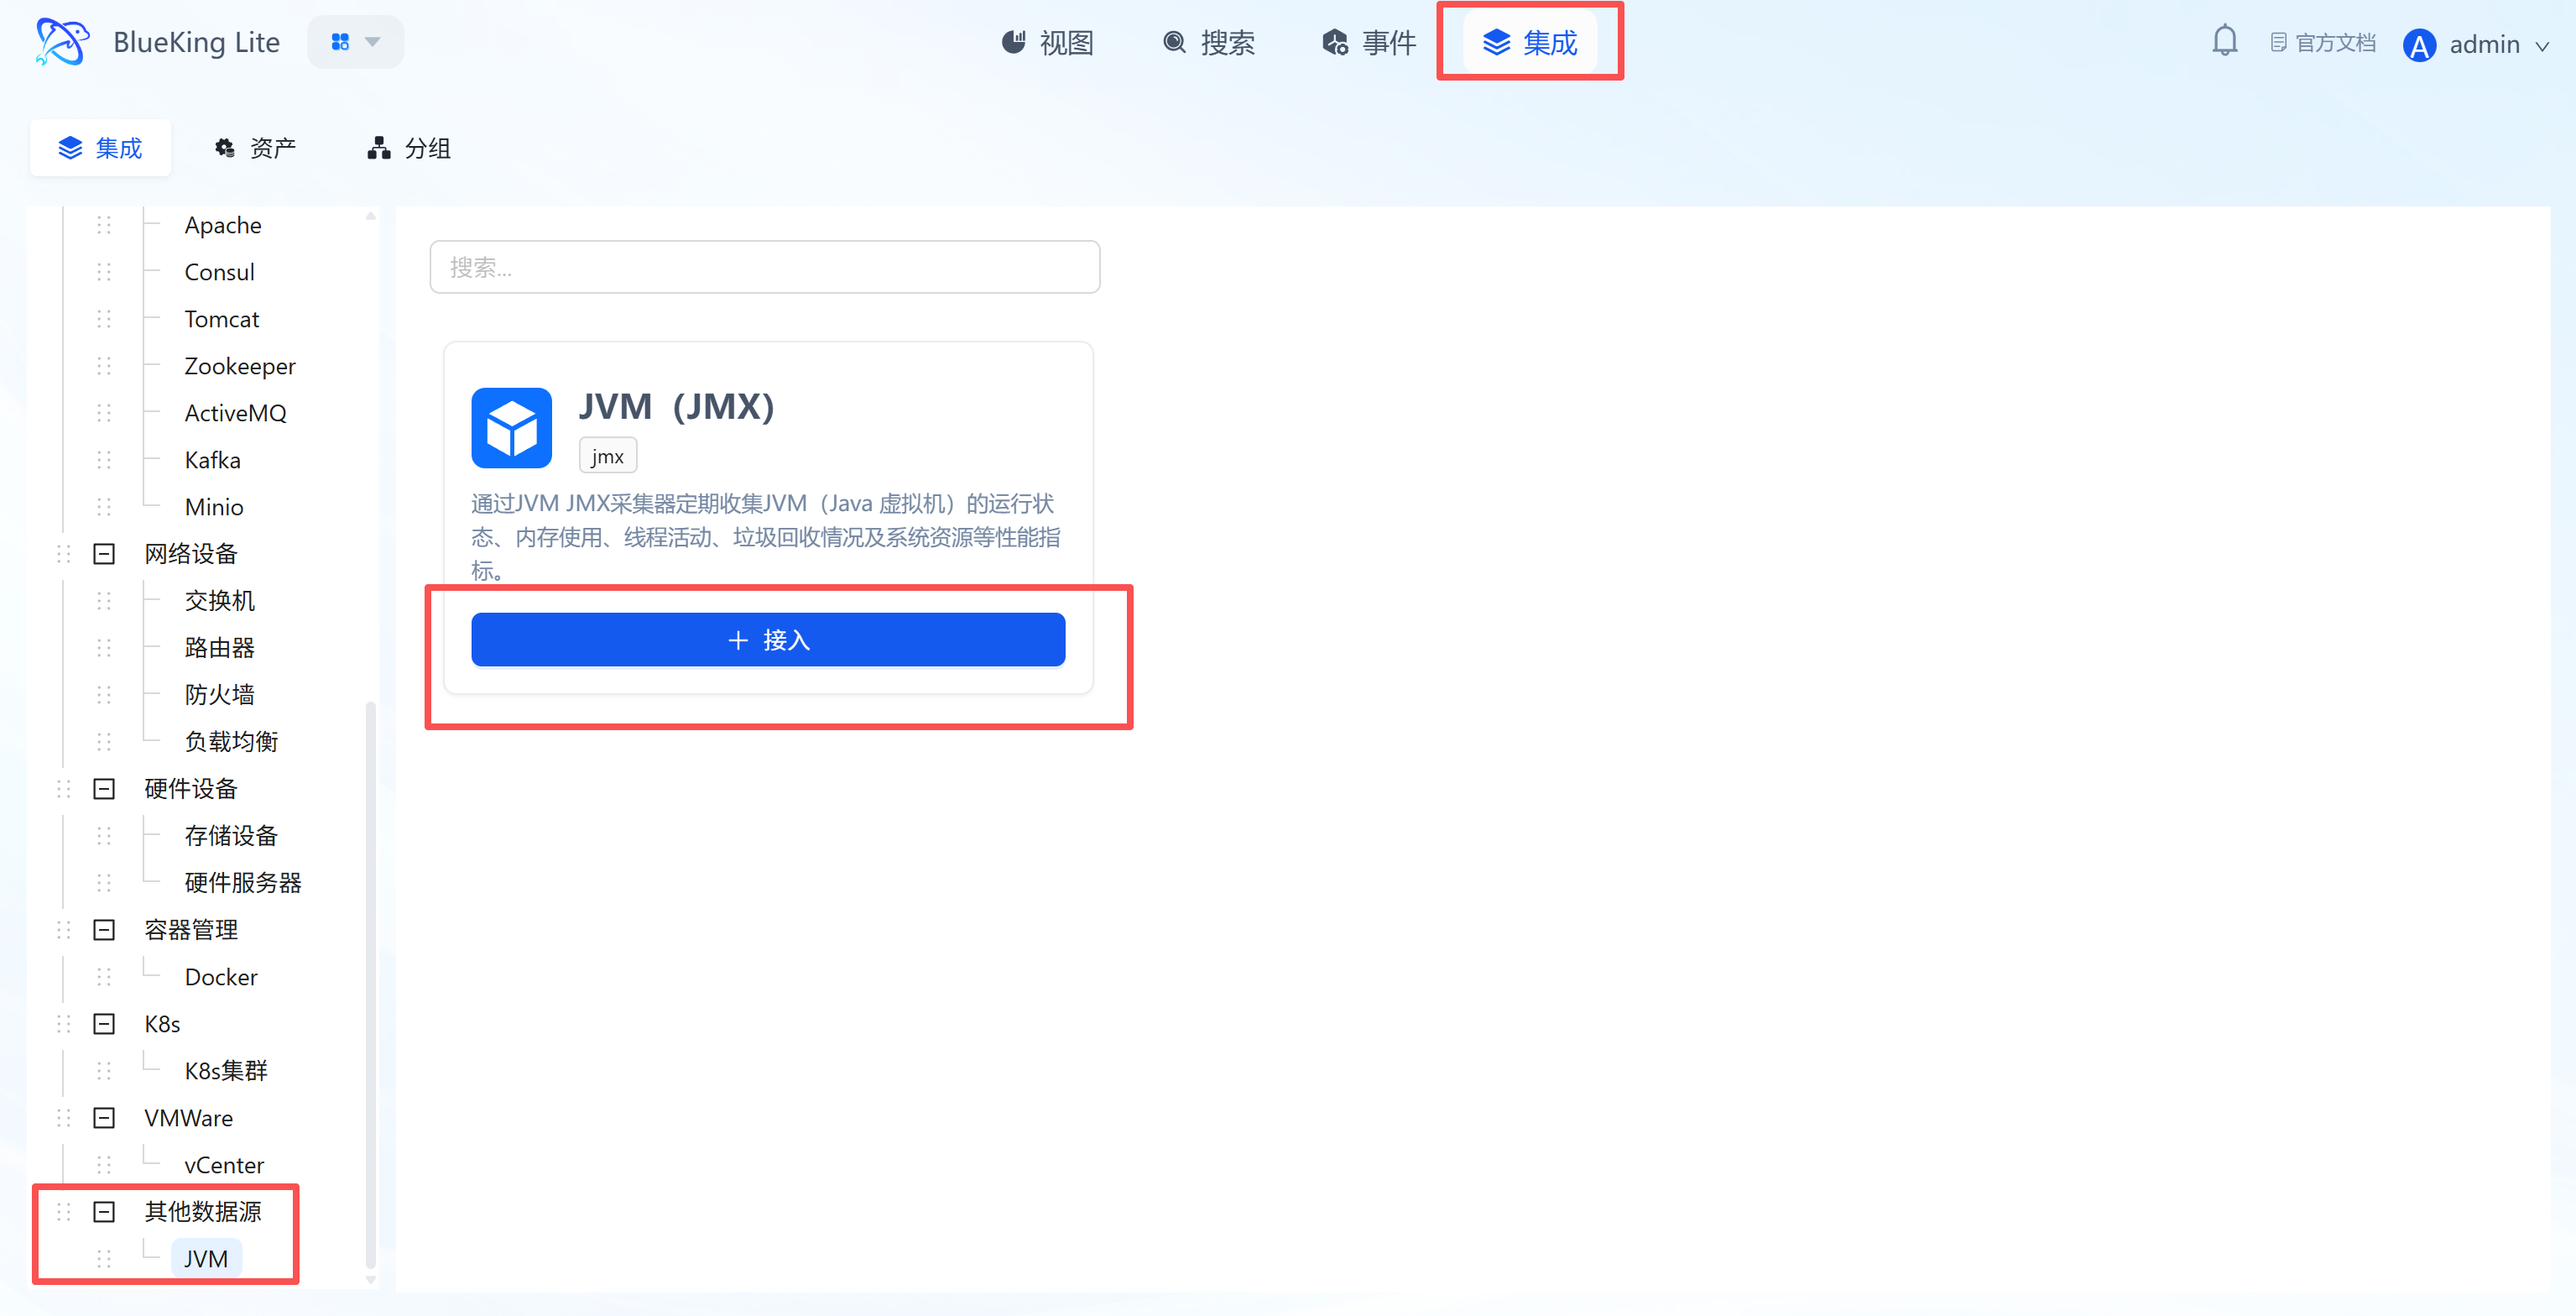
Step 2: Configure Collection Policy
In this step, you need to configure the Java application's Jolokia access address and authentication information.
- Collection configuration (authentication information):
- Username/Password: If your Jolokia endpoint has HTTP Basic authentication configured, please fill in the credentials. Otherwise, leave blank.
- Interval: Default is
10s.
- Configure monitoring targets:
- Node: Select a managed host as the collector (must ensure this machine has network connectivity to the target Java application).
- URL: Enter the complete Jolokia Agent URL.
- Format:
http://<application_IP>:<port>/jolokia - For example, a Tomcat application's address might be
http://192.168.1.10:8080/jolokia
- Format:
- Listener port: (Usually leave blank) This field is used with other JMX protocols. For the Jolokia method, port information is already included in the URL.
- Instance name: It is recommended to name it "JVM-BusinessName".
- Click "Confirm".
Screenshot Guide:
- Prerequisite (Critical!): This monitoring method requires that the Jolokia Agent is already deployed in your target Java application. Typically, the
jolokia-jvm-agent.jaris started as a JVM Agent alongside the application, or thejolokia.warfile is deployed to your Web server (such as Tomcat).
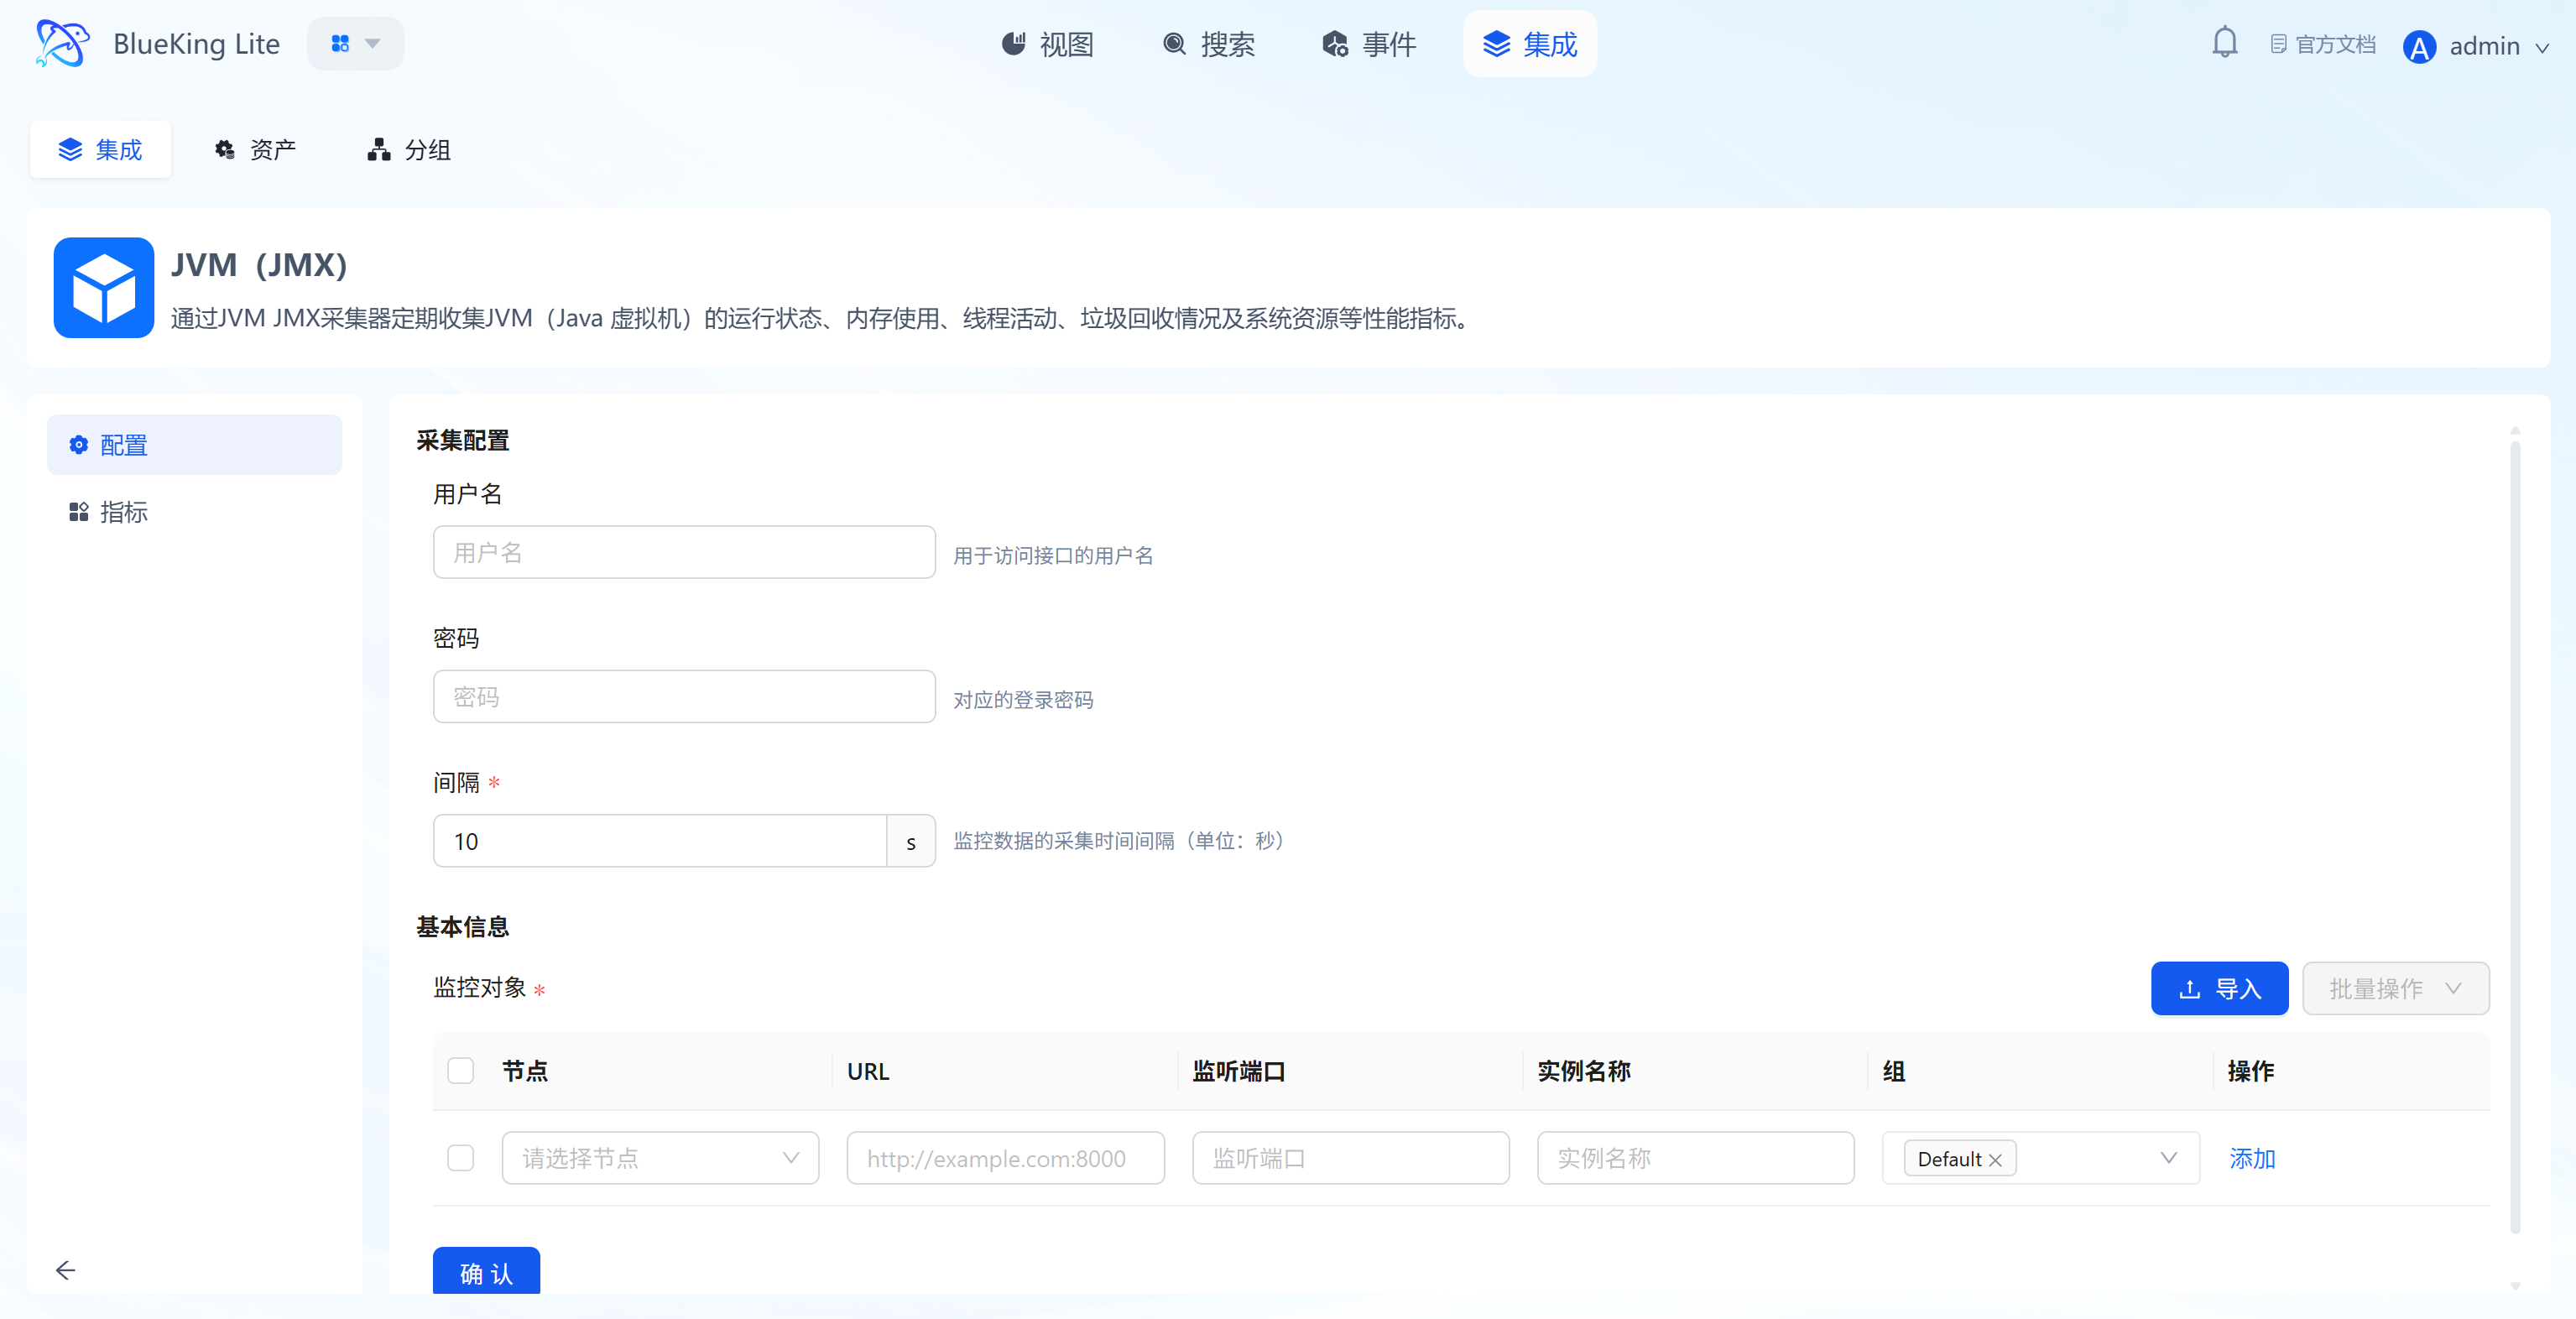
Step 3: Verify and Analyze
- Click the "View" module at the top of the page.
- In the left resource list, expand "Other Data Sources" -> "JVM", and click the instance name.
- Data verification:
- Heap Memory Usage: Monitor heap memory usage (Used vs. Committed vs. Max) — the core metric for determining whether memory is sufficient and whether memory leaks exist.
- GC Counts & Time: Monitor garbage collection frequency and duration. Frequent Full GC or excessively long GC pause times are the primary causes of application performance degradation.
- Thread Count: View the JVM's total thread count, daemon thread count, etc., helpful for analyzing the application's concurrency model and resource consumption.
- Class Loading: Monitor the count of loaded and unloaded classes, useful for troubleshooting classloader-related memory leak issues.
Next Step: Configure and Manage Alerts (Optional)
After completing metric data integration and confirming views are working properly through the steps above, it is recommended to configure alert policies for core resources to achieve a closed-loop risk management process:
- Enter the Events module: Click "Events" in the top navigation and switch to the "Policies" or "Templates" tab.
- Reuse templates (Recommended): Select a preset rule from the "Template Library" (such as "Host CPU Usage Too High"), fill in business assets, and quickly generate baseline alerts.
- Custom policies: Click "+Add" to enter the wizard, where you can select threshold detection or no-data alert detection, combined with flexible muting and recovery cycle conditions, and send to designated notification groups for handling.
- Unified operations: After alerts are generated, they can be uniformly analyzed in the "Alerts" tab for critical/warning events, with automatic drill-down to the relevant metric context at the time of triggering for fault demarcation.