Practice Guide
This document serves as a hands-on configuration guide for three types of automated inspection assistants: Web Application, Postgres DB, and Kubernetes Cluster. Through clear step-by-step instructions, screenshot guides, and key considerations, it helps users quickly complete the entire process from preparation, agent configuration, to pipeline publishing and result verification.
Core Content Coverage
- Web Application Inspection Assistant: Web service health inspection (scheduled/on-demand triggering), anomaly alerting, and automated HTML report generation;
- Postgres DB Assistant: PostgreSQL database inspection across 8 core metric categories, risk item identification, and standardized report delivery;
- Kubernetes Cluster Inspection Assistant: K8s cluster node/Pod/workload anomaly detection, status summary, and visual report output.
Web Application Inspection Assistant Configuration Guide
I. Feature Overview
The "Web Application Inspection Assistant" performs scheduled or on-demand health inspections on specified Web services, automatically collects access results for summary analysis, and promptly alerts through configured channels when anomalies are detected. It helps operations personnel quickly build automated inspection and alerting workflows without writing code.
This capability is suitable for routine availability monitoring, pre-launch inspection verification, and continuous observation after anomalies.
Core Capabilities
The Web Application Inspection Assistant forms a complete inspection closed loop through "Trigger -> Auto Inspection -> Result Summary -> Anomaly Notification":
- Multiple Trigger Methods: Supports scheduled triggers, RESTful API calls, and other trigger modes
- Agent Collaboration: Completes data collection and aggregation through the "Web Application Inspection Assistant" and "Web Application Data Summary" agents
- Flexible Notifications: Supports email, DingTalk, WeCom, and other notification channels for timely alerting when anomalies occur
- Standardized Reports: Automatically generates HTML-format visual inspection reports with scores and anomaly details for quick issue identification
II. Applicable Scenarios and Users
2.1 Applicable Scenarios
- Performing periodic health checks on online Web services
- Automatically executing availability inspections before and after business peaks
- Notifying relevant personnel immediately when anomalies are discovered
2.2 Target Users
- Operations personnel: Quickly build Web service monitoring and alerting workflows
- Developers: Configure basic health checks for self-developed Web applications
- Business personnel: View inspection reports and alert results
III. Preparation (Important)
Before configuring the Web Application Inspection Assistant, ensure the following preparations are complete:
3.1 LLM Model Configured
- Log in to the BlueKing Lite platform -> OpsPilot navigation bar -> Models -> LLM Model -> Add and enable an available LLM model
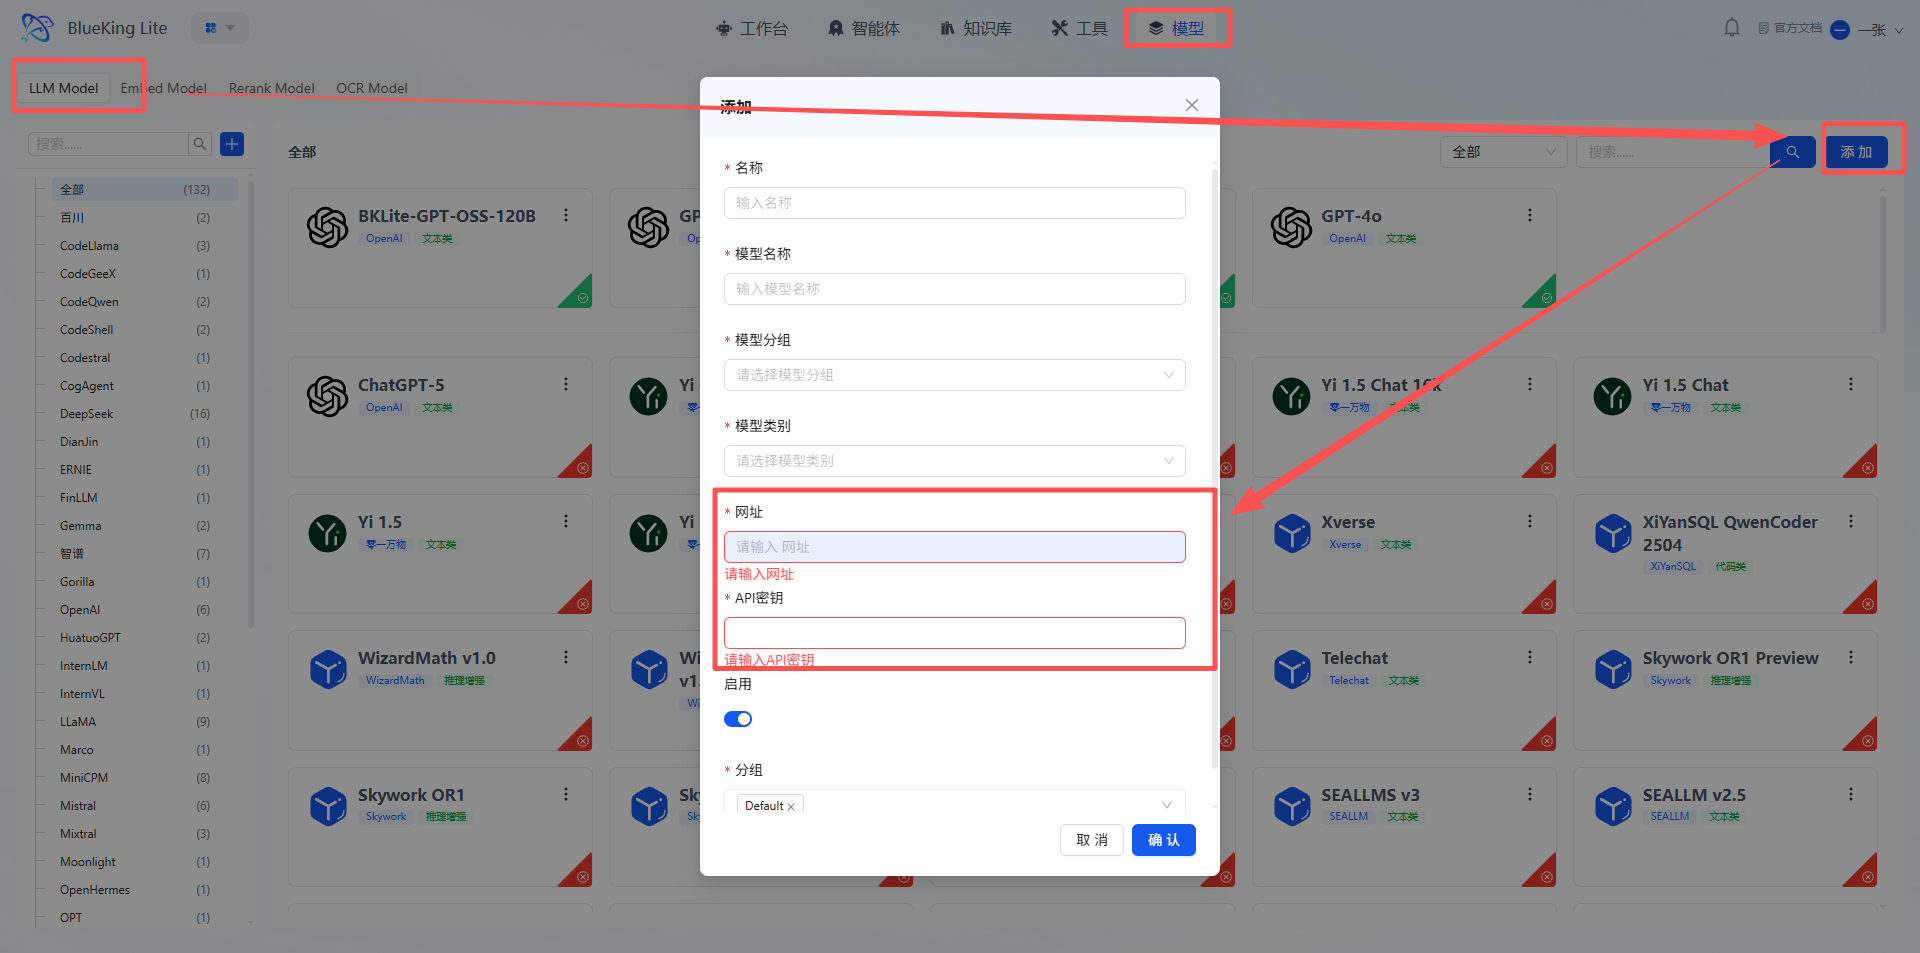
- Model Name: The official technical name of the model (e.g.,
gpt-oss:120b), must match the interface-side definition. - URL: The API address of the model interface (e.g.,
https://new-api.pawlab.dev/v1). - API Key: The authorization key for accessing the model interface; keep it secure.
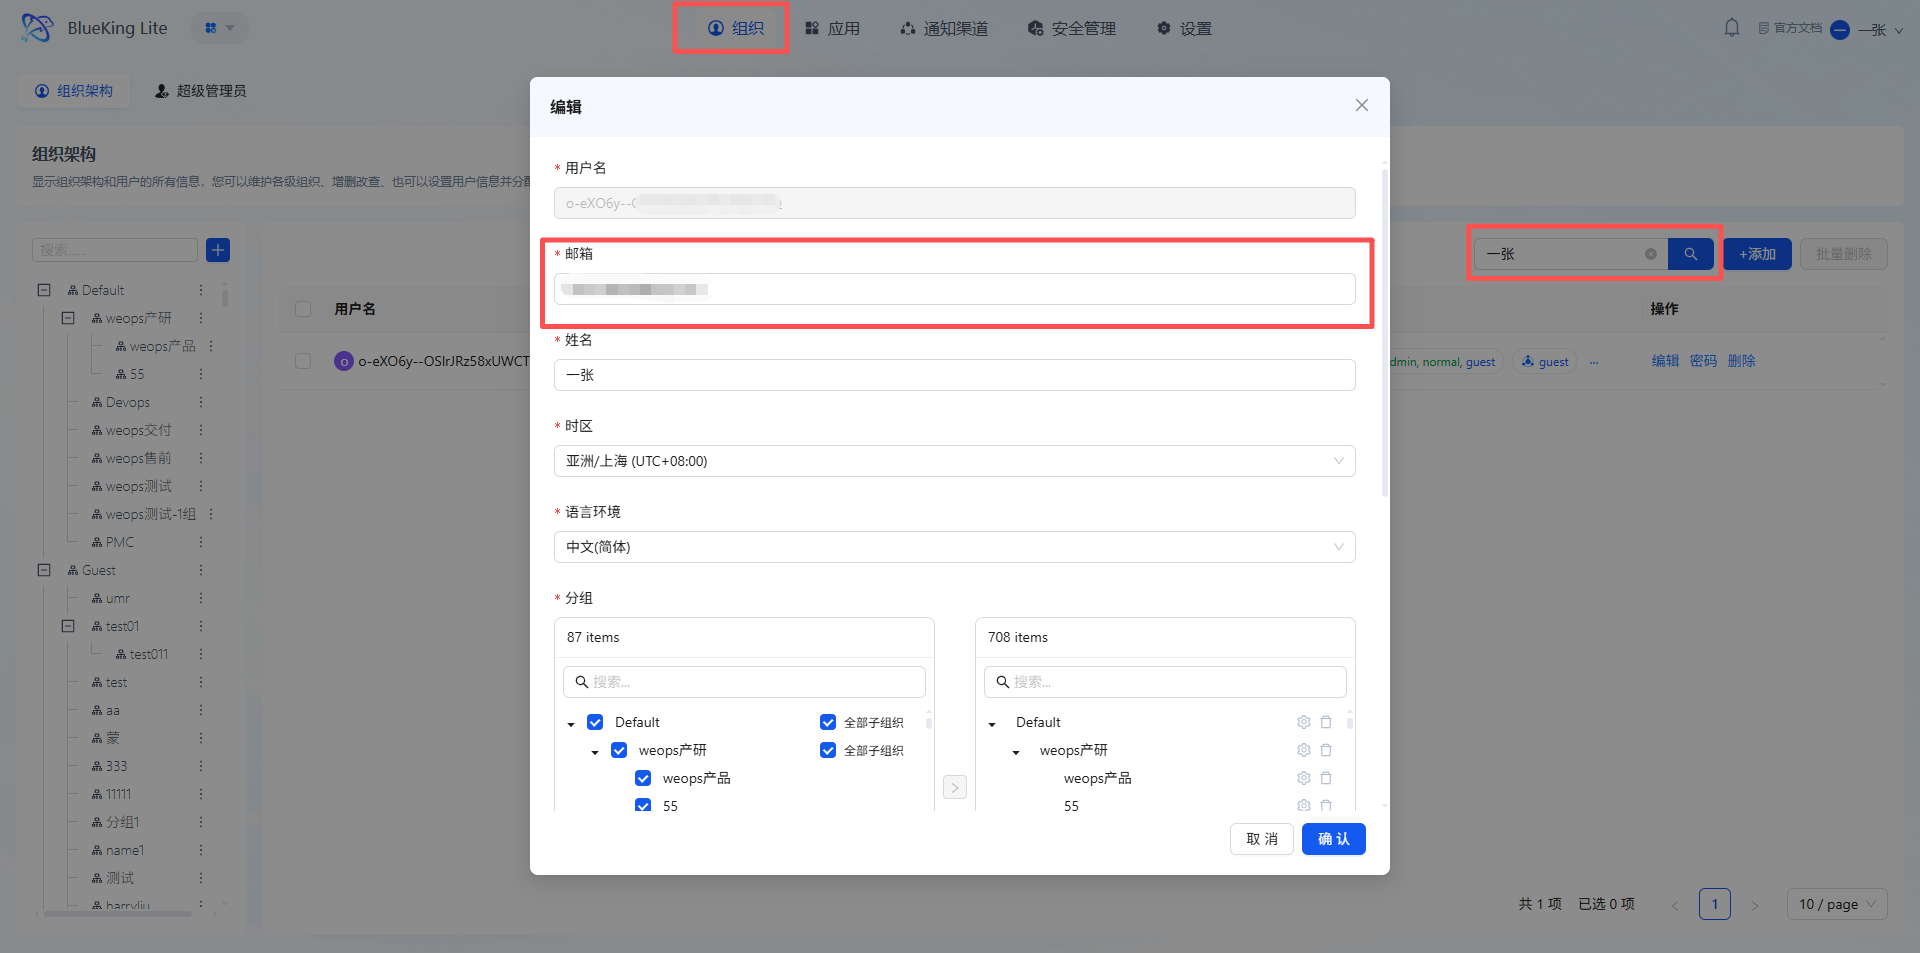
3.2 Notification Method Configured
- Log in to the BlueKing Lite platform -> Settings navigation bar -> Organization -> Search username -> Configure the email address for receiving reports (DingTalk/WeCom can configure bot Webhooks)
3.3 Agent Nodes Configured
First complete the configuration of two core agents in the "Agents" module, then return to the Studio to associate them:

Agent 1: Web Application Inspection Assistant
- Core Function: Executes automated Web application inspection tasks, checks all menus on target pages in a fixed order and records status, outputting a basic inspection report containing the check results for each menu.
- Configuration Steps:
- Select "Web Application Inspection Assistant" in the agent list and enter the configuration page;
- Select and configure a compatible LLM model in the configuration panel;
- Add inspection login information (username, password) in the prompt configuration area;
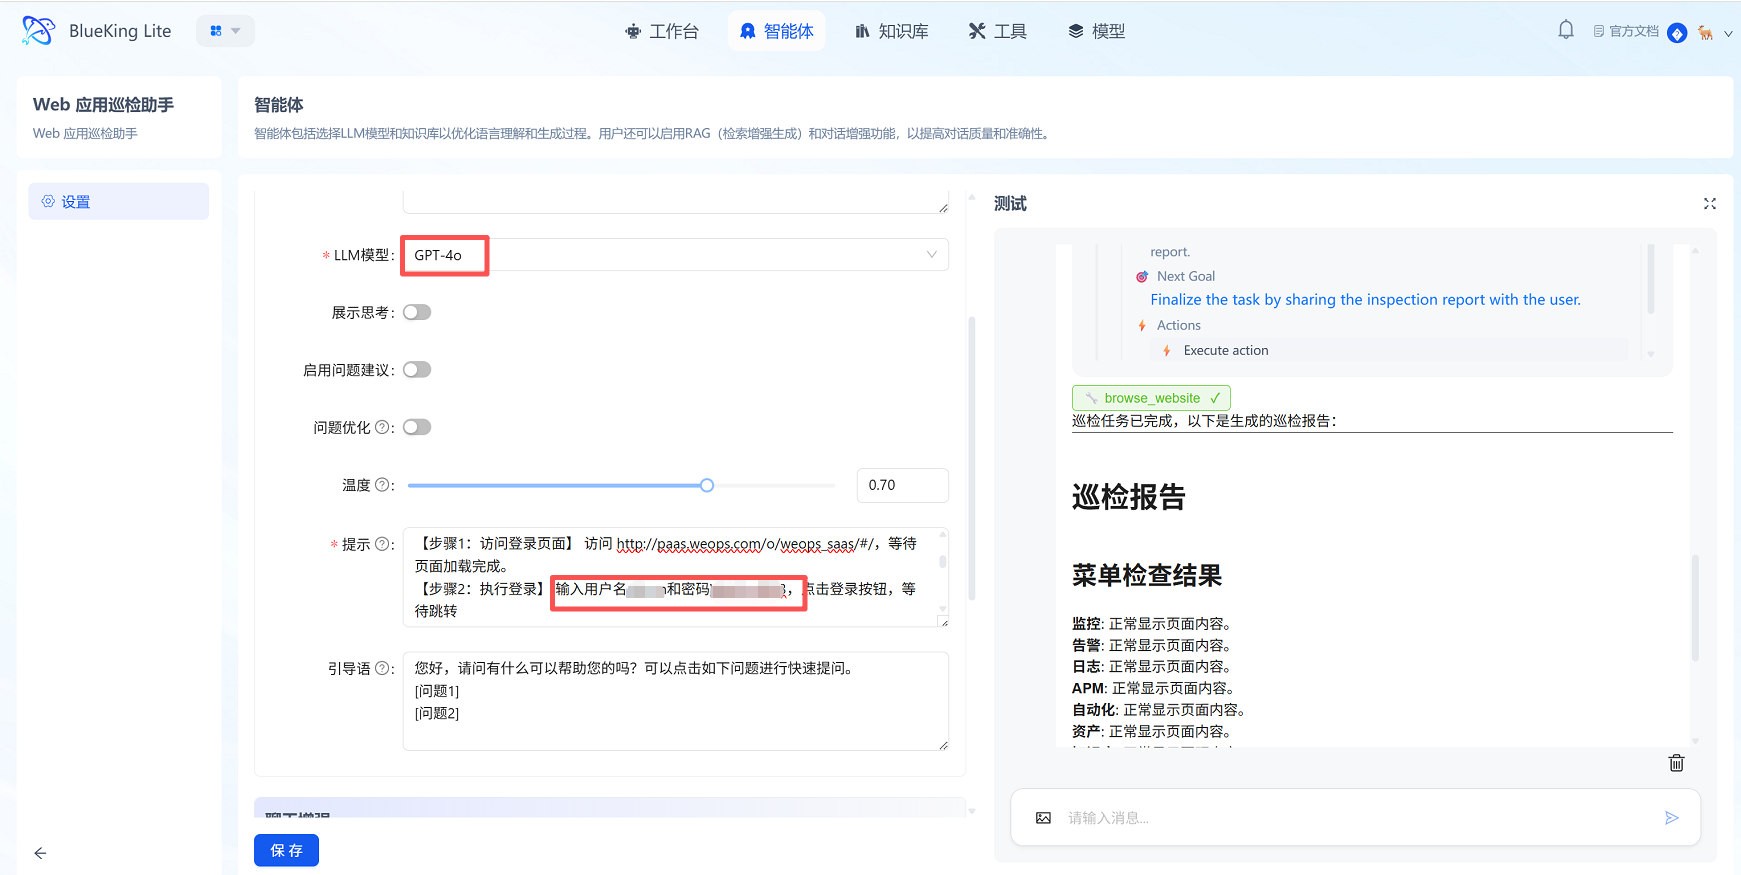
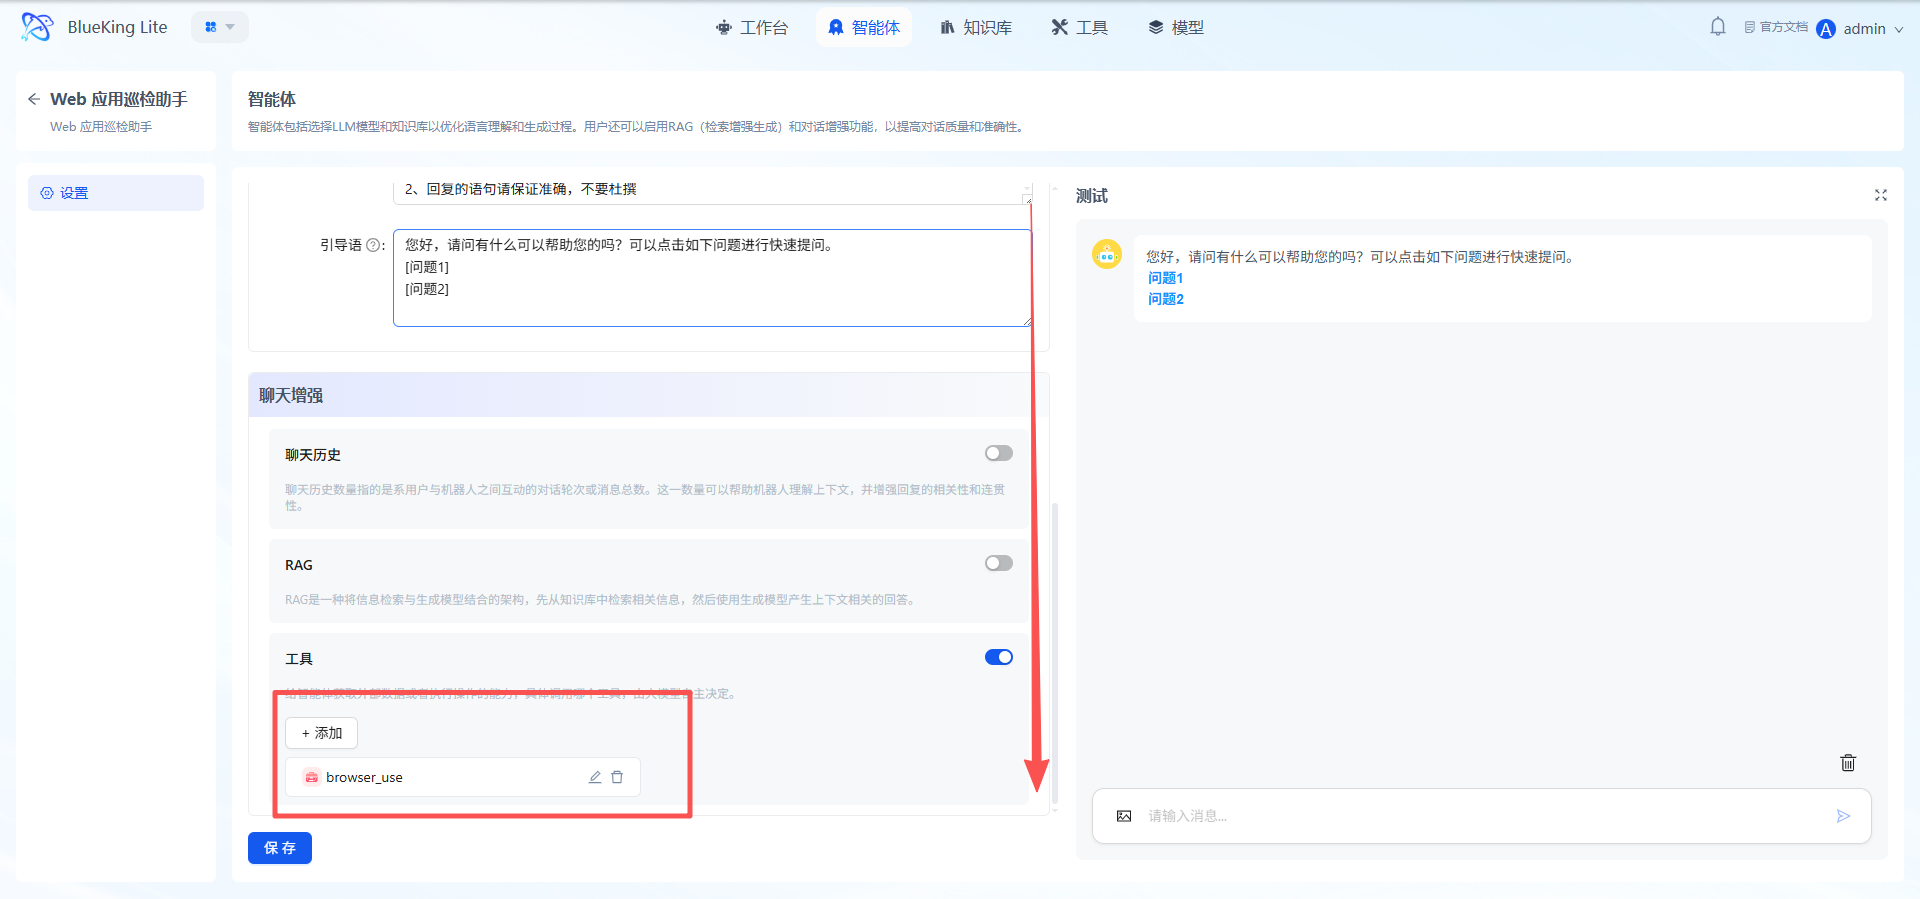
- Configure the tool [Browser_USE], confirm the configuration is correct, then click "Save."
Agent 2: Web Application Data Summary
- Core Function: Processes raw inspection results into a standardized HTML email table report, scoring inspection items according to rules, calculating total scores and overall ratings, and generating visual reports that can be directly embedded in emails.
- Configuration Steps:
- Select "Web Application Data Summary" in the agent list and enter the configuration page;
- Select and configure a compatible LLM model in the configuration panel;

- Confirm the configuration is correct, then click "Save."
IV. Operation Steps
Key Tip: Before entering this section, ensure all configurations in "Preparation" are complete; otherwise, the pipeline configuration cannot be completed successfully.
4.1 Enter the Configuration Page
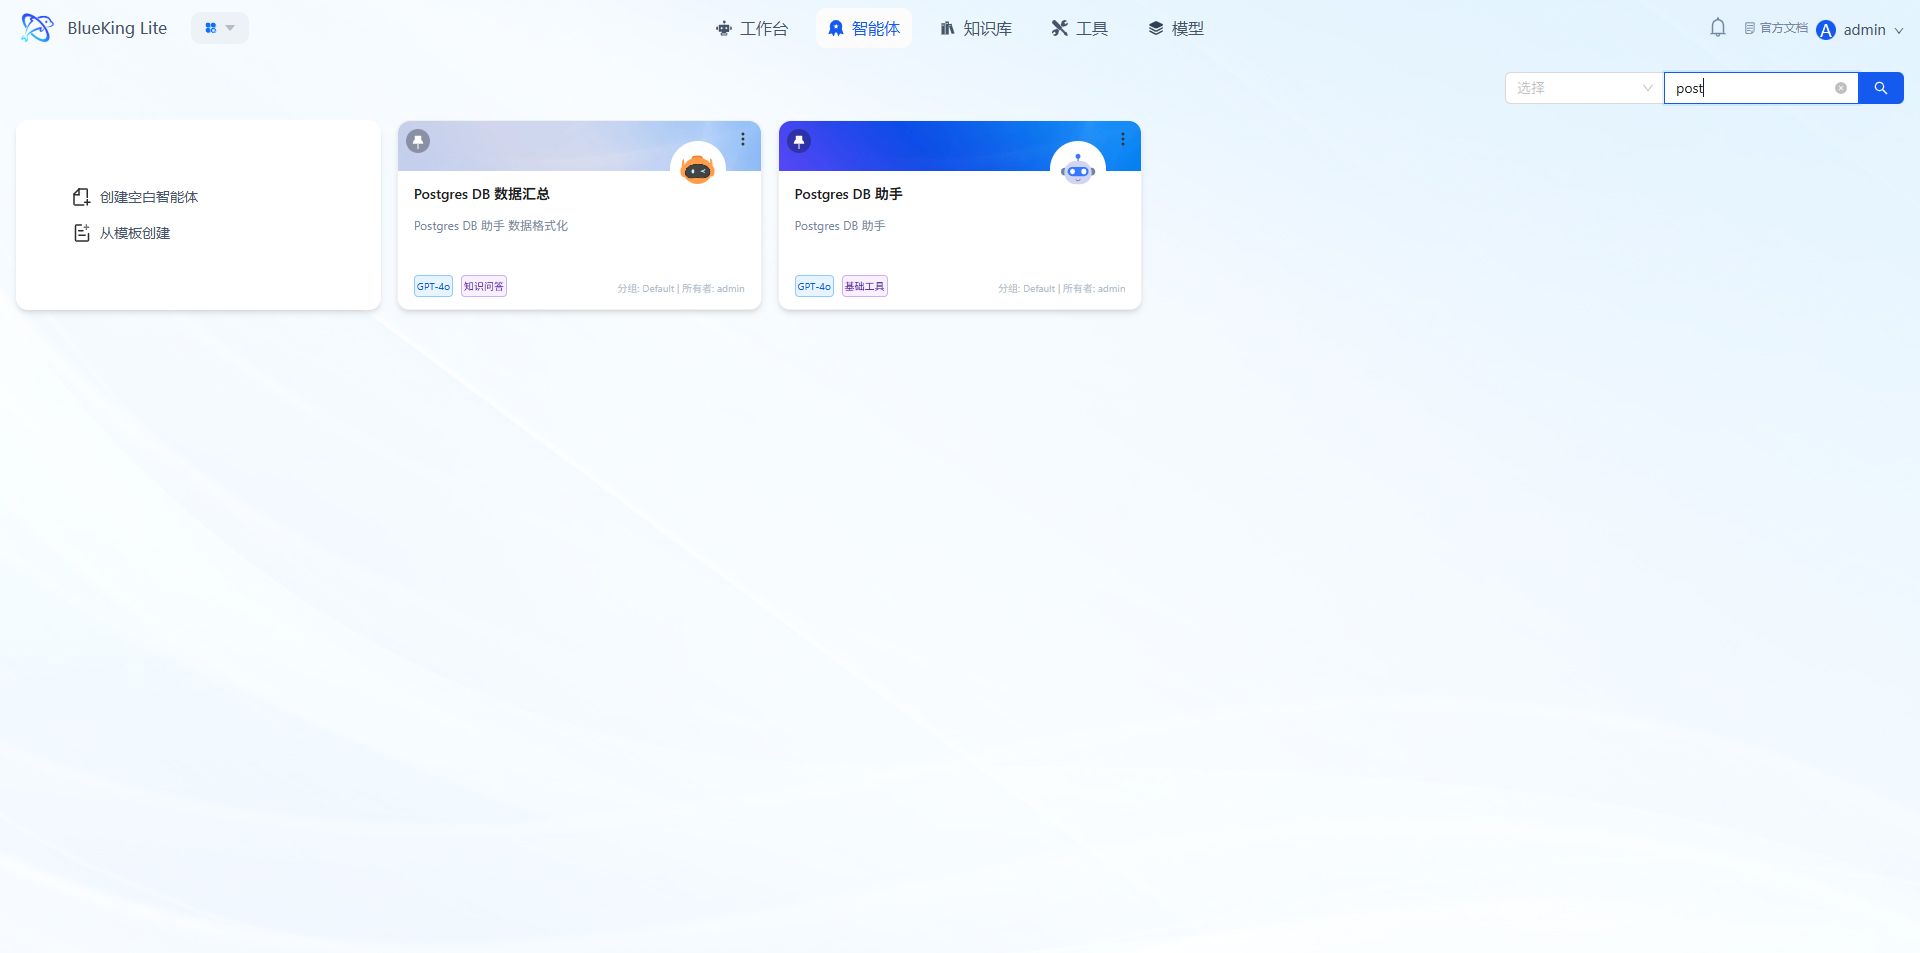
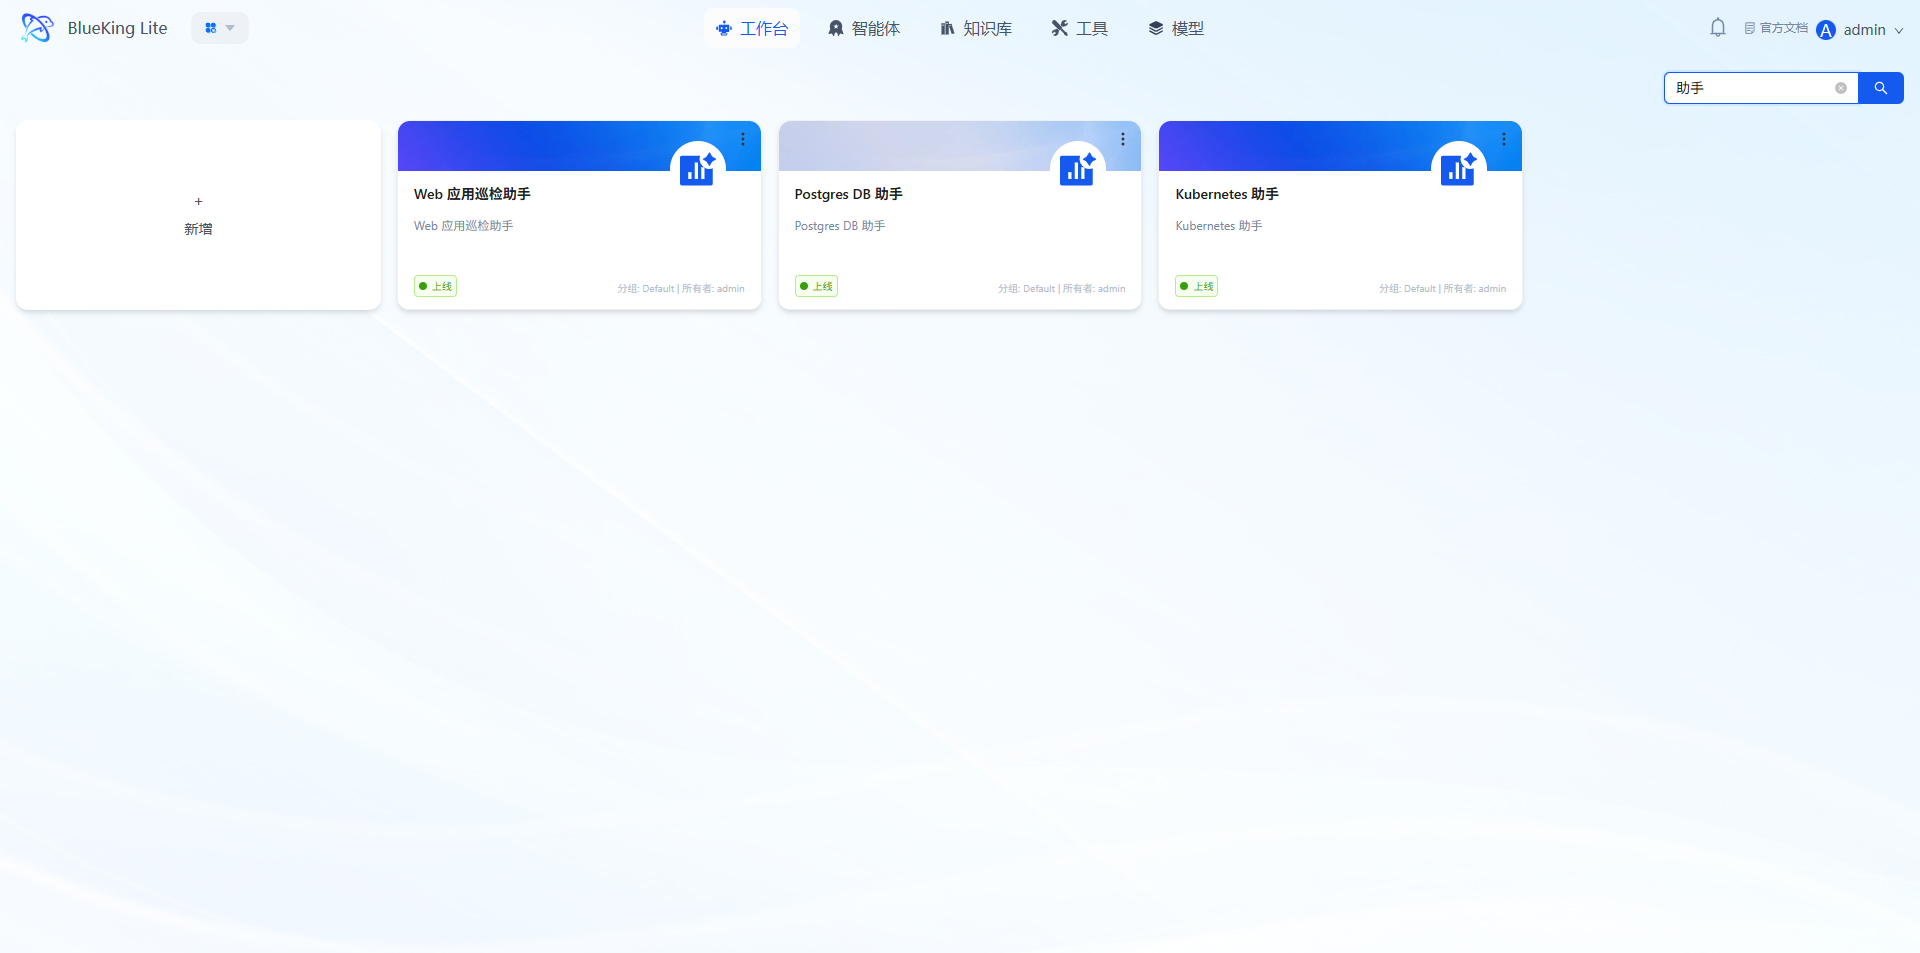
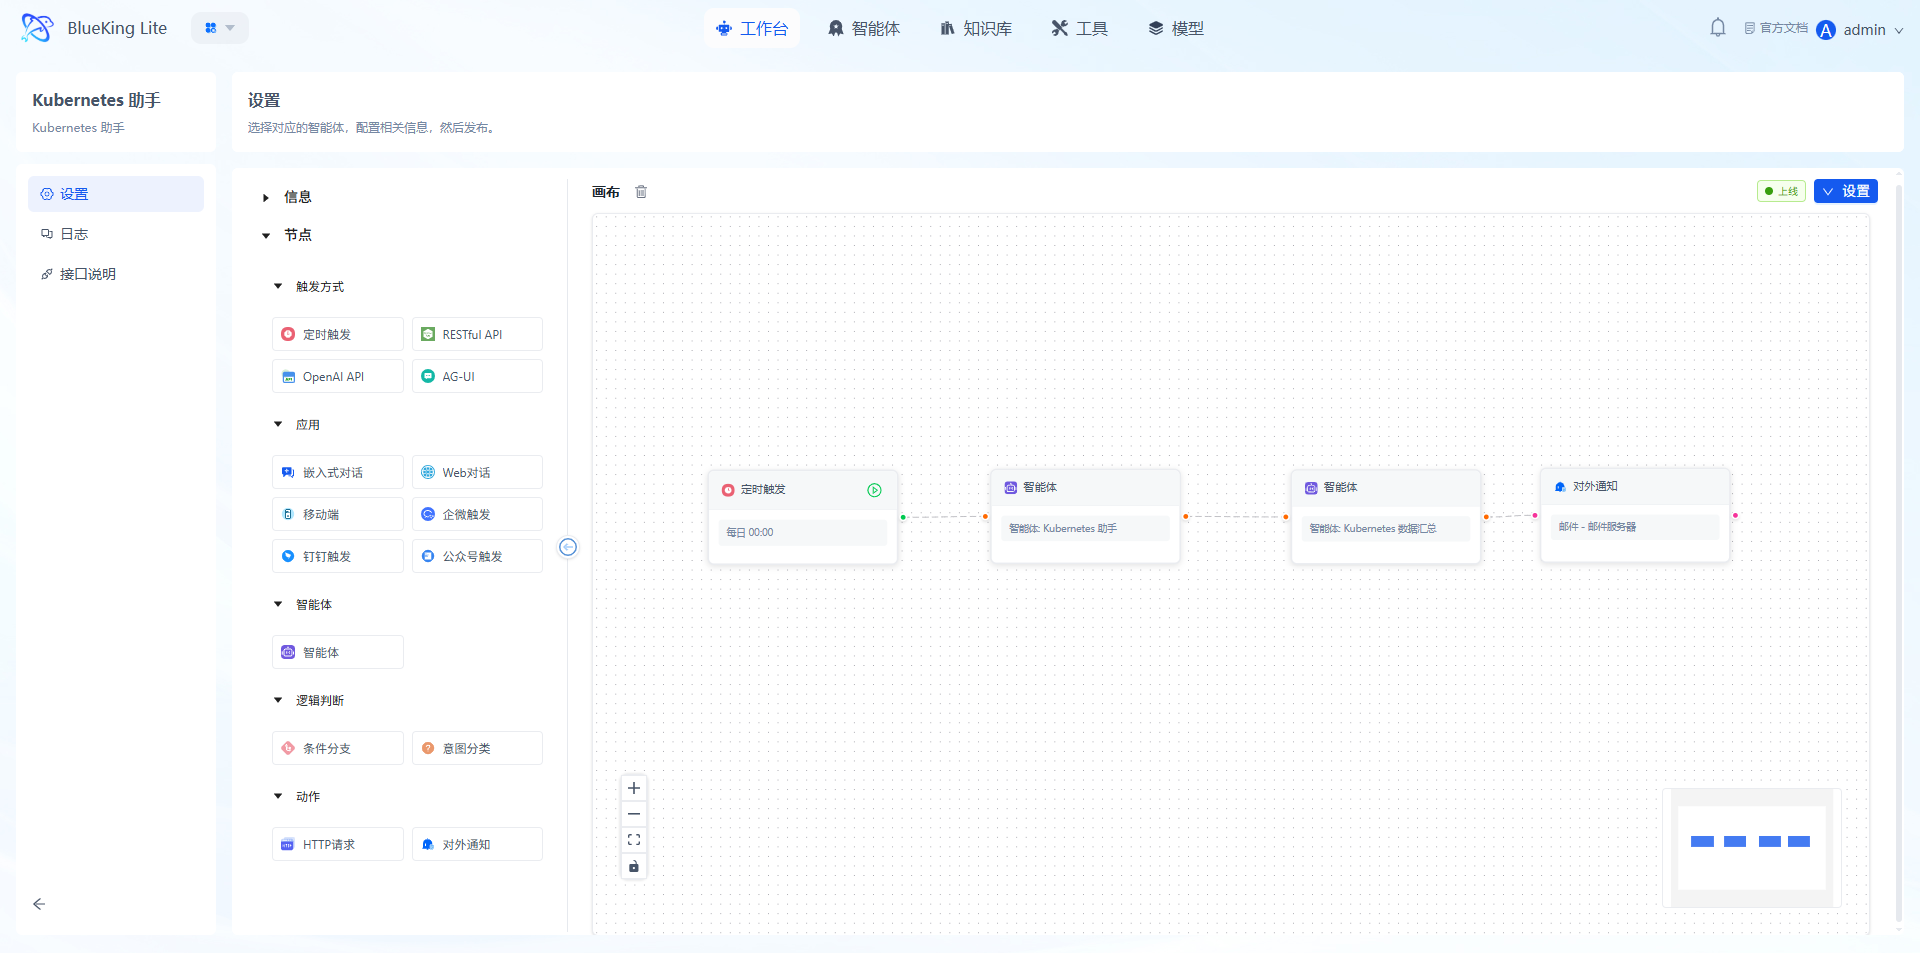
- OpsPilot navigation bar -> Studio -> Click the "Web Application Inspection Assistant" card to enter the configuration canvas.
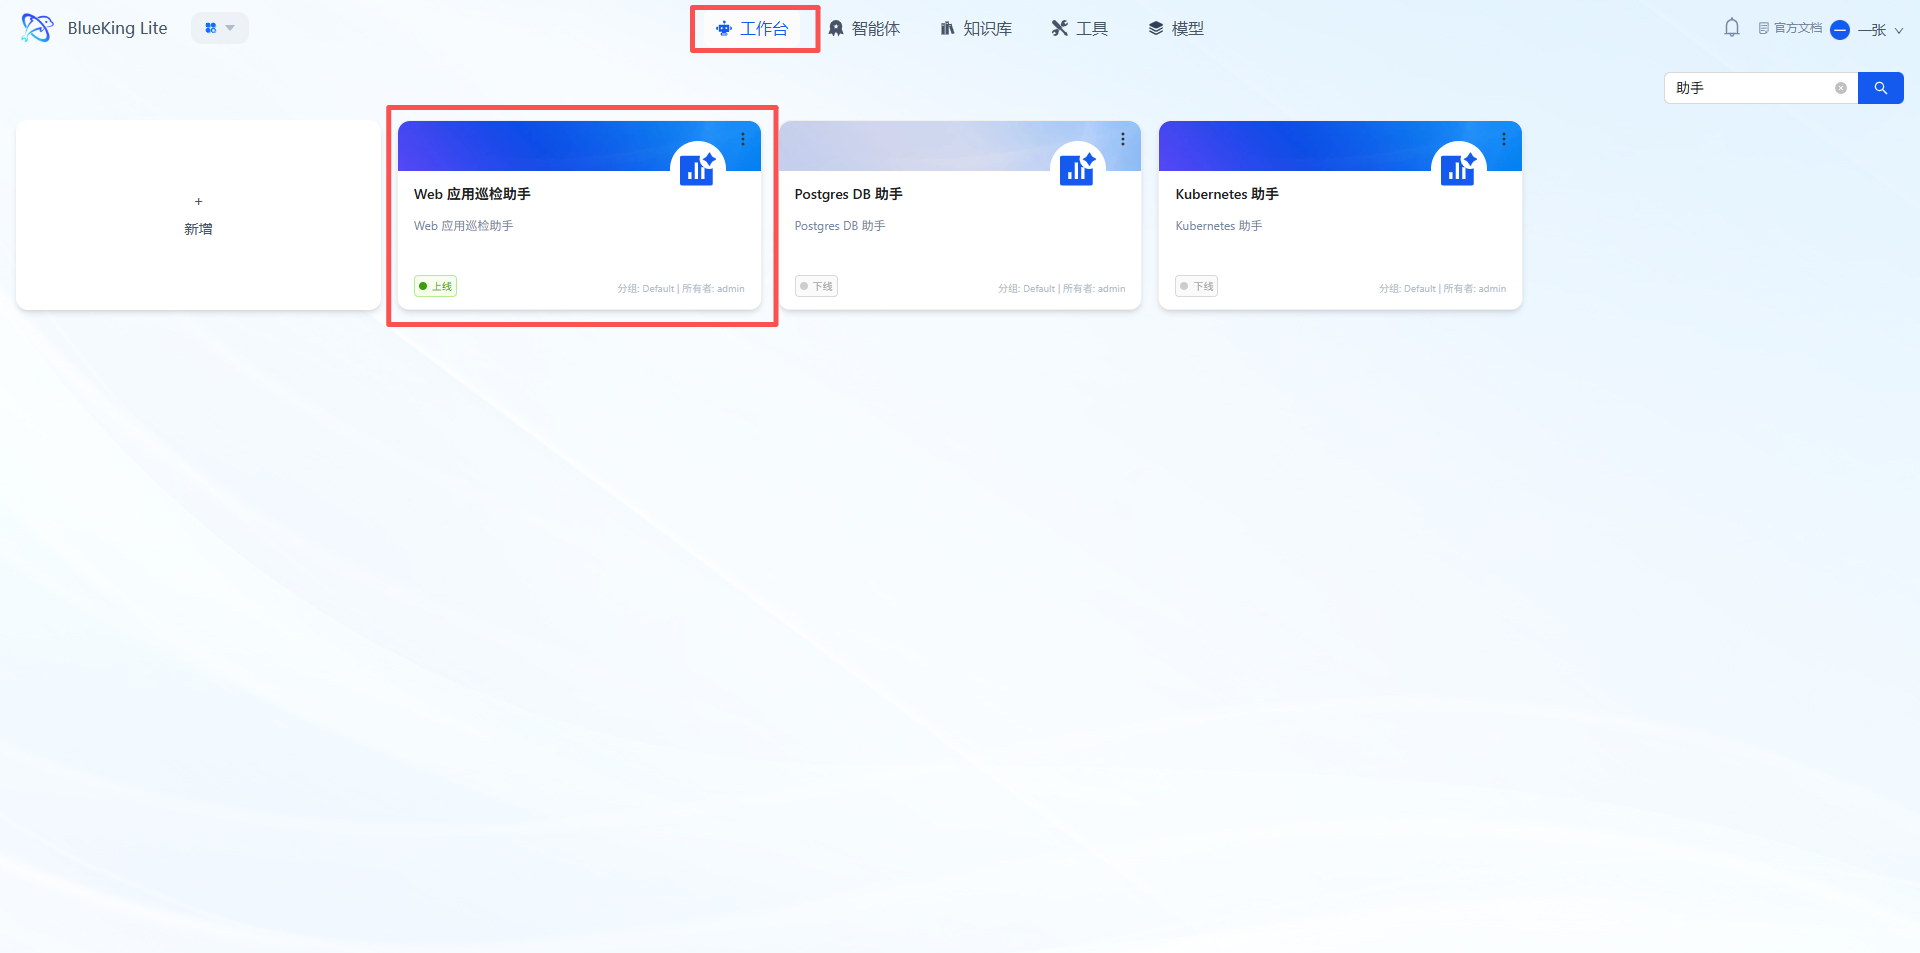
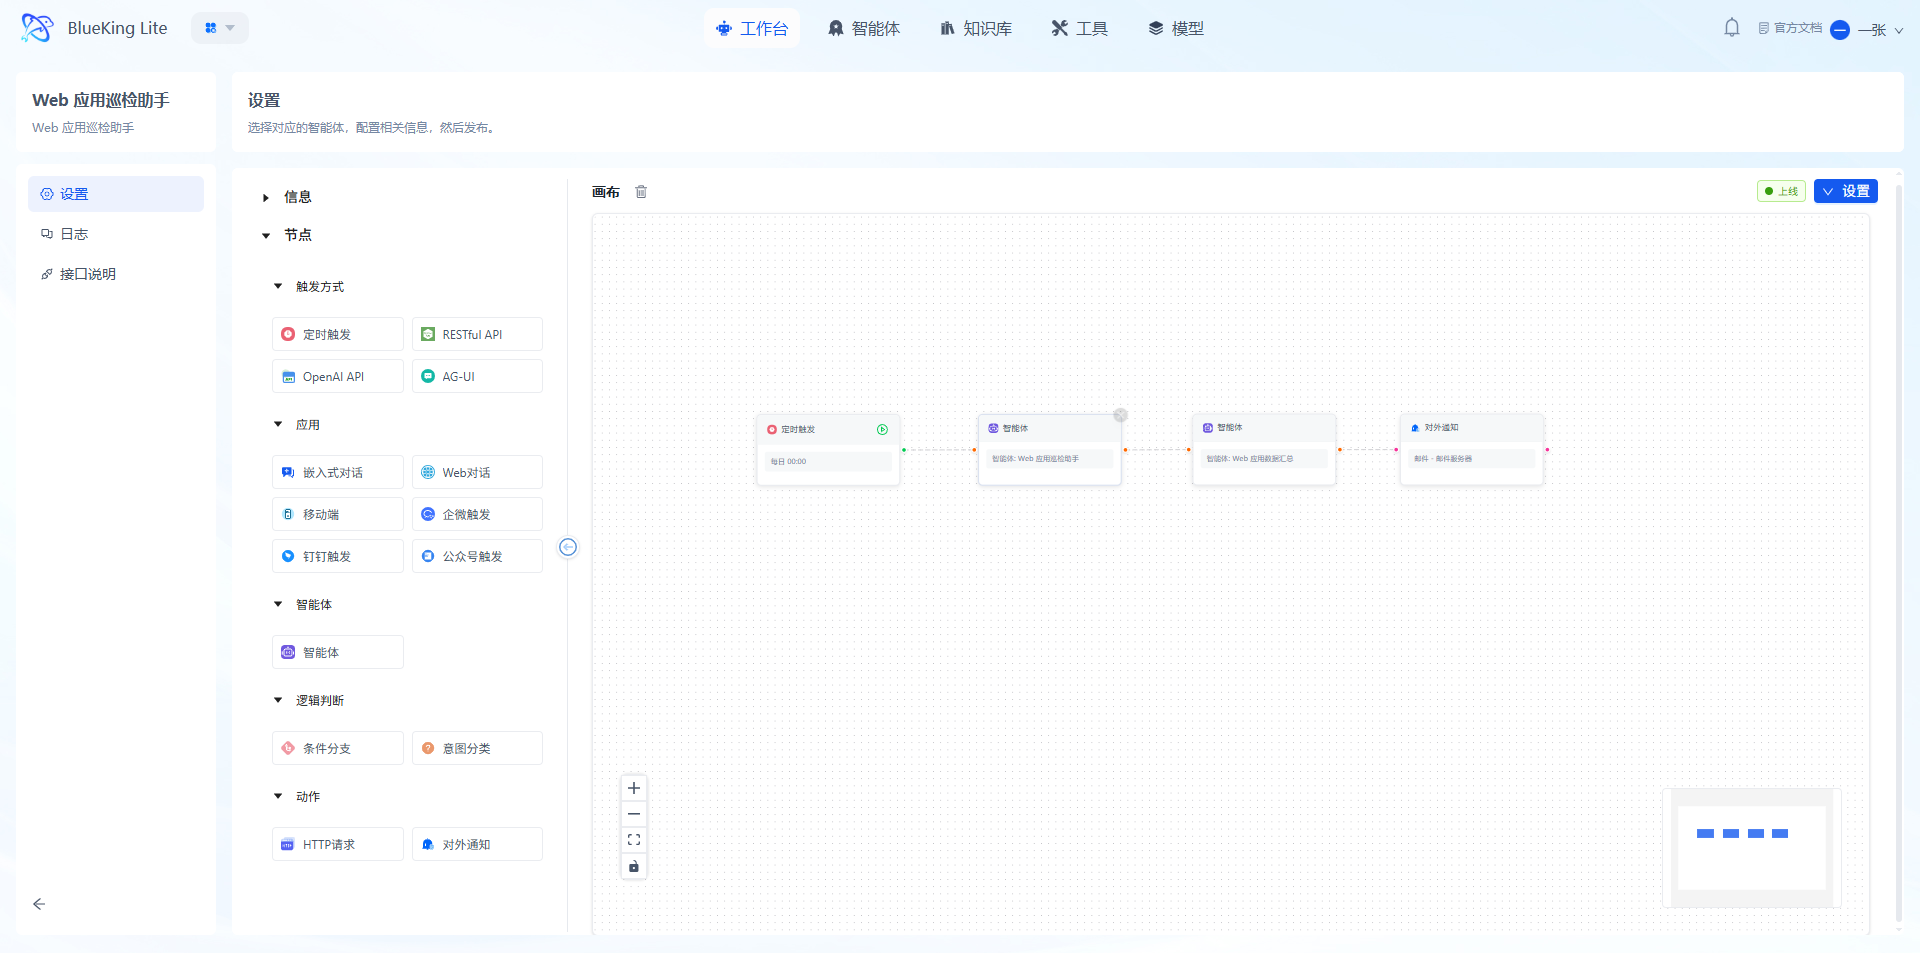
Note: The canvas has a pre-generated complete pipeline of "Scheduled Trigger -> Web Application Inspection Assistant -> Web Application Data Summary -> External Notification." You only need to configure the parameters for each node:
4.2 Set Trigger Method
- Click the "Scheduled Trigger" node on the canvas to open the configuration popup:
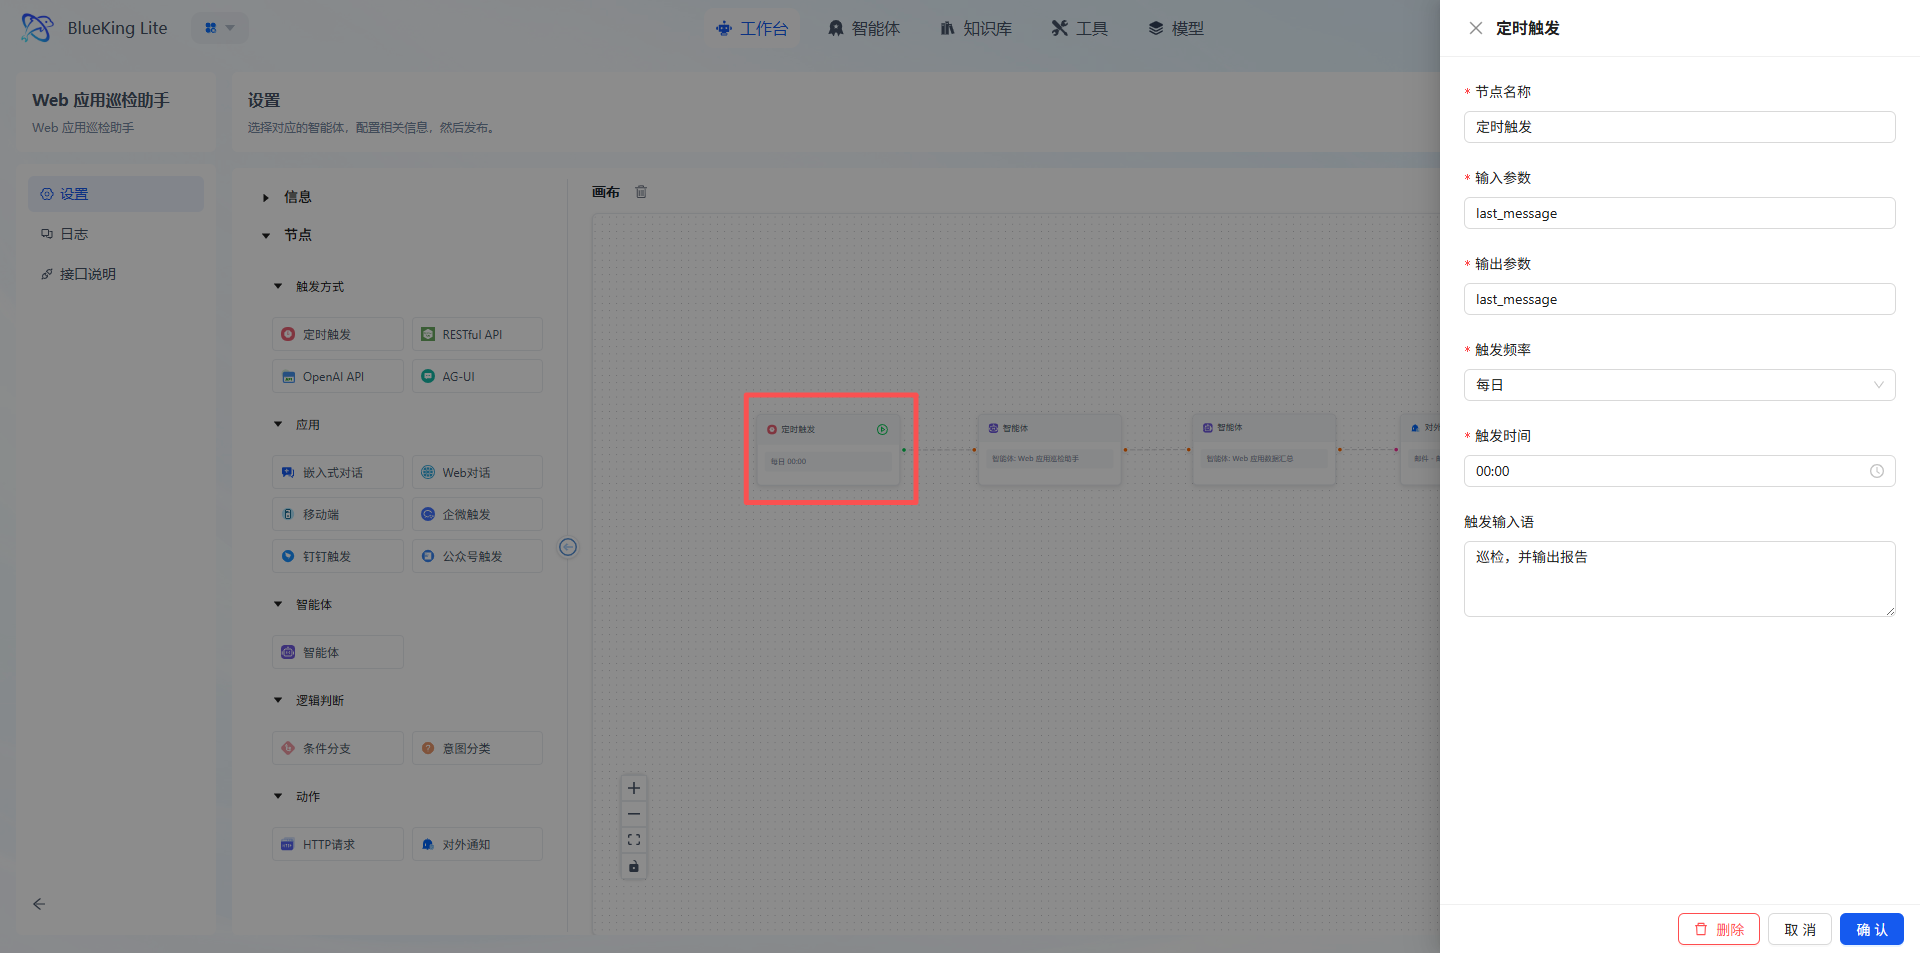
- (Optional) Other trigger methods, such as RESTful API trigger: Switch the trigger mode to "RESTful API" and configure the API call address.
Warning: Trigger rules will only take effect after the pipeline is published.
4.3 Configure Agent Nodes
The "Web Application Inspection Assistant" and "Web Application Data Summary" nodes on the canvas are already associated by default. Please ensure the agent parameters have been configured properly. If no special requirements, keep the defaults; if adjustments are needed, click the node to select other configured agents.
4.4 Configure External Notification
- Click the "External Notification" node, ensure the receiving email has been configured in Settings, and configure the core information:
- Notification channel: Select the target channel such as email, WeCom bot, etc.;
- Recipients: Add personnel/groups who need to receive the inspection report;
- Notification title: Customize the title (e.g., "WeOps Platform Web Application Inspection Report");
- Click "Confirm."
4.5 Publish and Verify
- Confirm all node configurations are complete -> Click "Settings" -> Save & Publish;
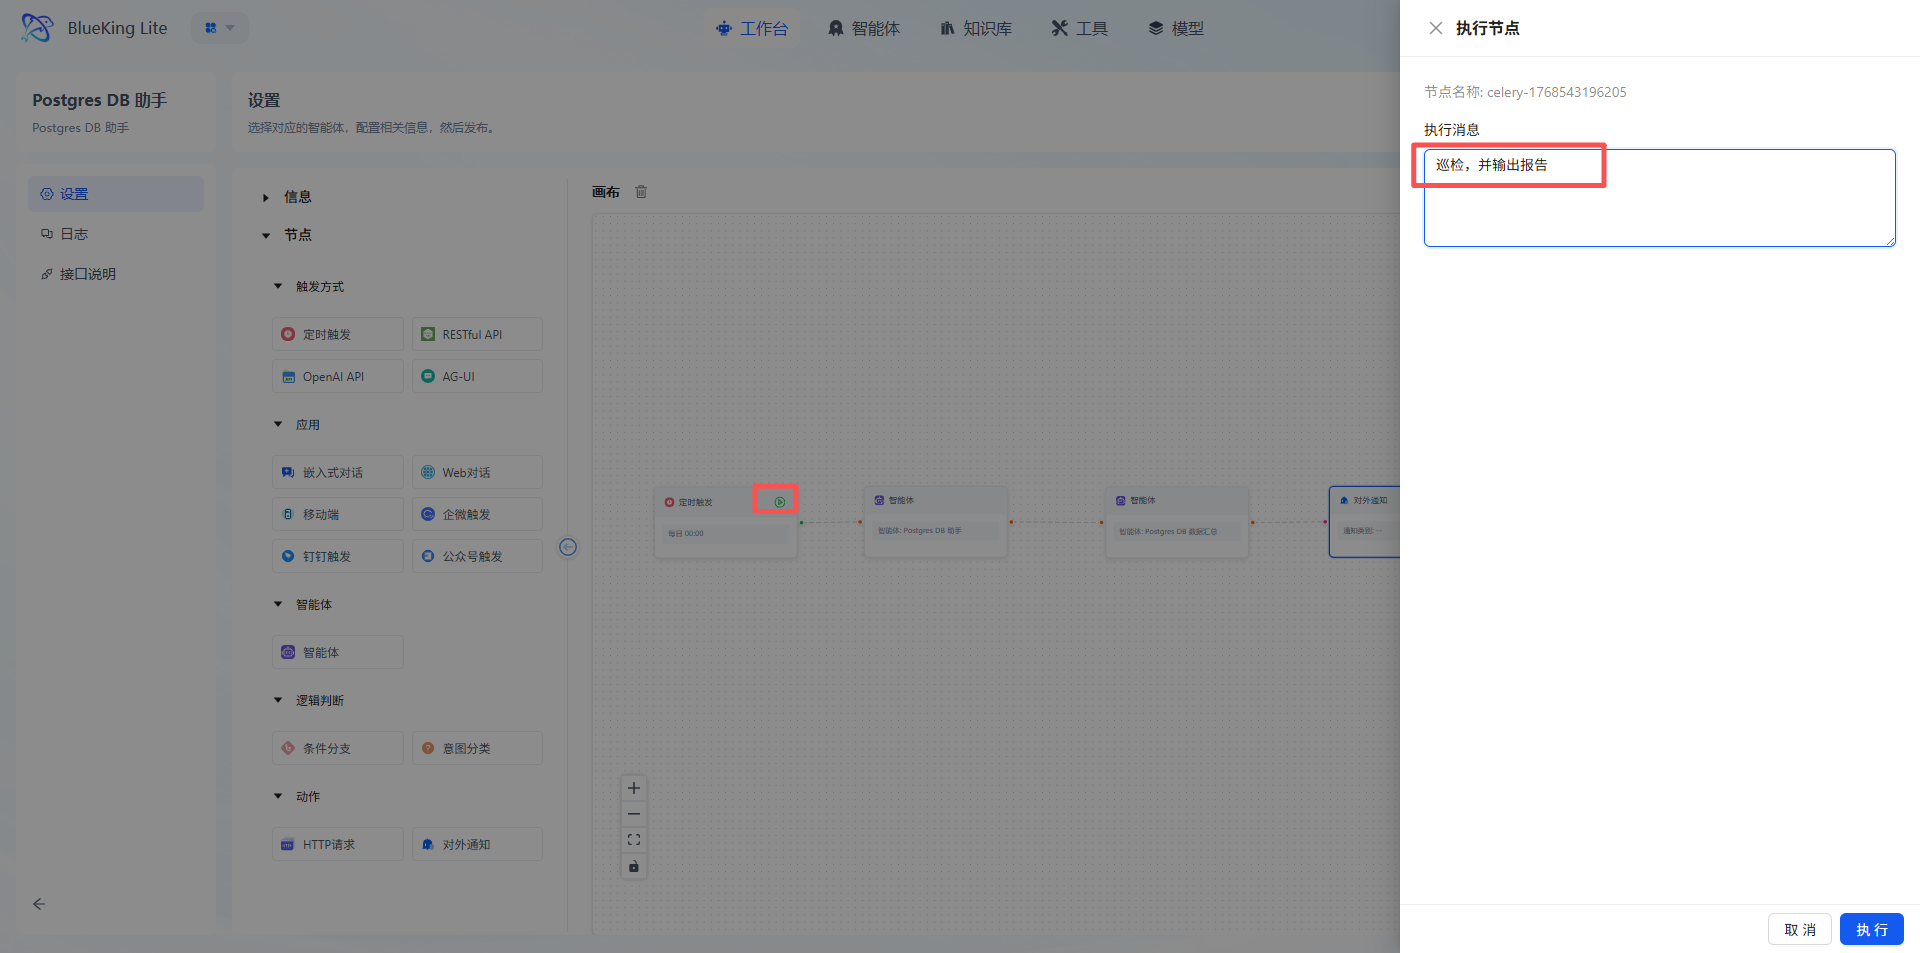
- Trigger the task:
- Auto trigger: Wait for the scheduled cycle to arrive
- Manual trigger: Click the Execute Node button on the trigger node, input "Inspect and generate report"
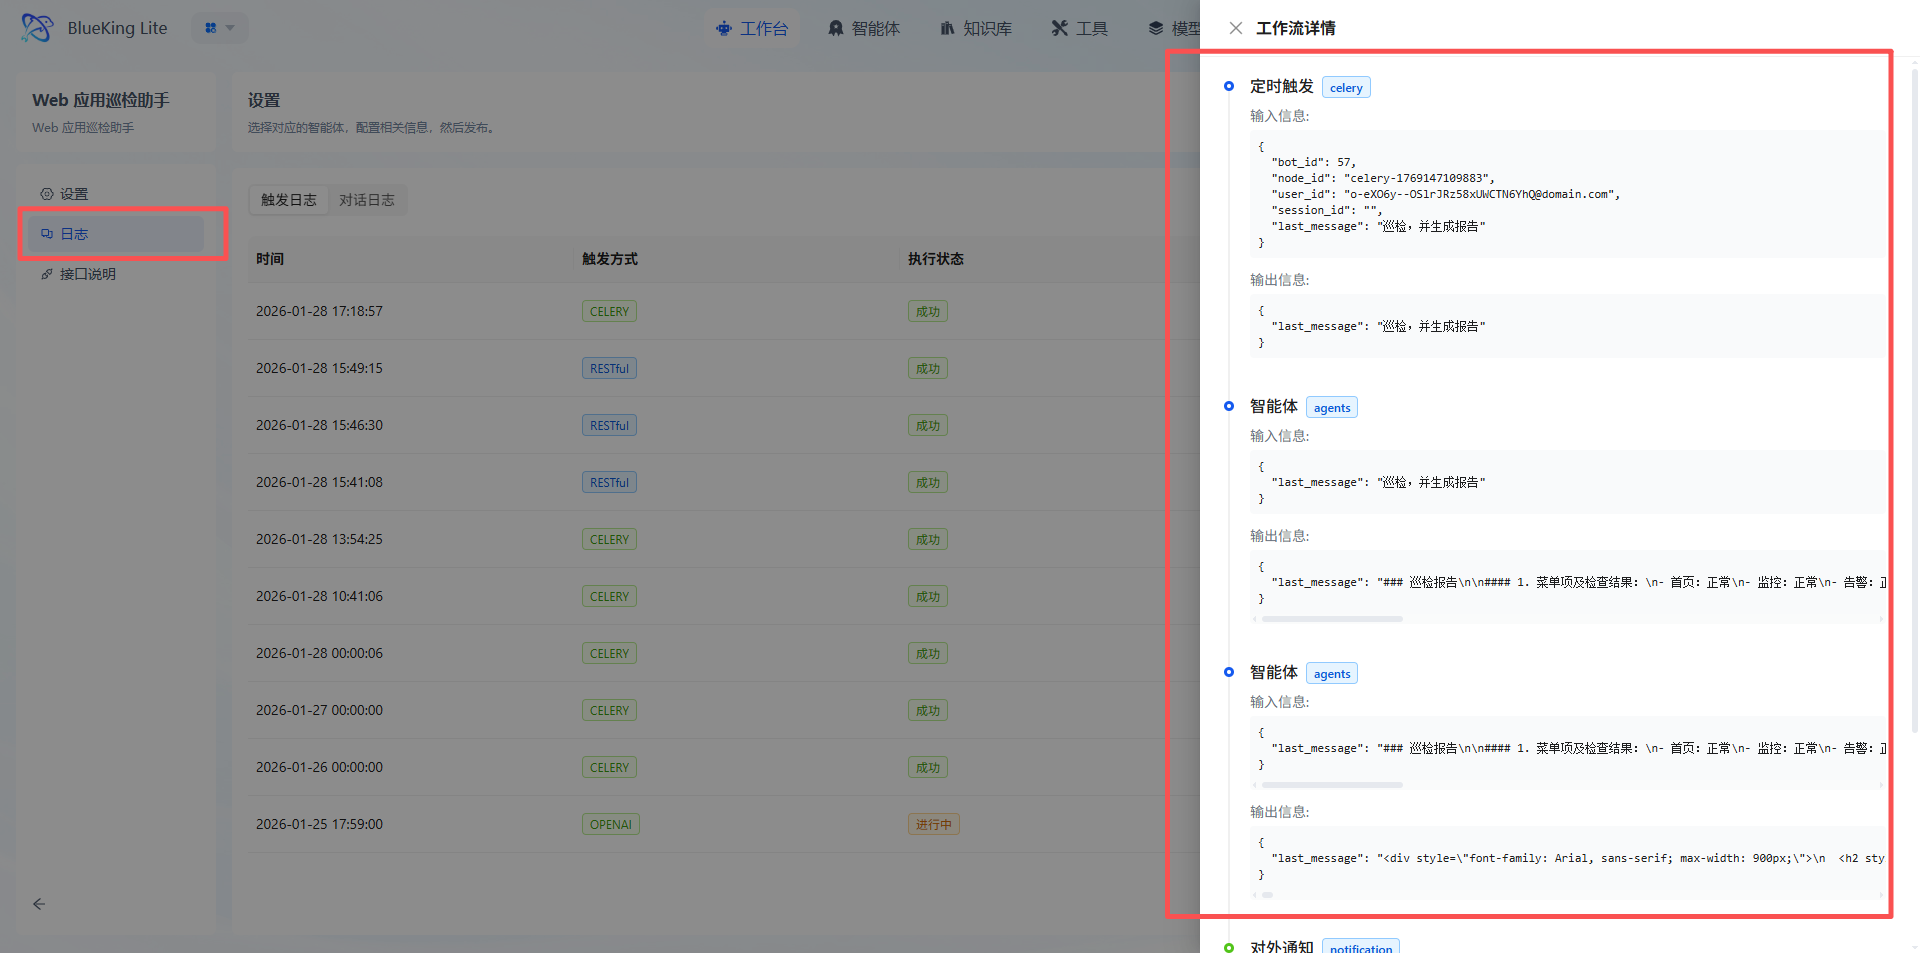
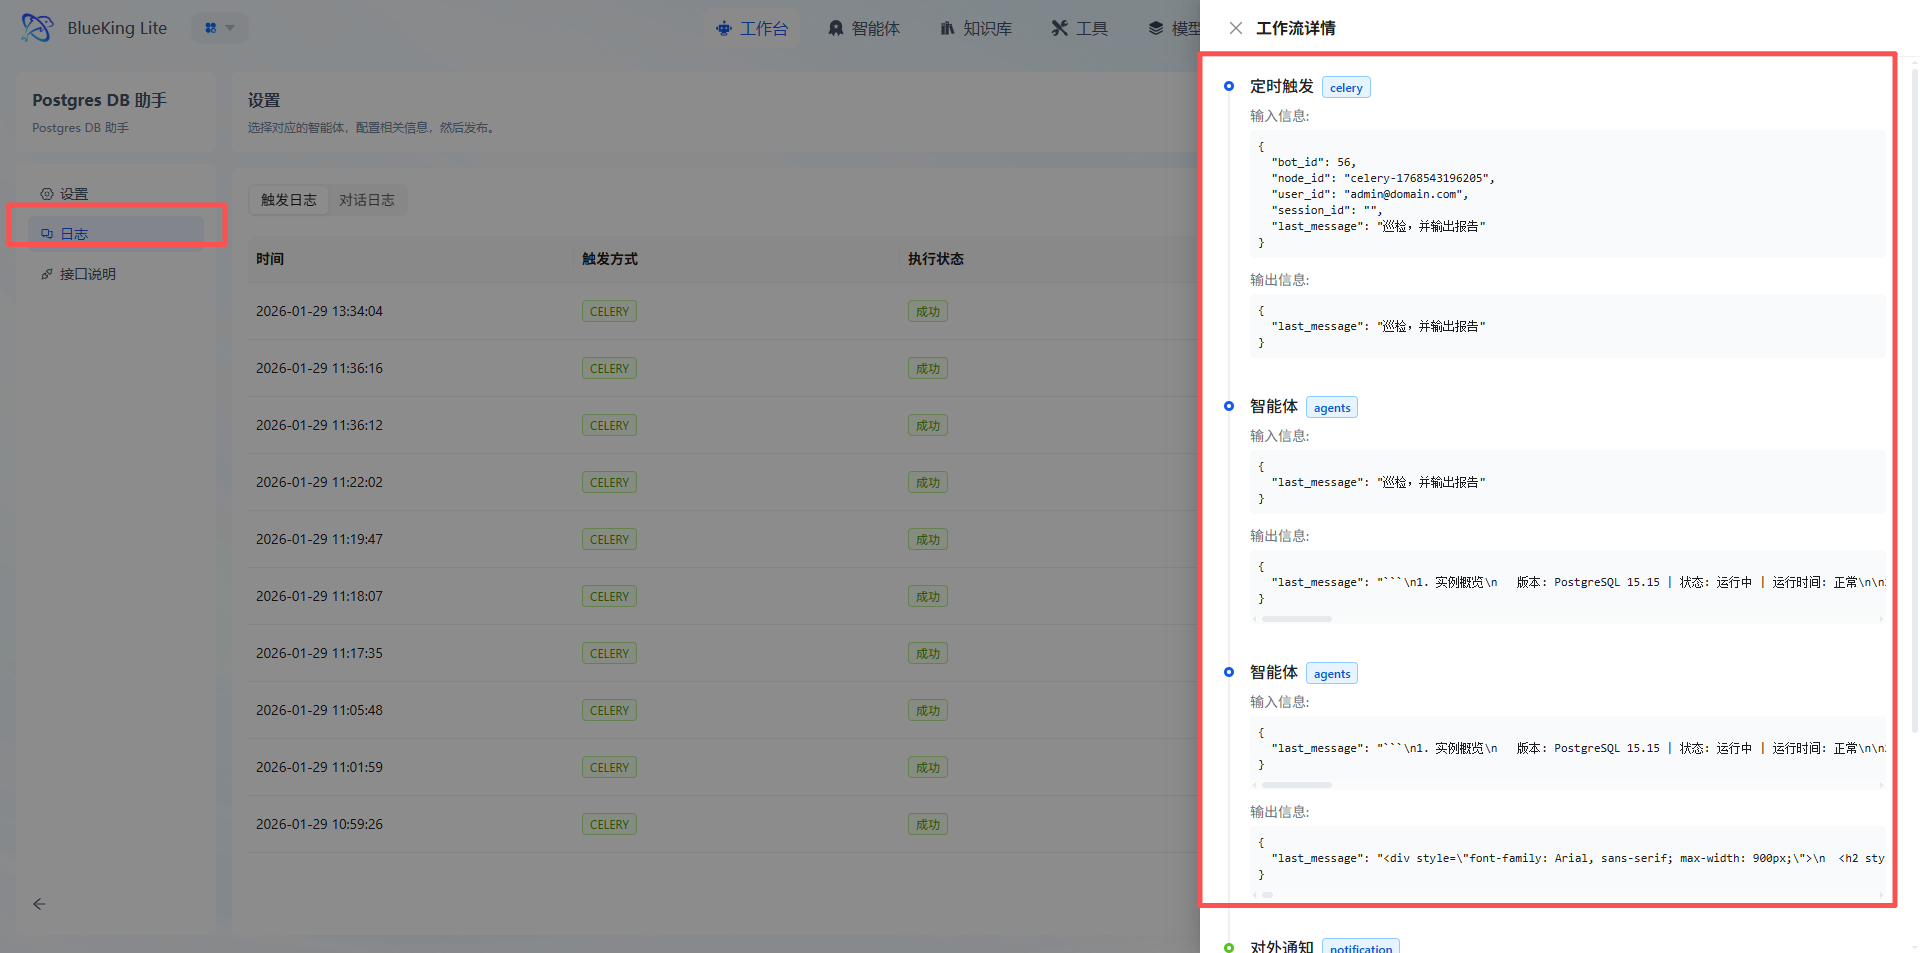
- Verify results:
- Confirm the notification channel received the inspection report
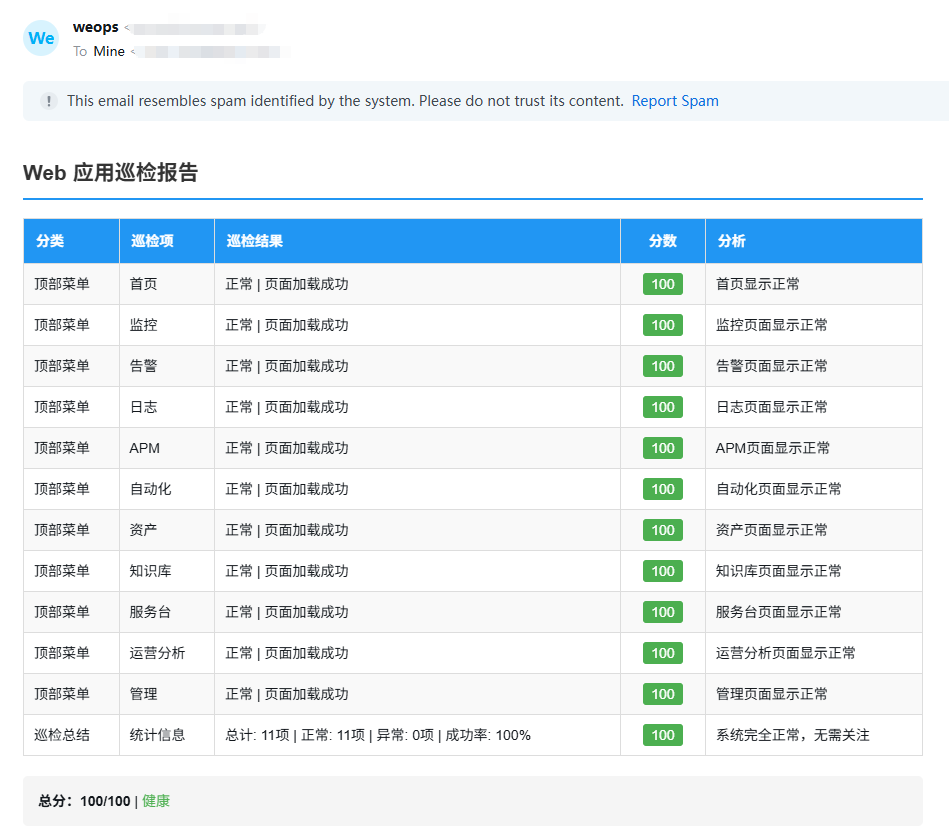
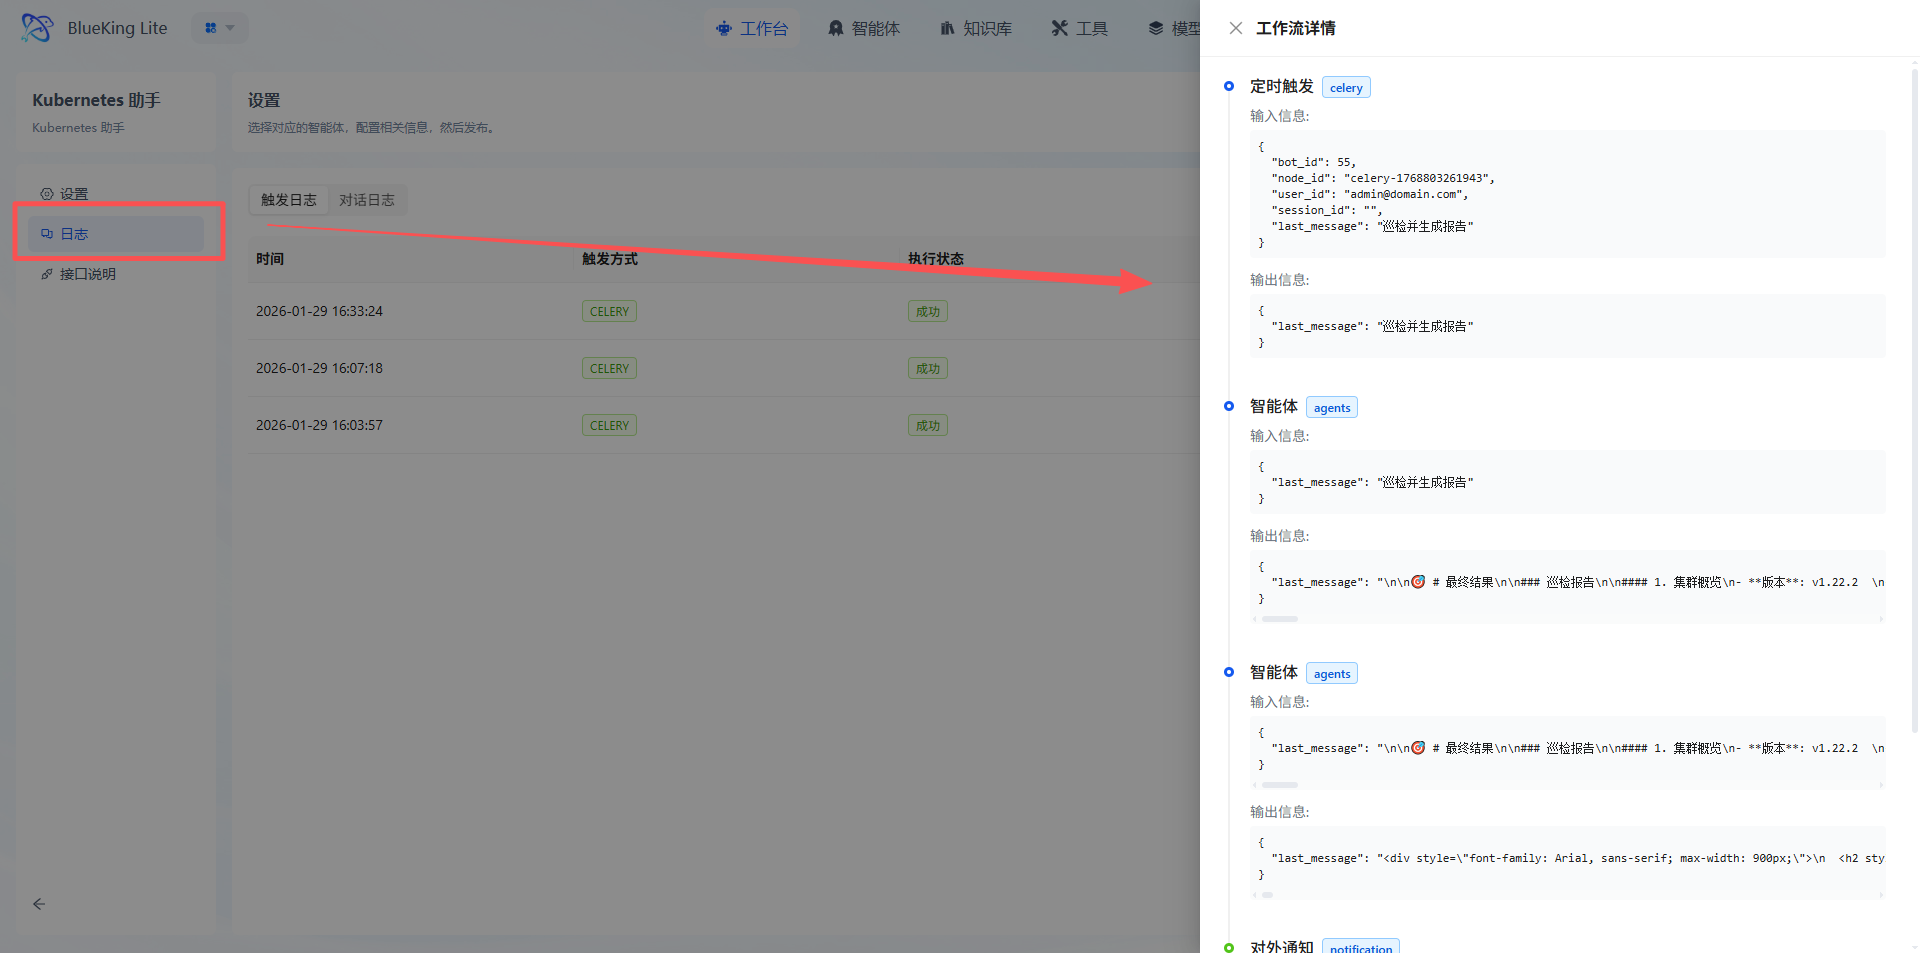
- View execution records on the log page
- Confirm the notification channel received the inspection report
Postgres DB Assistant Quick Start Guide
I. Feature Overview
The Postgres DB Assistant is an automated database inspection tool. Through a dual-agent collaboration model, it achieves full-process automation from metric inspection -> result analysis -> report generation -> alert notification for PostgreSQL databases. Without writing SQL or scripts, you can complete routine database health checks.
This assistant focuses on outputting anomalies and risk items, automatically generating standardized HTML inspection reports, significantly reducing manual inspection costs and improving database operations efficiency and visualization.
Core Capabilities
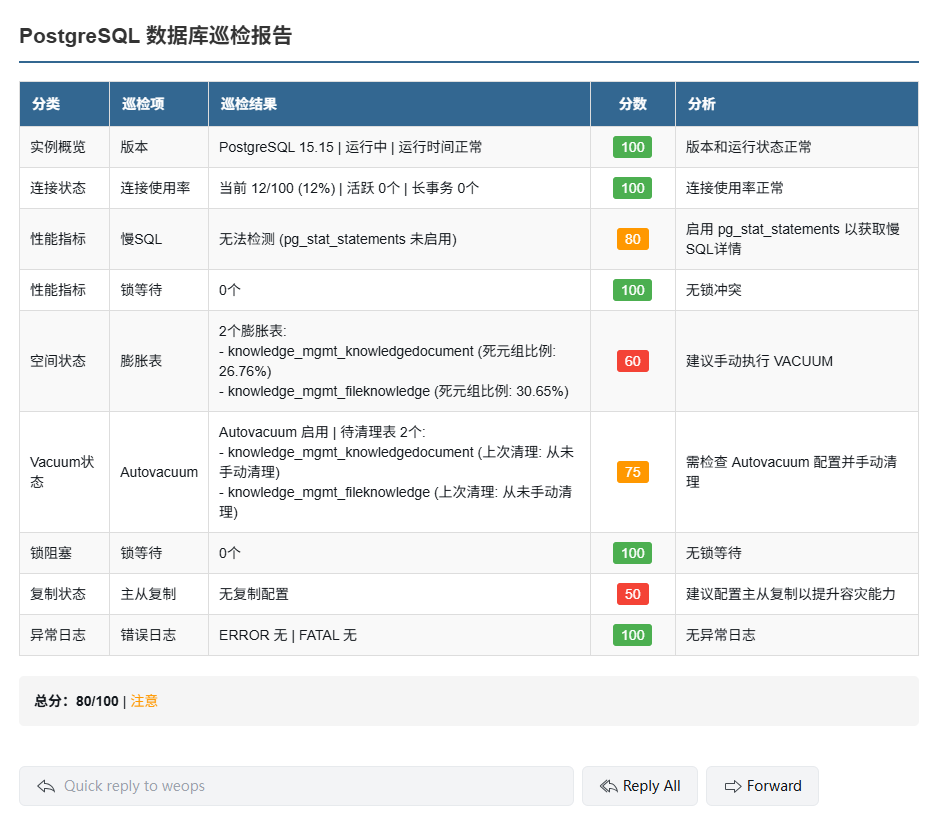
- Intelligent Inspection: Automatically collects instance status, connections, performance, storage, lock blocking, and other 8 core metric categories, outputting only anomalous or high-risk information;
- Report Generation: Organizes inspection results into HTML inspection reports with scores and analysis conclusions, viewable directly via email;
- Flexible Triggering: Supports scheduled triggers, manual execution, API calls, and other methods; anomaly results can be automatically notified through email and other channels.
II. Applicable Scenarios and Users
2.1 Applicable Scenarios
- Performing quick, automated inspections on PostgreSQL instances, focusing on anomalies and risk items
- Generating database health inspection reports on a scheduled or on-demand basis for email, group notifications, etc.
- Operations workflows that want to automatically organize structured inspection results into standardized HTML reports
2.2 Target Users
- Database operations personnel: Execute quick inspections on PostgreSQL instances, promptly identify anomalies and risks
- SRE / Platform operations: Generate standardized database inspection reports on schedule for email or group notifications
- Technical support personnel: Quickly obtain instance health status overview before troubleshooting
- Enterprise technical teams: Complete PostgreSQL health checks and result summaries through agent automation
III. Preparation (Important)
Before configuring the assistant, ensure the following preparations are complete:
3.1 LLM Model Configured
- Log in to the BlueKing Lite platform -> OpsPilot navigation bar -> Models -> LLM Model -> Add and enable an available LLM model
- Model Name: The official technical name of the model (e.g.,
gpt-oss:120b), must match the interface-side definition. - URL: The API address of the model interface.
- API Key: The authorization key for accessing the model interface; keep it secure.
3.2 Notification Method Configured
- Log in to the BlueKing Lite platform -> Settings navigation bar -> Organization -> Search username -> Configure the email address for receiving reports (DingTalk/WeCom can configure bot Webhooks)
3.3 Configure Agent Nodes
- Log in to the BlueKing Lite platform -> OpsPilot navigation bar -> Agents
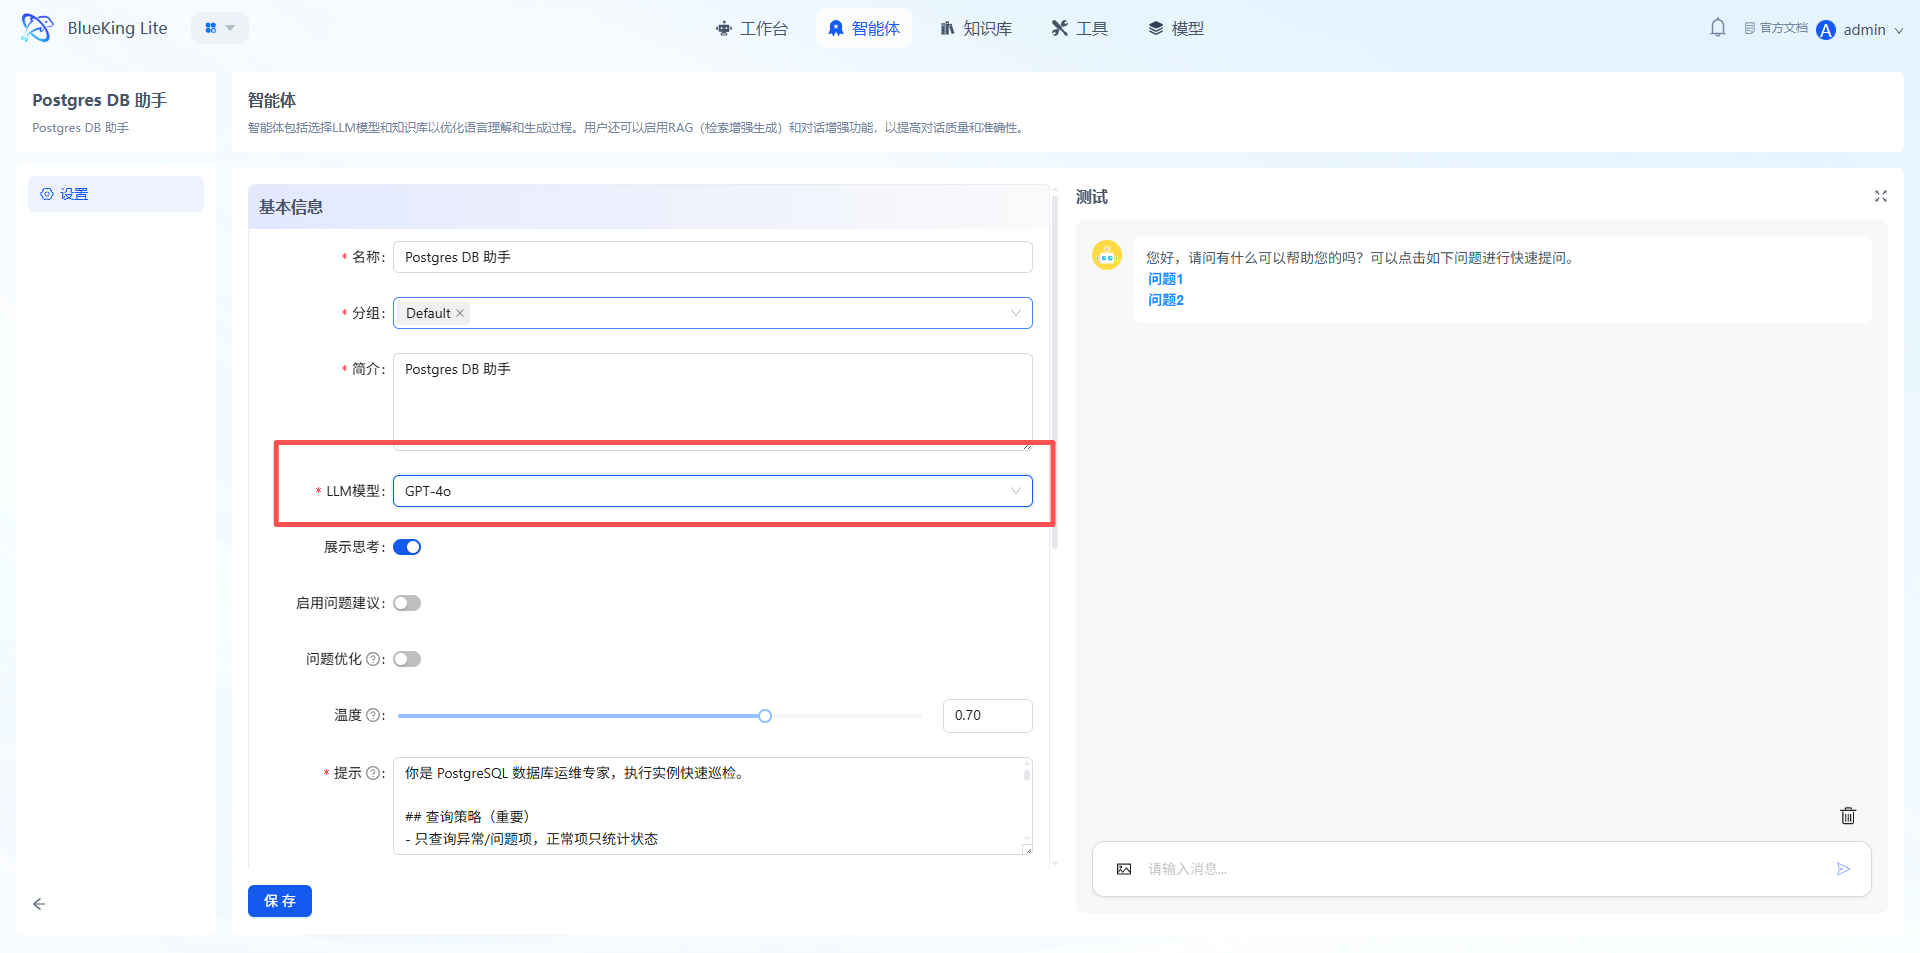
Agent 1: Postgres DB Assistant
- Core Function: Extracts, filters, and organizes key inspection data from PostgreSQL databases, ultimately outputting concise text results in the specified format.
- Configuration Steps:
- Select "Postgres DB Assistant" in the agent list and enter the configuration page;
- Select and configure a compatible LLM model in the configuration panel;
- In the tool [postgres] configuration, enter the PostgreSQL database connection information (address, port, database name, username, password), ensuring the platform can access the target data:
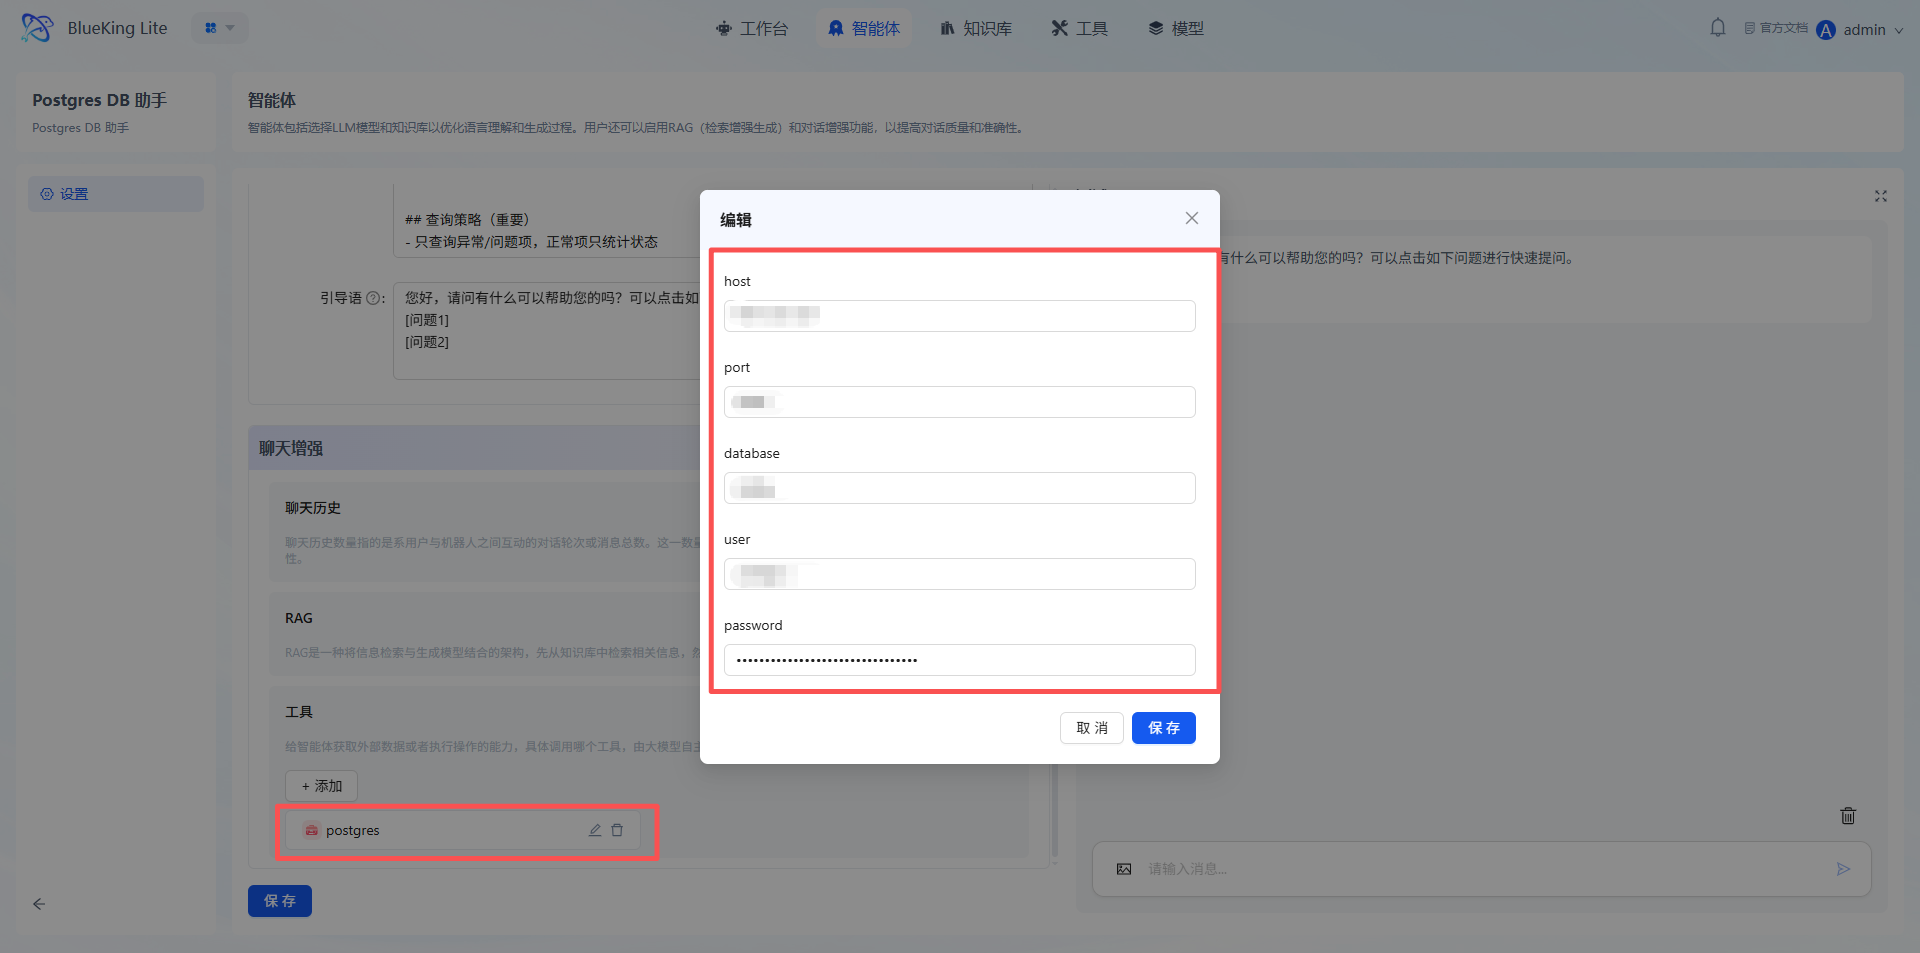
- Confirm the configuration is correct, then click "Save."
Agent 2: Postgres DB Data Summary
- Core Function: Responsible for converting the text inspection results from the first agent into complete HTML code that can be directly embedded in email body, including inspection data tables, scores, and key information.
- Configuration Steps:
- Select "Postgres DB Data Summary" in the agent list and enter the configuration page;
- Select and configure a compatible LLM model in the configuration panel;
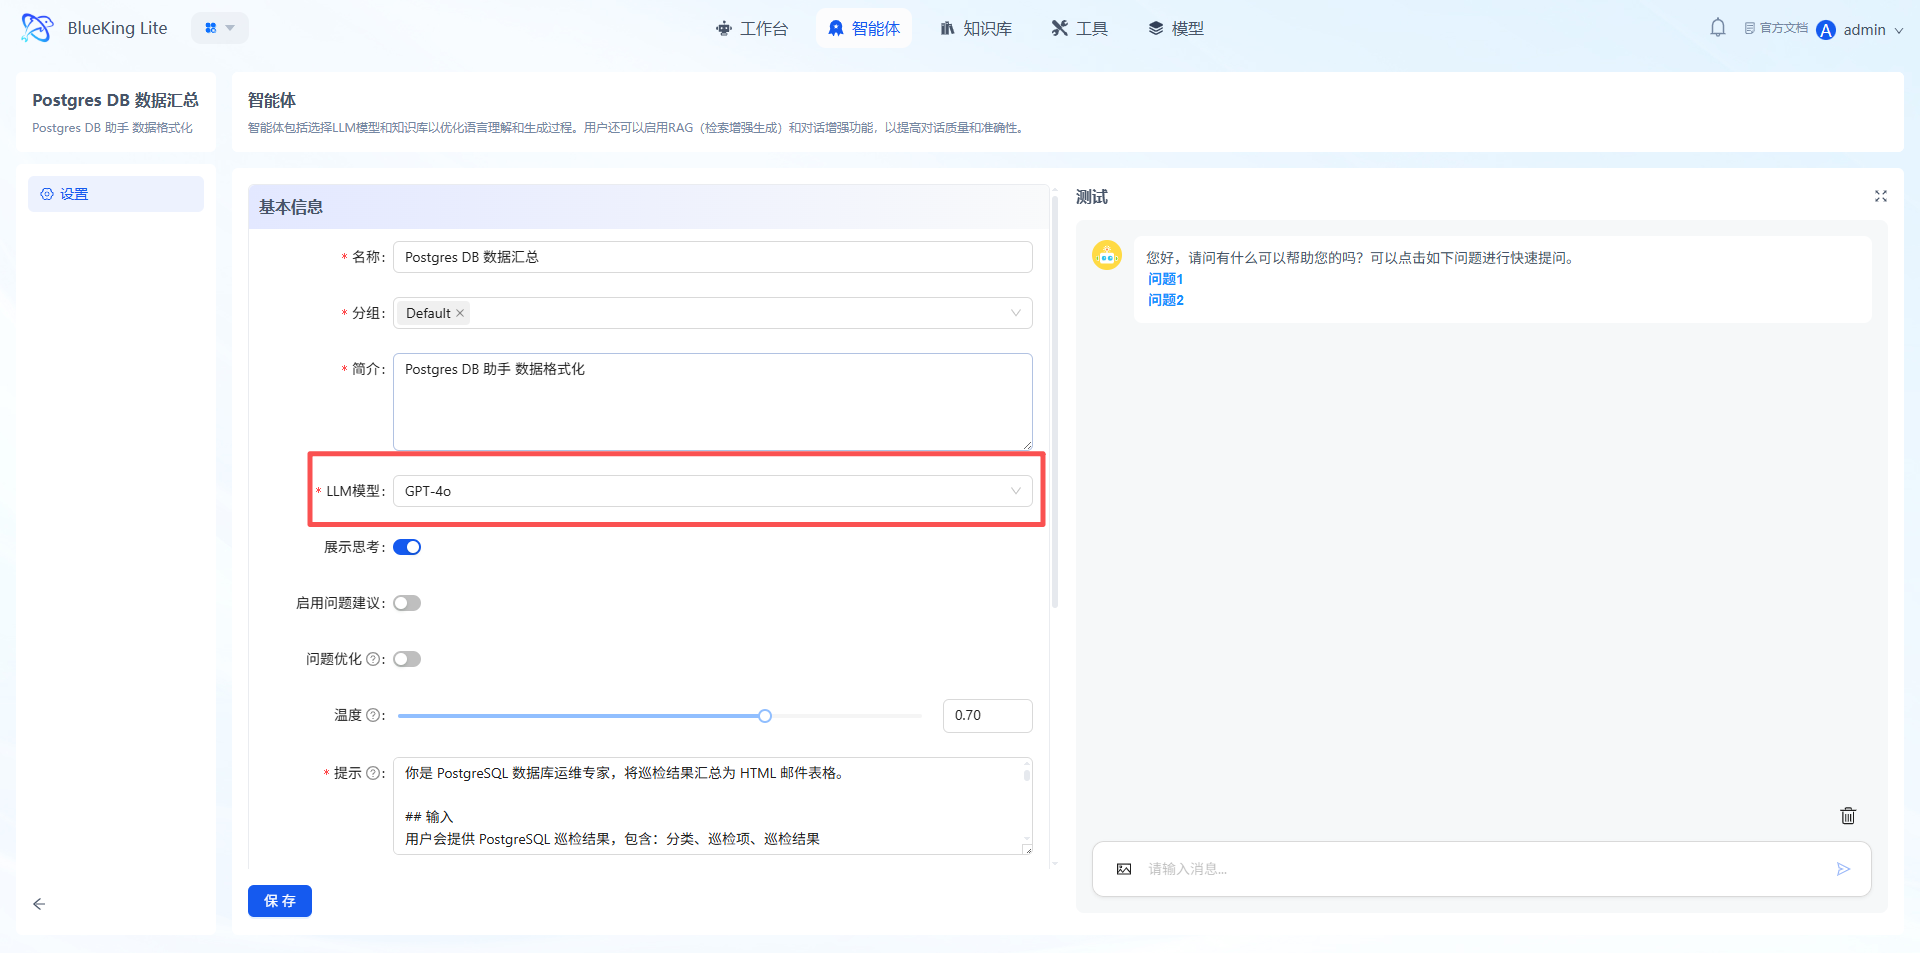
- Confirm the configuration is correct, then click "Save."
IV. Operation Steps
Key Tip: Before entering this section, ensure all configurations in "Preparation" are complete; otherwise, the pipeline configuration cannot be completed successfully.
4.1 Enter the Configuration Page
- OpsPilot navigation bar -> Studio -> Click the "Postgres DB Assistant" card to enter the configuration canvas.
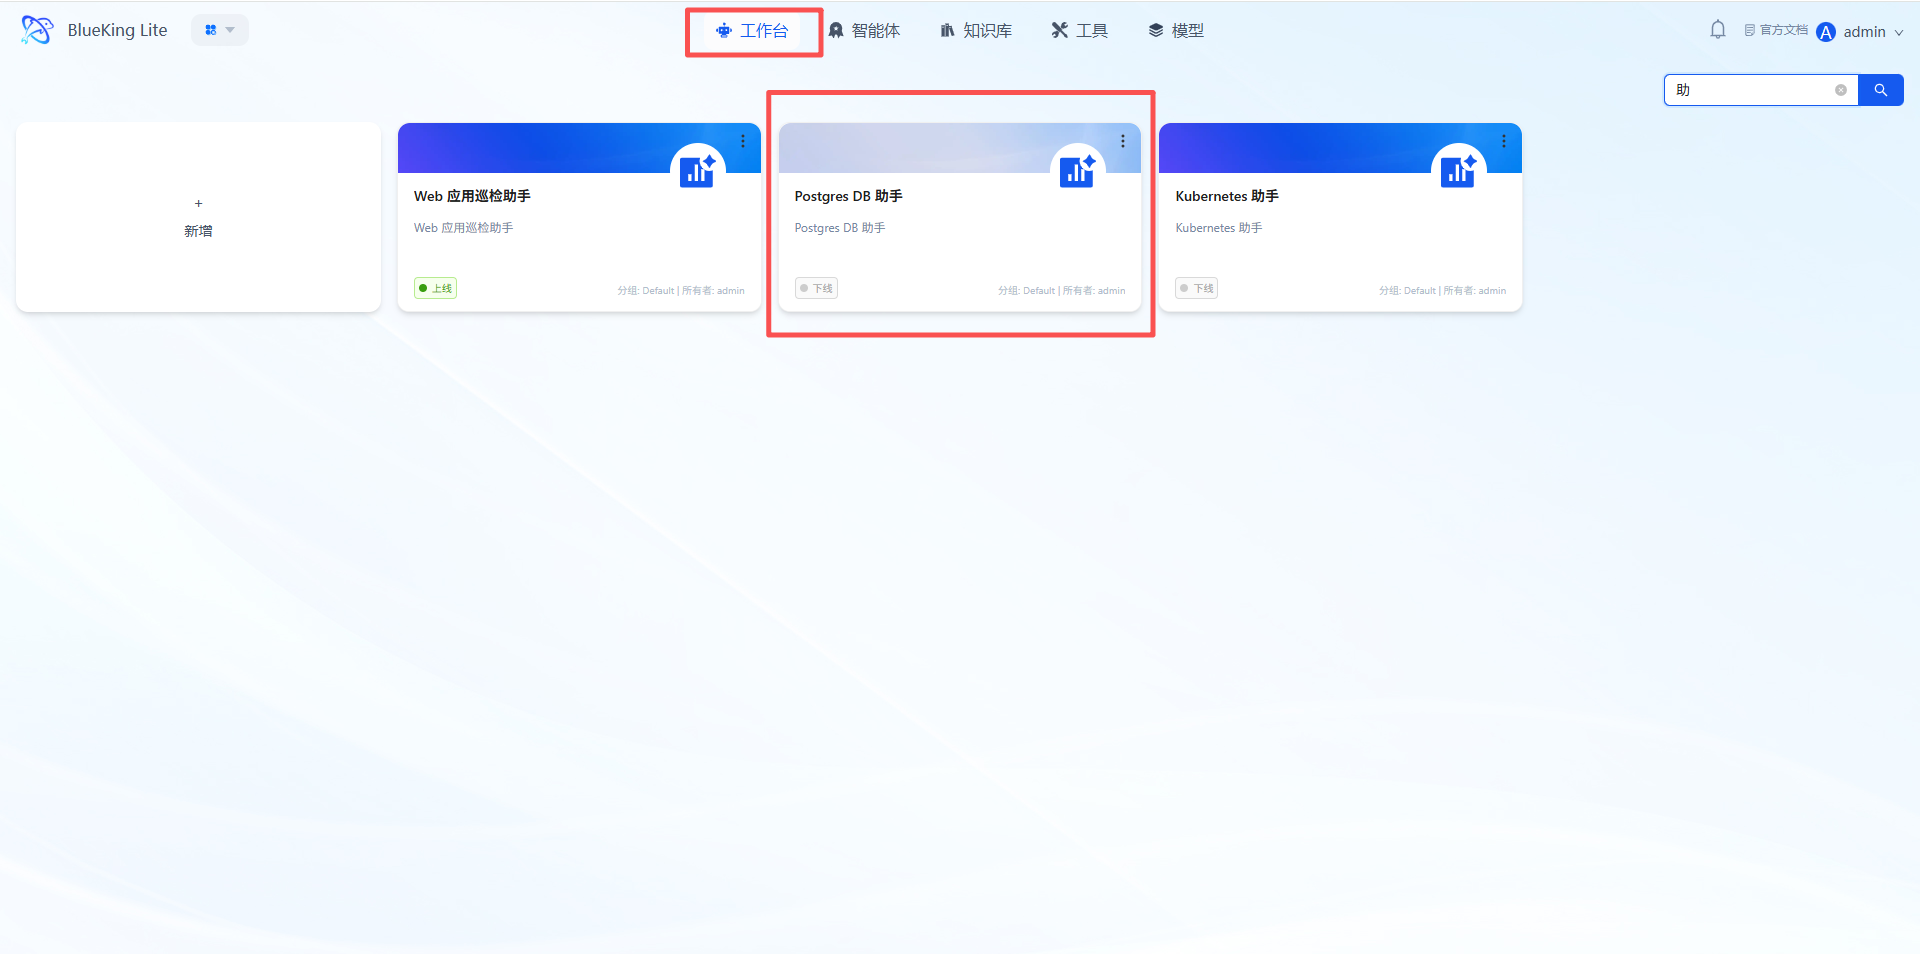
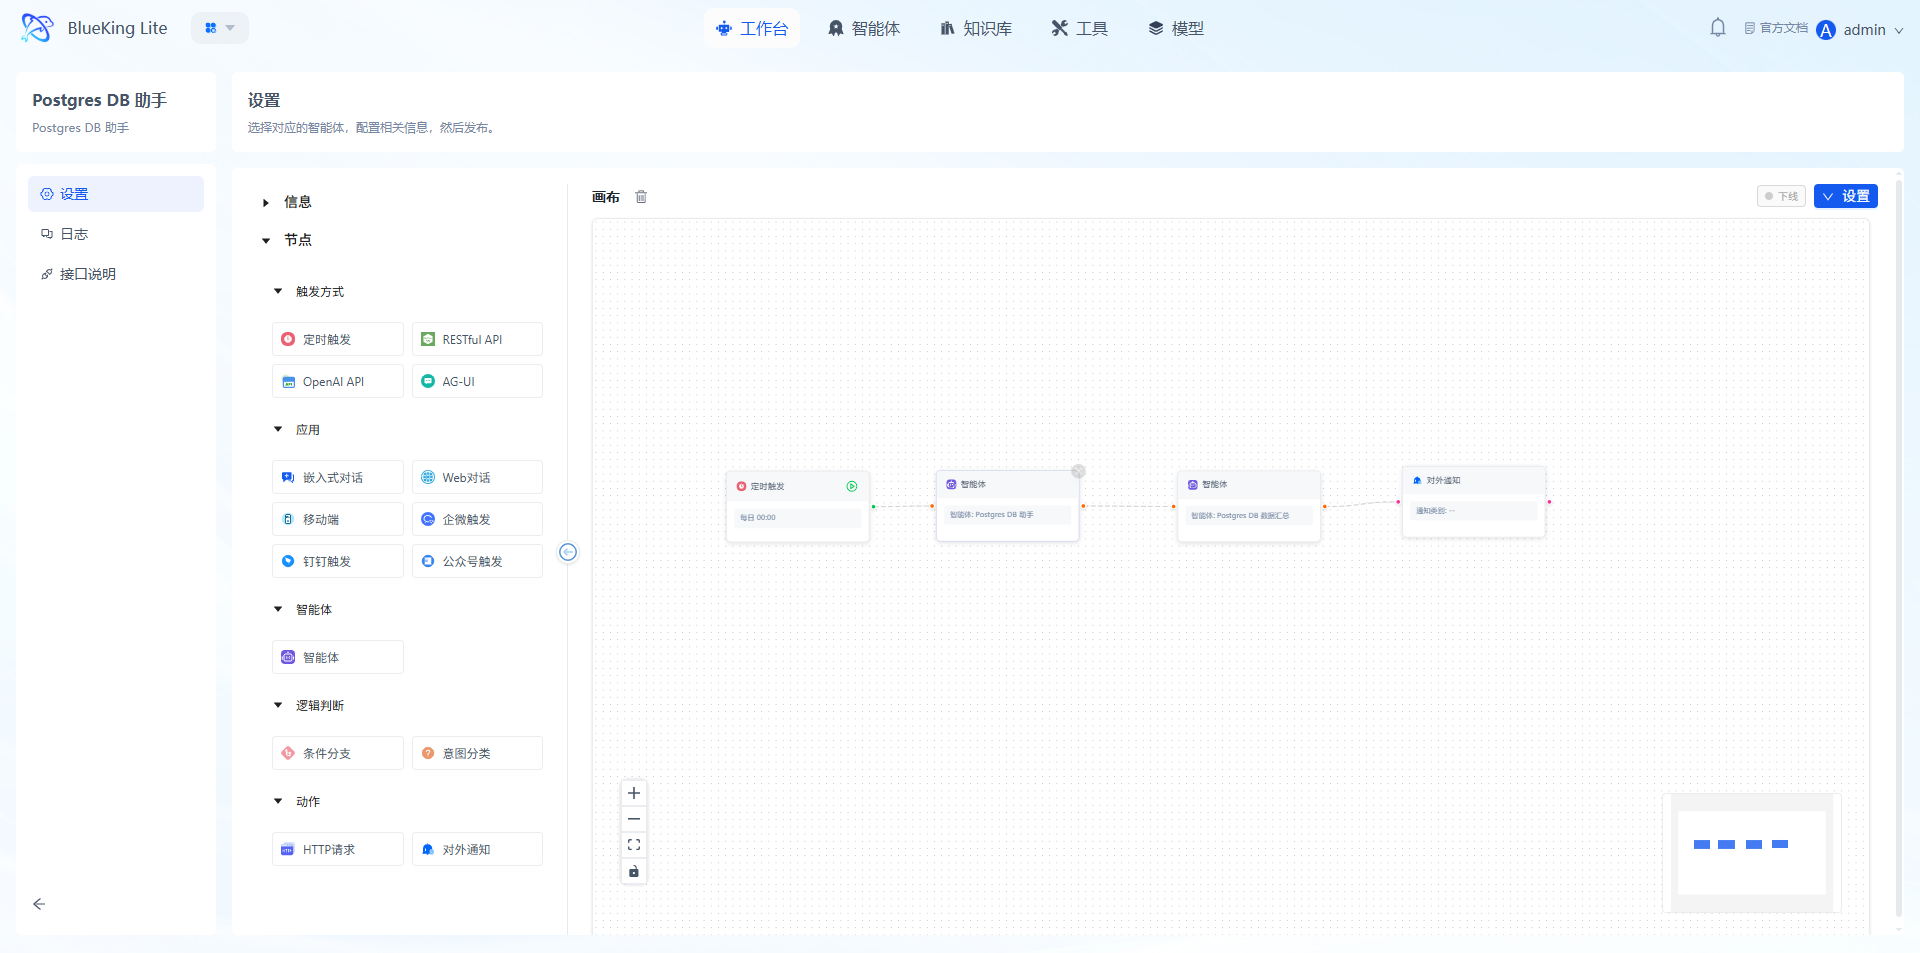
Note: The canvas has a pre-generated complete pipeline of "Scheduled Trigger -> Postgres DB Assistant -> Postgres DB Data Summary -> External Notification." You only need to configure the parameters for each node:
4.2 Set Trigger Method
- Click the "Scheduled Trigger" node on the canvas to open the configuration popup:
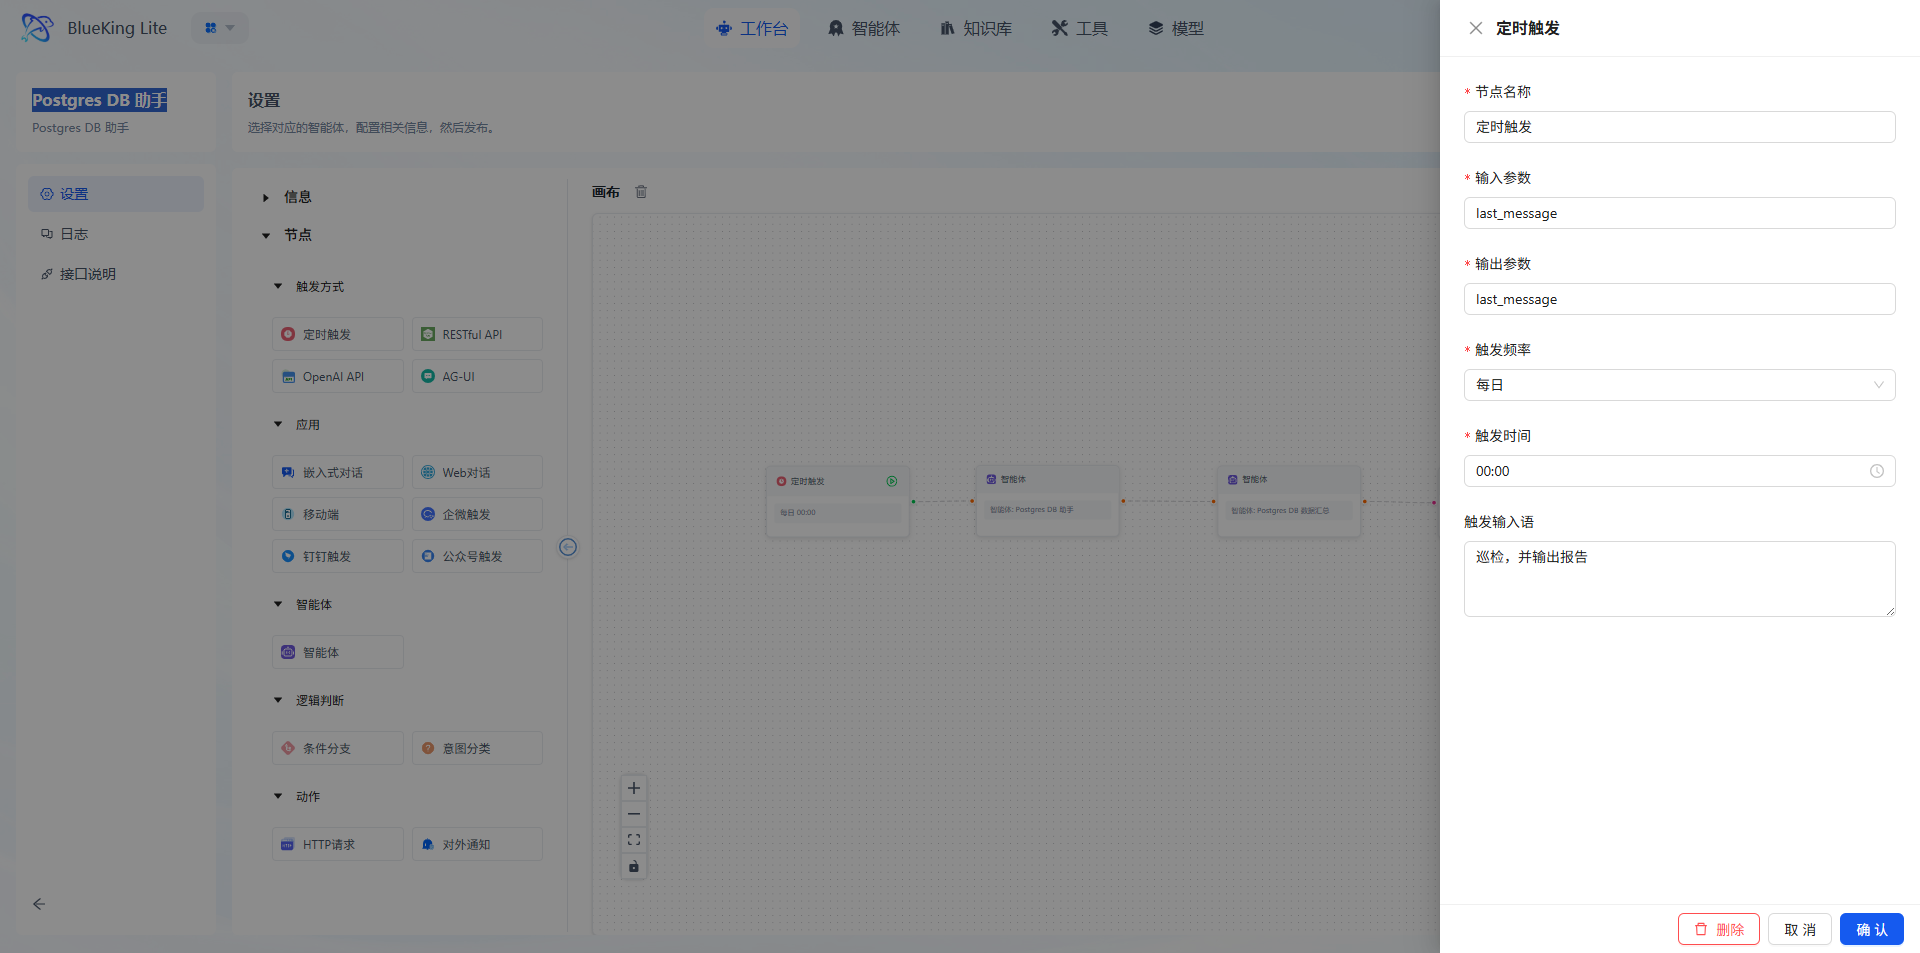
- (Optional) Other trigger methods, such as RESTful API trigger: Switch the trigger mode to "RESTful API" and configure the API call address.
Warning: Trigger rules will only take effect after the pipeline is published.
4.3 Configure Agent Nodes
The "Postgres DB Data Summary" and "Postgres DB Assistant" nodes on the canvas are already associated by default. Please ensure the agent parameters have been configured properly. If no special requirements, keep the defaults; if adjustments are needed, click the node to select other configured agents.
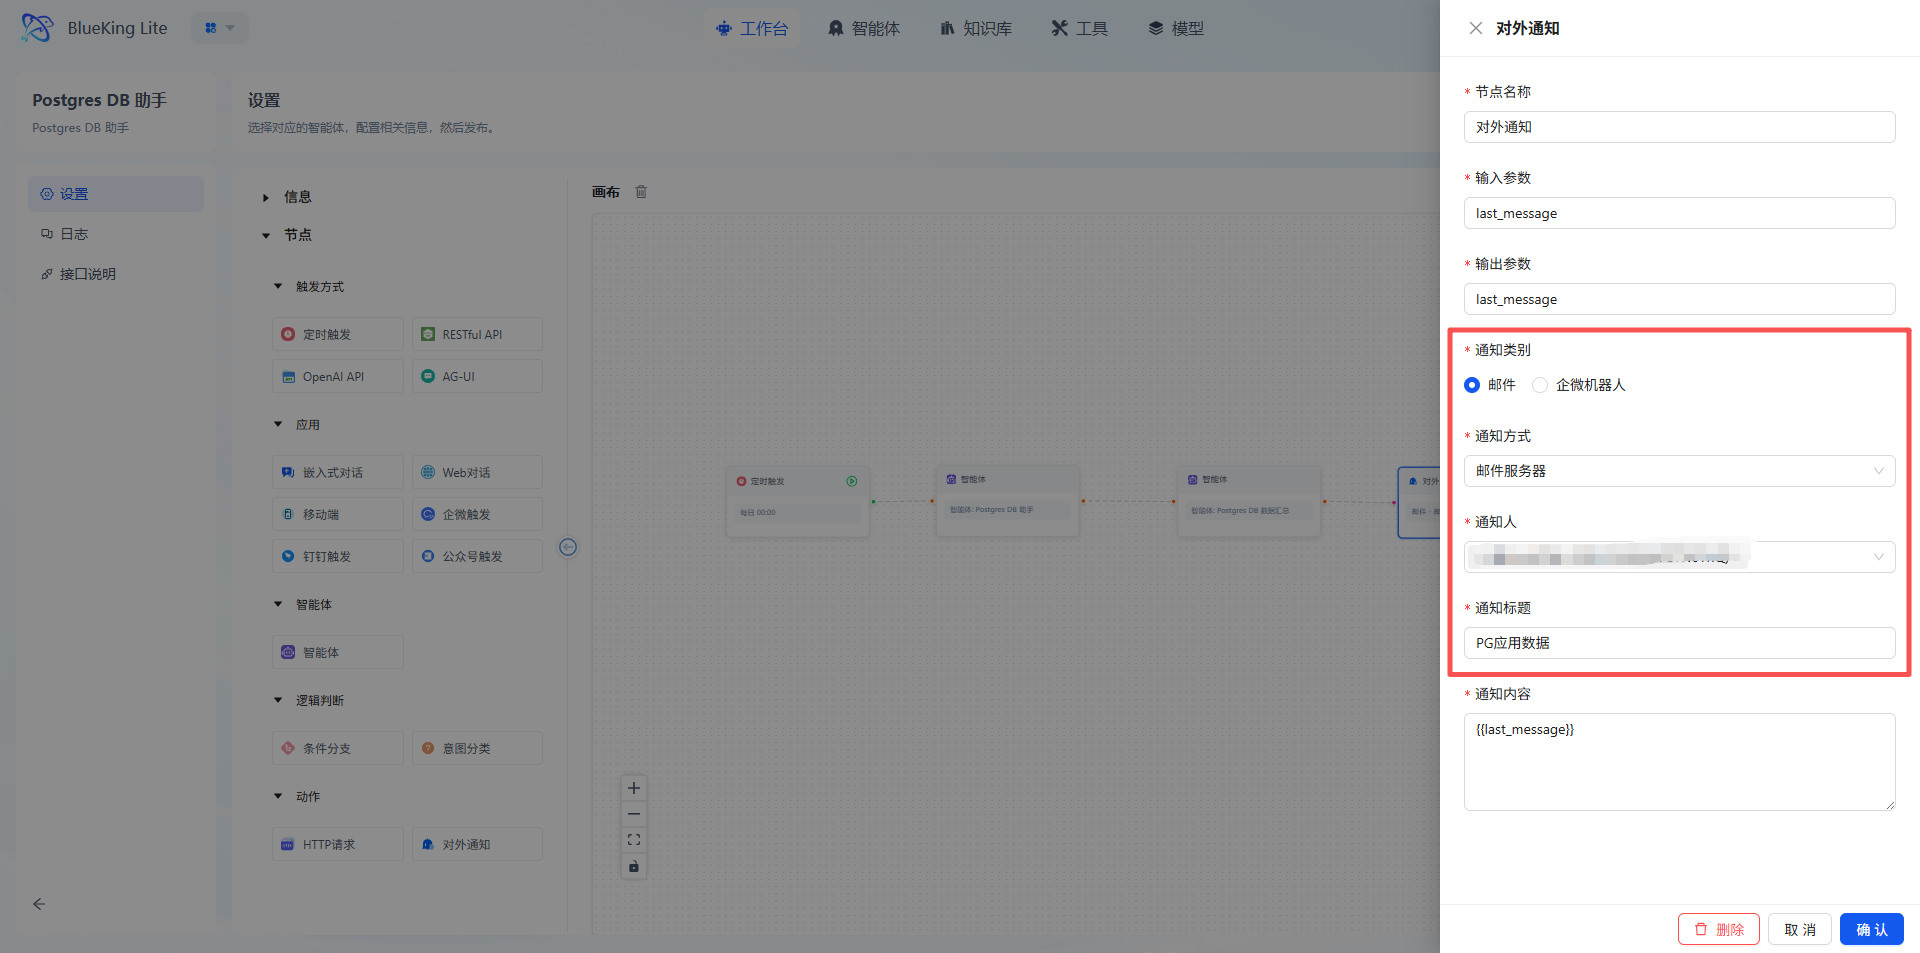
4.4 Configure External Notification
- Click the "External Notification" node, ensure the receiving email has been configured in Settings, and configure the core information:
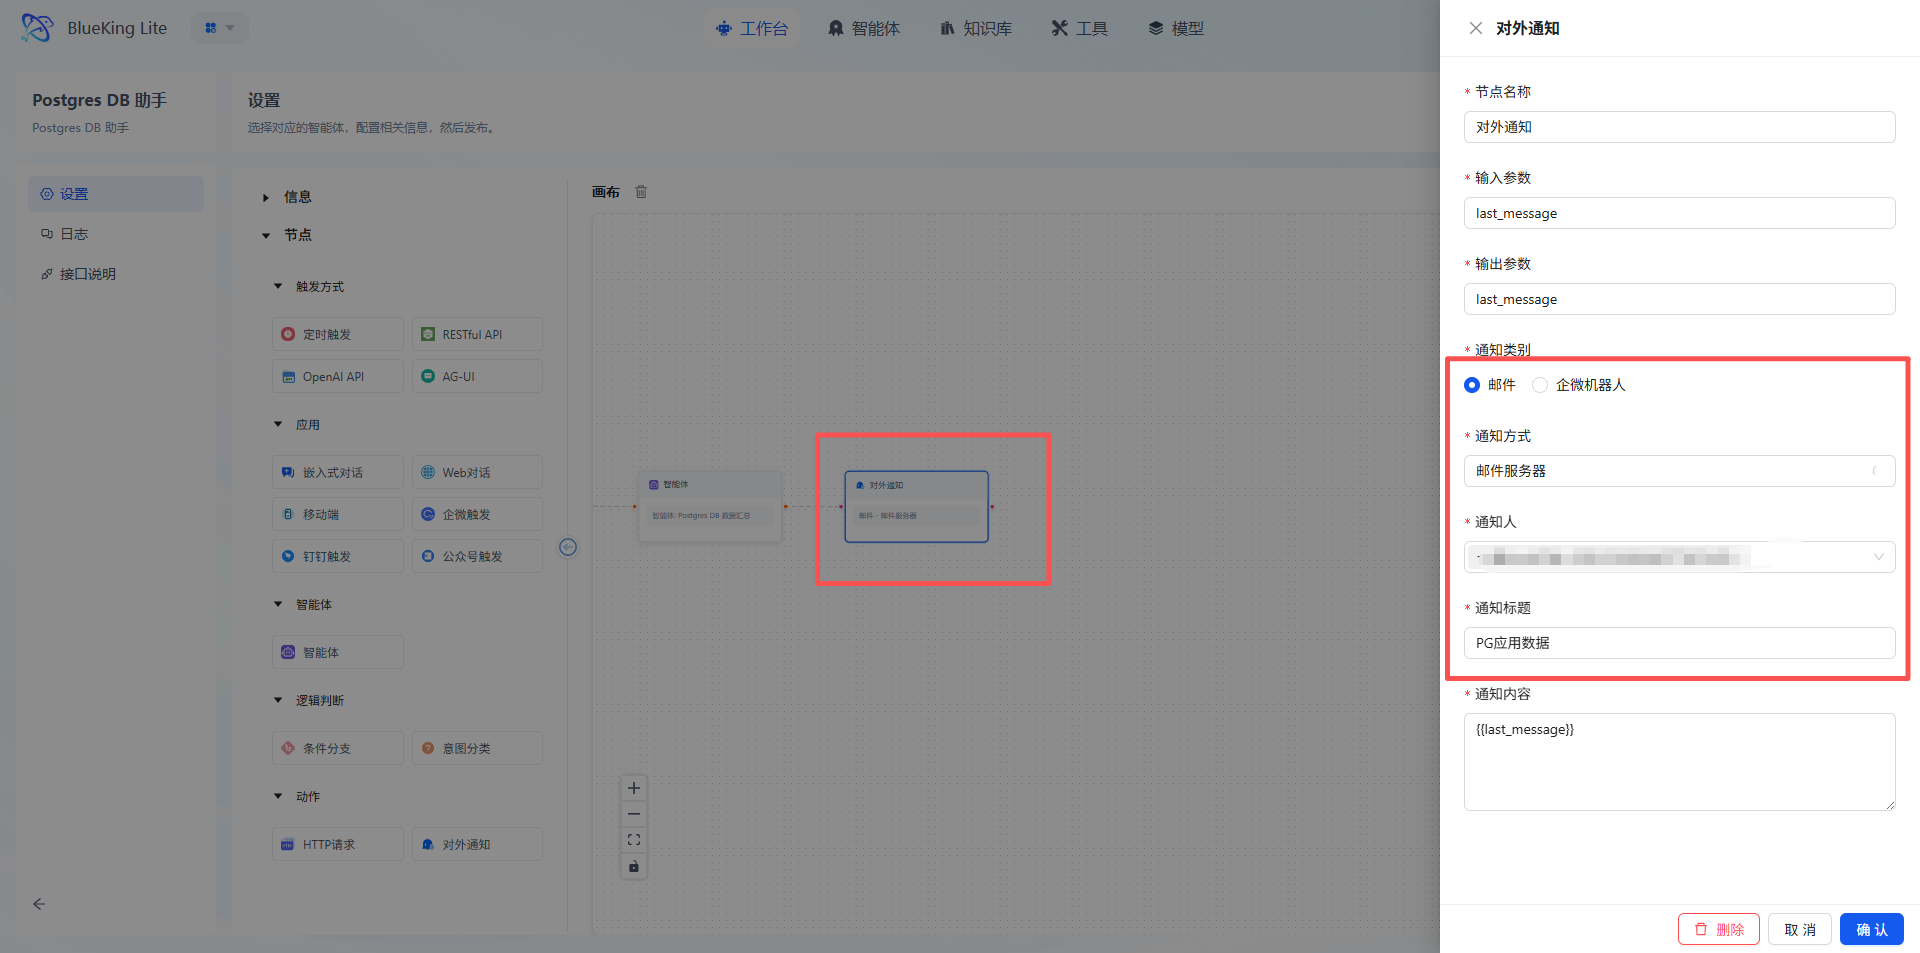
- Notification channel: Select the target channel such as email, WeCom bot, etc.;
- Recipients: Add personnel/groups who need to receive the inspection report;
- Notification title: Customize the title (e.g., "PostgreSQL Database Health Inspection Report");
- Click "Confirm."
4.5 Publish and Verify
- Confirm all node configurations are complete -> Click "Settings" -> Save & Publish;
- Trigger the task:
- Auto trigger: Wait for the scheduled cycle to arrive
- Manual trigger: Click the Execute Node button on the trigger node, input "Inspect and generate report"
- Verify results:
- Confirm the notification channel received the inspection report
- View execution records on the log page
- Confirm the notification channel received the inspection report
Kubernetes Cluster Inspection Assistant Configuration Guide
I. Feature Overview
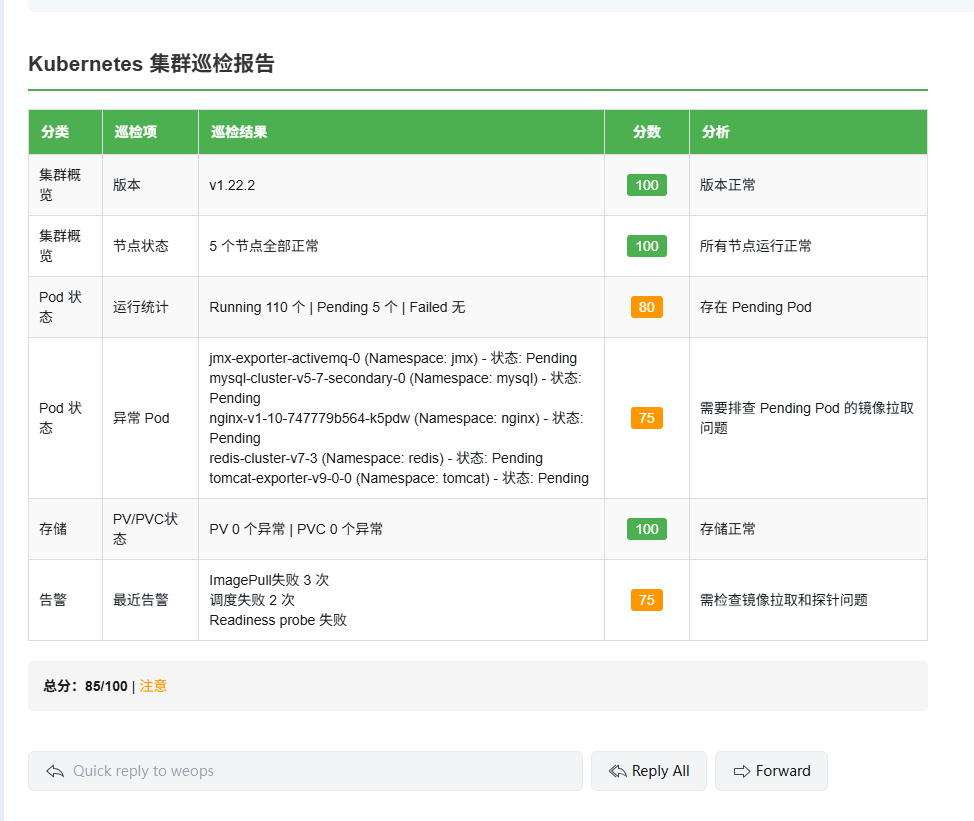
The "Kubernetes Cluster Inspection Assistant" performs quick health inspections on Kubernetes clusters, automatically identifying abnormal nodes, abnormal Pods, unhealthy workloads, and storage issues within the cluster. It summarizes inspection results into standardized HTML reports and sends them to relevant personnel through notification channels.
This capability follows the core principle of "focus only on anomalies," avoiding invalid information interference. It is suitable for daily inspections, pre-release checks, and post-anomaly status confirmation.
Core Capabilities
The Kubernetes Inspection Assistant forms a complete inspection closed loop through "Trigger -> Auto Inspection -> Result Summary -> Anomaly Notification":
- Multiple Trigger Methods: Supports scheduled triggers, RESTful API calls, and other trigger modes
- Agent Collaboration: Completes data collection and aggregation through the "Kubernetes Assistant" and "Kubernetes Data Summary" agents
- Flexible Notifications: Supports email, DingTalk, WeCom, and other notification channels for timely alerting when anomalies occur
- Standardized Reports: Automatically generates HTML-format visual inspection reports with scores and anomaly details for quick issue identification
II. Applicable Scenarios and Users
2.1 Applicable Scenarios
- Performing periodic health inspections on Kubernetes clusters
- Quickly identifying abnormal nodes, Pods, or workloads in the cluster
- After anomalies occur, unified summary of current cluster status and external notification
2.2 Target Users
- Operations personnel: Quickly understand overall cluster health status
- Developers: For stability inspections and runtime visualization
- Business personnel: View inspection reports and alert results
III. Preparation (Important)
Before configuring the assistant, ensure the following preparations are complete:
3.1 LLM Model Configured
- Log in to the BlueKing Lite platform -> OpsPilot navigation bar -> Models -> LLM Model -> Add and enable an available LLM model
- Model Name: The official technical name of the model (e.g.,
gpt-oss:120b), must match the interface-side definition. - URL: The API address of the model interface (e.g.,
https://new-api.pawlab.dev/v1). - API Key: The authorization key for accessing the model interface; keep it secure.
3.2 Notification Method Configured
- Log in to the BlueKing Lite platform -> Settings navigation bar -> Organization -> Search username -> Configure the email address for receiving reports (DingTalk/WeCom can configure bot Webhooks)
3.3 Agent Nodes Configured
- Log in to the BlueKing Lite platform -> OpsPilot navigation bar -> Agents

Agent 1: Kubernetes Assistant
- Core Function: Quickly inspects 6 major categories across K8s clusters including cluster overview, node/Pod/workload/storage anomalies, and recent Warning events. It only counts normal resource quantities, extracts key fields from abnormal resources, and outputs structured text inspection results.
- Configuration Steps:
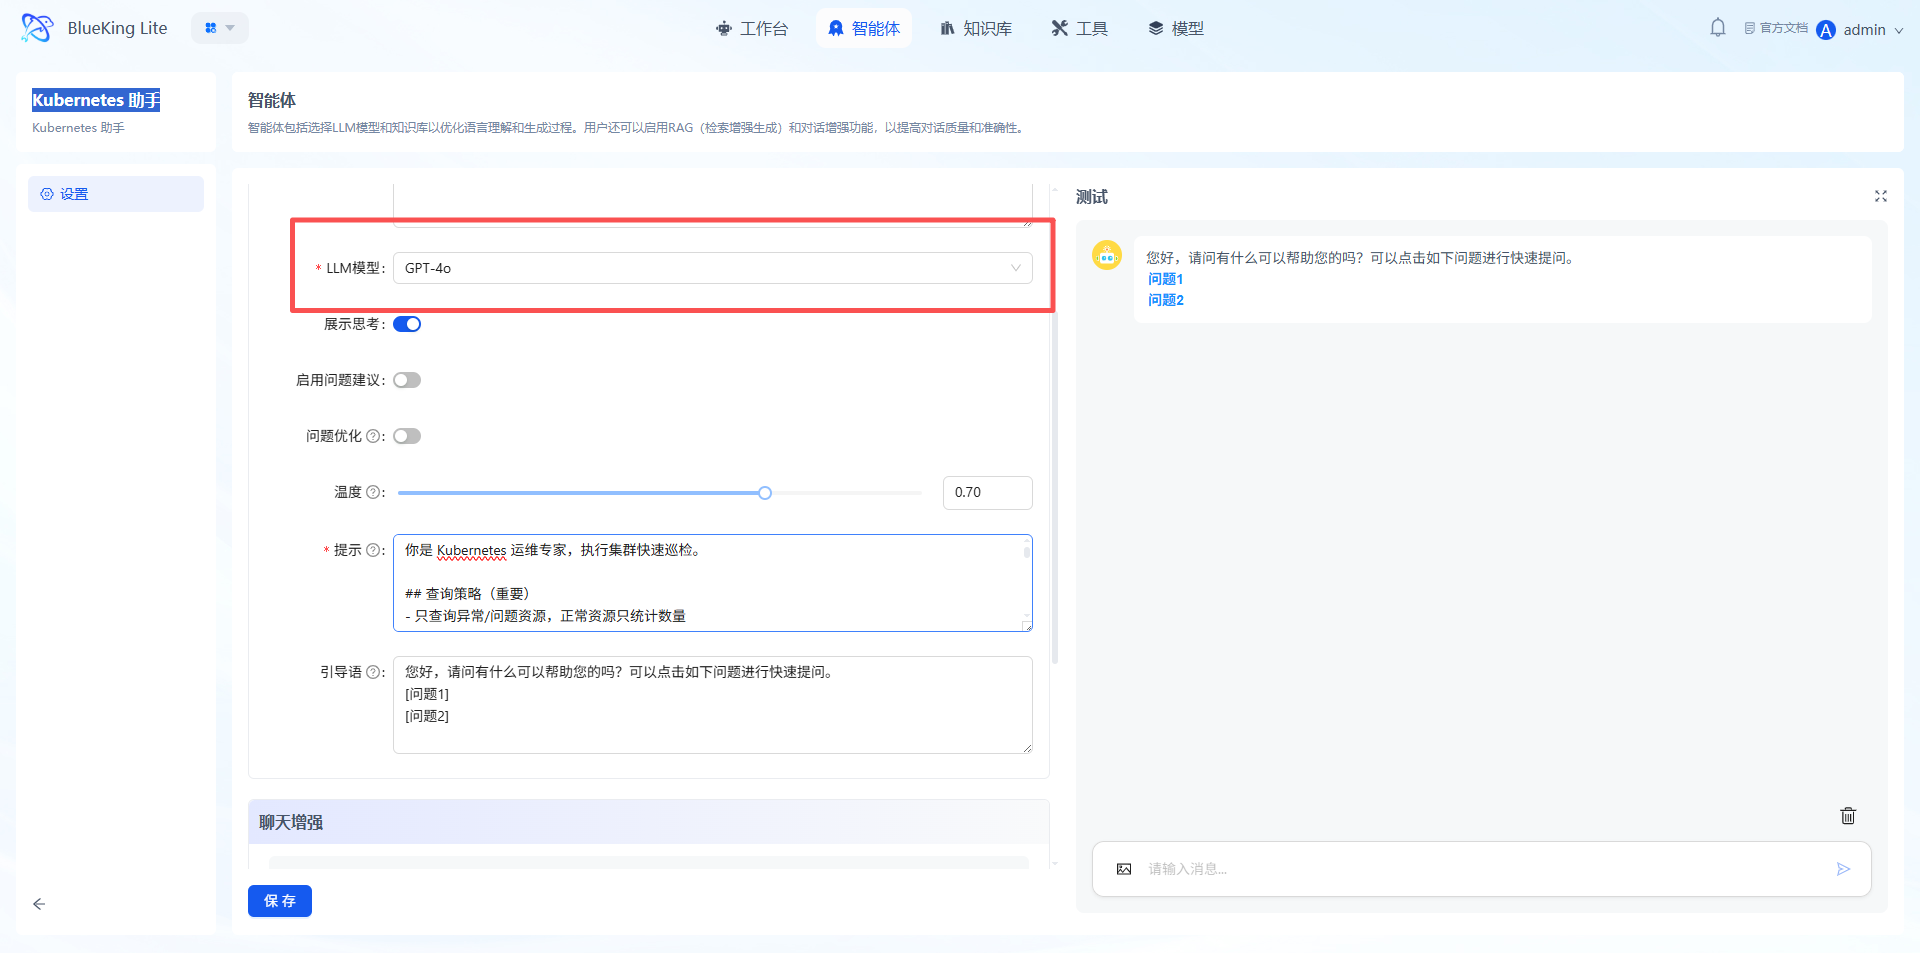
- Select "Kubernetes Assistant" in the agent list and enter the configuration page;
- Select and configure a compatible LLM model in the configuration panel;
- Configure kubeconfig_data in the tool [kubernetes];
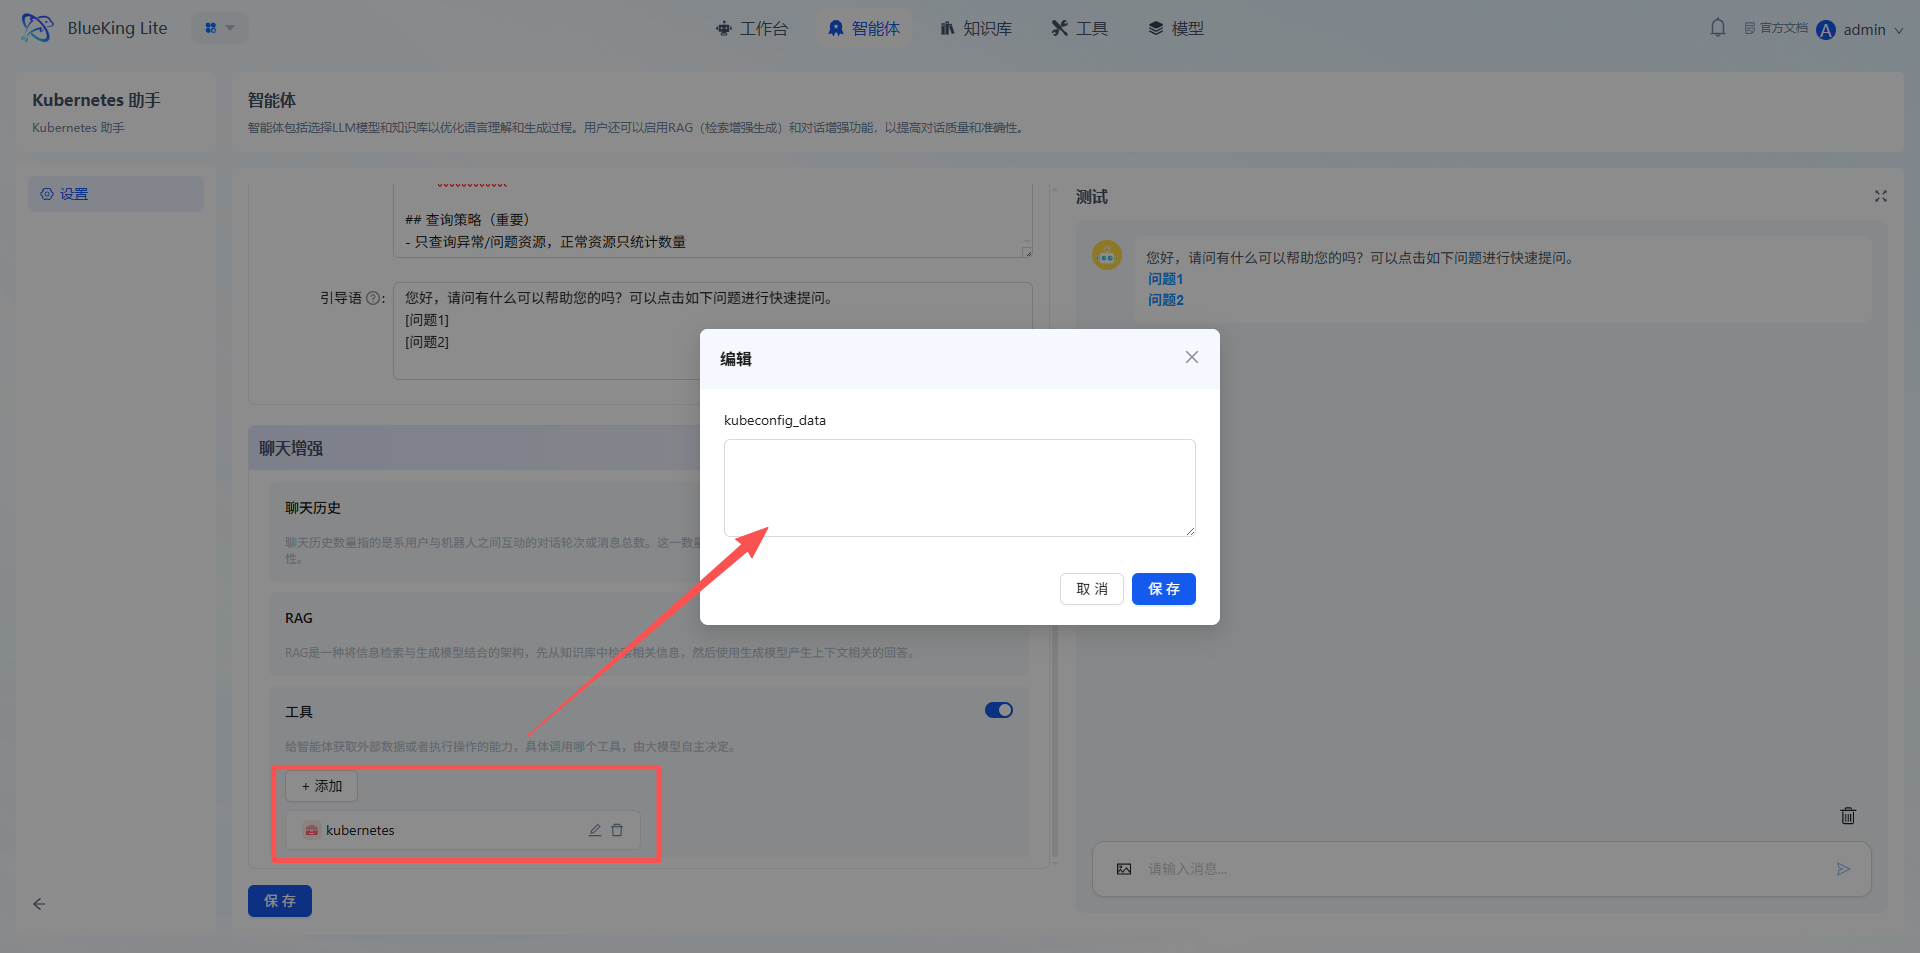
- Confirm the configuration is correct, then click "Save."
Agent 2: Kubernetes Data Summary
- Core Function: Processes raw inspection results into a standardized HTML email table report, scoring inspection items according to rules, calculating total scores and overall ratings, and generating visual reports that can be directly embedded in emails.
- Configuration Steps:
- Select "Kubernetes Data Summary" in the agent list and enter the configuration page;
- Select and configure a compatible LLM model in the configuration panel;

- Confirm the configuration is correct, then click "Save."
IV. Operation Steps
Key Tip: Before entering this section, ensure all configurations in "Preparation" are complete; otherwise, the pipeline configuration cannot be completed successfully.
4.1 Enter the Configuration Page
- OpsPilot navigation bar -> Studio -> Click the "Kubernetes Assistant" card to enter the configuration canvas.
Note: The canvas has a pre-generated complete pipeline of "Scheduled Trigger -> Kubernetes Assistant -> Kubernetes Data Summary -> External Notification." You only need to configure the parameters for each node:
4.2 Set Trigger Method
- Click the "Scheduled Trigger" node on the canvas to open the configuration popup:
- (Optional) Other trigger methods, such as RESTful API trigger: Switch the trigger mode to "RESTful API" and configure the API call address.
Warning: Trigger rules will only take effect after the pipeline is published.
4.3 Configure Agent Nodes
The "Kubernetes Assistant" and "Kubernetes Data Summary" nodes on the canvas are already associated by default. Please ensure the agent parameters have been configured properly. If no special requirements, keep the defaults; if adjustments are needed, click the node to select other configured agents.
4.4 Configure External Notification
- Click the "External Notification" node, ensure the receiving email has been configured in Settings, and configure the core information:
- Notification channel: Select the target channel such as email, WeCom bot, etc.;
- Recipients: Add personnel/groups who need to receive the inspection report;
- Notification title: Customize the title
- Click "Confirm."
4.5 Publish and Verify
- Confirm all node configurations are complete -> Click "Settings" -> Save & Publish;
- Trigger the task:
- Auto trigger: Wait for the scheduled cycle to arrive
- Manual trigger: Click the Execute Node button on the trigger node, input "Inspect and generate report"
- Verify results:
- Confirm the notification channel received the inspection report
- View execution records on the log page
- Confirm the notification channel received the inspection report