Quick Start
1. Prerequisites
Before using the Alert Center, confirm that the following preparations are complete:
- You have an account with access to the BlueKing Lite platform and have view and configuration permissions for the Alert Center module.
- You have created an available alert source (Path: Alert Center -> Integration -> Alert Sources) and obtained the corresponding access key (
SECRET). - You have identified the event fields to be integrated. To ensure accurate aggregation, dispatch, and recovery evaluation, each event should include at least:
title: Event title (required — events missing this field will be discarded)action: Event action (created/recovery/closed, strongly recommended)level: Event severity level (recommended)start_time: Event start time (recommended)resource_id/resource_name: Resource identifier (recommended)resource_type: Resource type (recommended)
- You have identified the scenario you want to verify, such as infrastructure anomaly aggregation, pipeline failure tracking, or scheduled task missing detection.
Note: The effectiveness of the Alert Center heavily depends on event field quality. If resource identifiers are missing, aggregation dimensions will be limited, potentially generating a large number of duplicate alerts.
2. Step 1: Configure Alert Sources and Field Mapping
Path: Alert Center -> Integration -> Alert Sources -> New
2.1 Create an Alert Source
- Enter the alert source name and description.
- Select the integration type (RESTful, Prometheus, Zabbix, etc.).
- Configure field mapping (
event_fields_mapping): Map upstream system fields to standard event fields.
Default field mapping example:
{
  "title": "title",
  "description": "description",
  "level": "level",
  "start_time": "start_time",
  "end_time": "end_time",
  "external_id": "external_id",
  "item": "item",
  "resource_id": "resource_id",
  "resource_name": "resource_name",
  "resource_type": "resource_type",
  "service": "service",
  "location": "location"
}
2.2 Obtain the Access Key
After creation, go to the alert source detail page and copy the generated SECRET key, which will be used for event push authentication.
Interface Guide:
- Chart Interpretation / Configuration Logic: The alert source detail page displays the integration guide, authentication parameters, and recent events. If you do not see expected alerts after integration, first verify here whether events have been successfully received.
3. Step 2: Define Correlation Rules
Path: Alert Center -> Settings -> Correlation Rules -> New
In the current version, correlation rules serve as a unified alert policy configuration entry. Policy types are divided into Intelligent Noise Reduction and Missing Detection. They determine how events are filtered and aggregated after entering the platform, and under what conditions alerts are generated.
3.1 Choose the Policy Type First
| Policy Type | Applicable Scenarios | Key Configuration |
|---|---|---|
| Intelligent Noise Reduction | Standard monitoring event convergence, duplicate event merging, jitter scenario noise reduction | Event scope, aggregation dimensions, detection window, self-healing observation time, auto-close |
| Missing Detection | Scheduled tasks, heartbeat reporting, periodic events not arriving on time | Monitoring target, Cron check period, grace period, activation method, auto-recovery, alert template |
Selection guidelines:
- Events are continuously being pushed, but you want to converge duplicate anomalies into a single alert: Choose Intelligent Noise Reduction.
- You expect to receive certain events on schedule, but want to be alerted when "expected events don't arrive": Choose Missing Detection.
Regardless of which policy type you choose, matching rules define "which events enter the current policy." The structure is "outer OR, inner AND":
- Multiple conditions within the same group must all be met for the group to match.
- If any group matches, the event enters the current policy.
For example, you could configure:
- Group 1:
source_id = prometheusANDresource_type = host - Group 2:
service = core-api
The resulting matching logic would be: (A AND B) OR C.
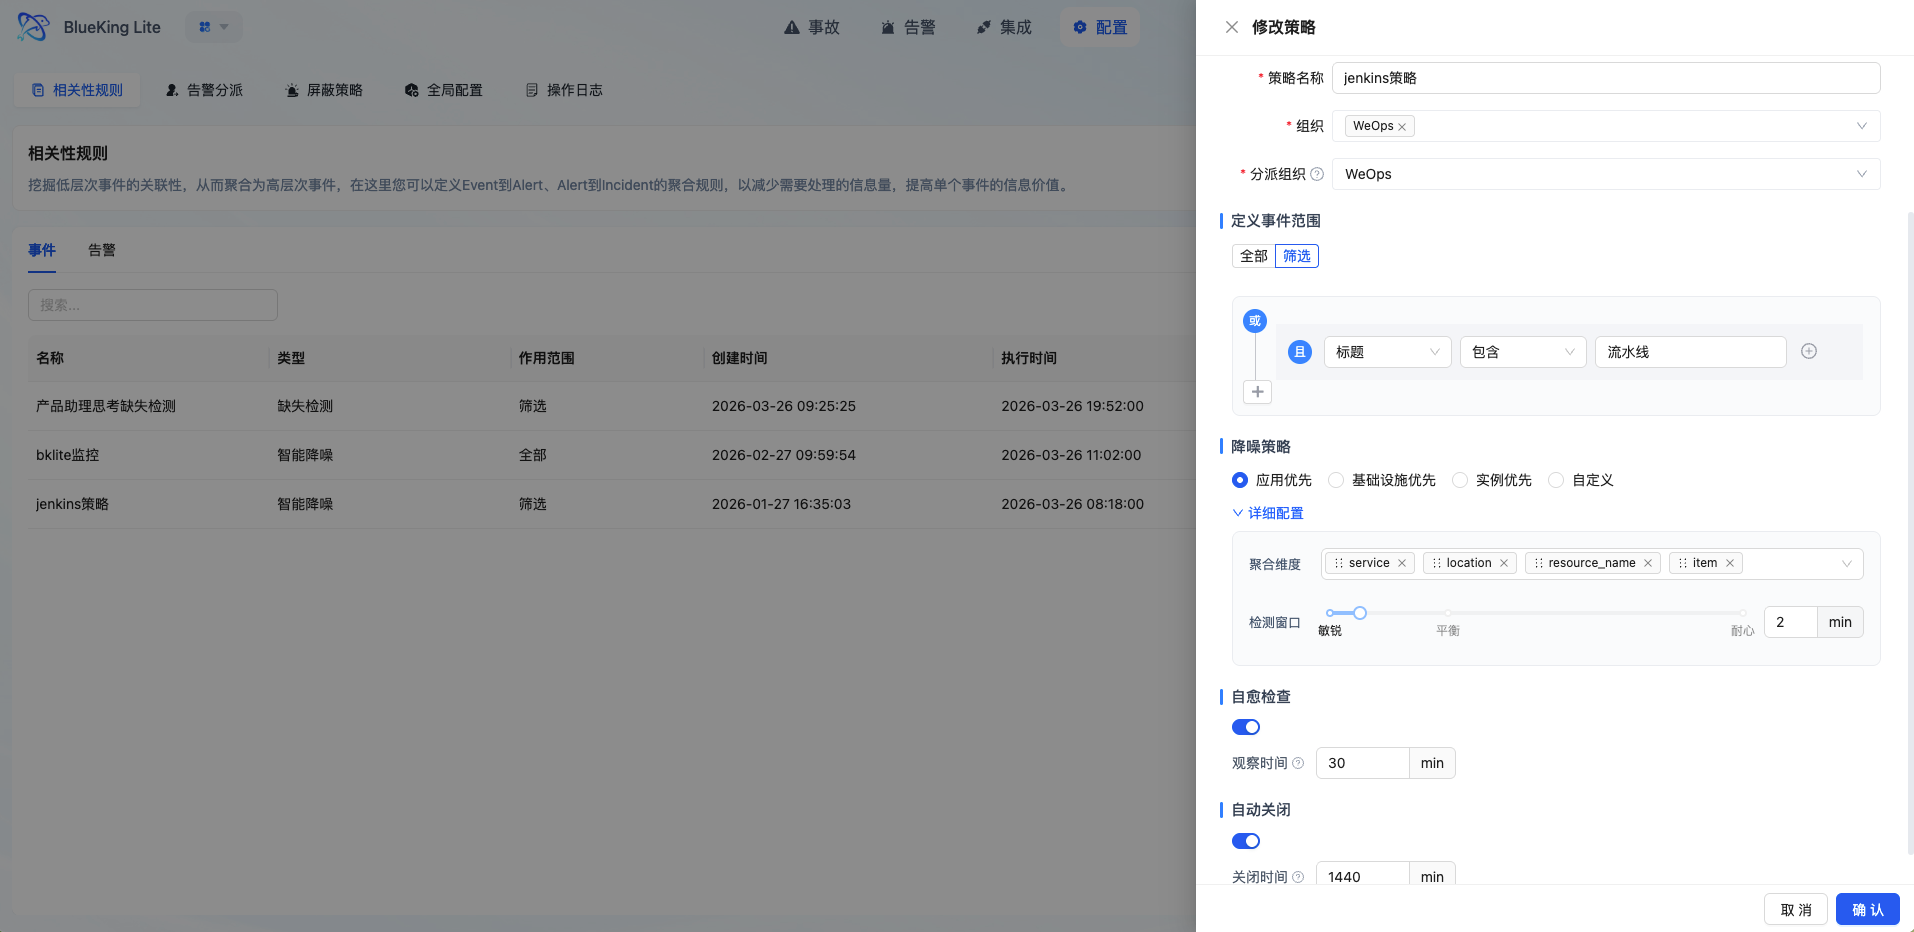
3.2 How to Configure Intelligent Noise Reduction
Intelligent Noise Reduction is used to aggregate duplicate, similar, or rapidly occurring events into fewer, more actionable alerts. The current version no longer configures "sliding window / fixed window / session window" separately, but instead achieves noise reduction through the following parameter combinations:
- Define the Event Scope
- You can choose to apply to all events, or use matching rules to only process events from specific sources, severity levels, resource types, services, etc.
- Select the Aggregation Strategy
- The page offers "Application Priority / Infrastructure Priority / Instance Priority / Custom" options, which essentially preset different aggregation dimension orders.
- Set Aggregation Dimensions
- Currently, aggregation primarily revolves around combinations of
service,location,resource_name, anditemfields. - If you want "similar anomalies under the same service to be merged as much as possible," prioritize keeping
service. - If you want "different instances to generate separate alerts," prioritize keeping
resource_name.
- Currently, aggregation primarily revolves around combinations of
- Set the Detection Window
- The system collects events within the configured time window, then merges them by aggregation dimensions to generate alerts.
- A shorter window generates alerts more promptly; a longer window provides stronger aggregation.
- Enable Self-Healing Observation Time as Needed
- When enabled, the system places alerts in an observation phase first; if the anomaly recovers within the observation period, it reduces formal alerts caused by short-term jitter.
- Enable Auto-Close as Needed
- For alerts that do not need to be retained long-term, you can set an auto-close timeout (in minutes) to prevent the alert pool from accumulating indefinitely.
For most first-time integration scenarios, it is recommended to start with the following approach:
- Event scope: Filter by alert source or service first to avoid including all events at the beginning.
- Aggregation dimensions: Start with
service + resource_name. - Detection window: Start with a small window of about 5 minutes to observe the effect.
- Observation time: Enable only when jitter alerts are clearly present.
3.3 How to Configure Missing Detection
Missing Detection does not check whether "too many events arrived," but rather whether "expected events arrived on time." The current implementation has switched to a Cron + Grace Period model; the old fixed-interval configuration has been deprecated.
Follow these steps for configuration:
- Identify the Monitoring Target
- Missing Detection requires matching rules; it does not support "all events" monitoring.
- Typically, you narrow down heartbeat or task events using fields such as
service,source_id,resource_type, andresource_id.
- Set the Check Schedule
- Currently, only Cron expressions are supported.
- For example:
0 2 * * *means check once every day at 2:00 AM.
- Set the Grace Period
- After the expected time arrives, the system waits for an additional grace period; if no event is received after the grace period expires, a missing alert is triggered.
- Set the Activation Method
- First Heartbeat Activation: The system enters monitoring mode only after receiving the first matching event, which helps avoid false positives immediately after policy creation.
- Immediate Activation: Monitoring begins as soon as the policy is saved, suitable for scenarios where tasks are confirmed to be running stably.
- Set Recovery Method and Alert Template
- Auto-recovery can be enabled. After a missing alert is generated, the system will automatically recover it once a subsequent matching event is received.
- The title, severity level, and description in the alert template are required fields that define the final display content of the missing alert.
Note that runtime fields such as heartbeat_status, last_heartbeat_time, and last_heartbeat_context are maintained by the system and do not need to be configured manually.
Interface Guide:
- Chart Interpretation / Configuration Logic: The correlation rules page is essentially the alert policy configuration entry. After saving, the rules take effect automatically through backend periodic aggregation tasks. If the aggregation results do not meet expectations, first review whether the matching rules, aggregation dimensions, detection window, or Cron and grace period settings are appropriate.
4. Step 3: Push Events to the Alert Center
4.1 Create Event Push Example
Push a create event using the REST API:
curl -X POST 'https://<your-domain>/api/proxy/alerts/api/receiver_data/' \
  -H 'Content-Type: application/json' \
  -H 'SECRET: <your-secret-key>' \
  -d '{
    "source_id": "restful",
    "events": [
      {
        "title": "Host 10.10.24.62 memory usage too high",
        "description": "Host 10.10.24.62 memory usage has continuously exceeded the 90% threshold",
        "action": "created",
        "external_id": "host-10.10.24.62-mem-usage",
        "level": "1",
        "start_time": "1742812800",
        "item": "mem_usage",
        "resource_id": "host-10.10.24.62",
        "resource_name": "10.10.24.62",
        "resource_type": "host",
        "service": "core-api",
        "labels": {
          "cluster": "prod-beijing",
          "team": "platform"
        }
      }
    ]
  }'
4.2 Recovery Event Push Example
When the issue is resolved, push a recovery event to trigger automatic recovery:
curl -X POST 'https://<your-domain>/api/proxy/alerts/api/receiver_data/' \
  -H 'Content-Type: application/json' \
  -H 'SECRET: <your-secret-key>' \
  -d '{
    "source_id": "restful",
    "events": [
      {
        "title": "Host 10.10.24.62 memory usage returned to normal",
        "description": "Host 10.10.24.62 memory usage has dropped below the threshold",
        "action": "recovery",
        "external_id": "host-10.10.24.62-mem-usage",
        "level": "1",
        "start_time": "1742816400",
        "item": "mem_usage",
        "resource_id": "host-10.10.24.62",
        "resource_name": "10.10.24.62",
        "resource_type": "host"
      }
    ]
  }'
Key Points:
- The recovery event's
external_idmust match the create event'sexternal_id.- The
actionfield must berecoveryorclosed.- The recovery time (
start_time) must be later than the create event time to trigger automatic recovery.
5. Step 4: Verify Events and Alerts
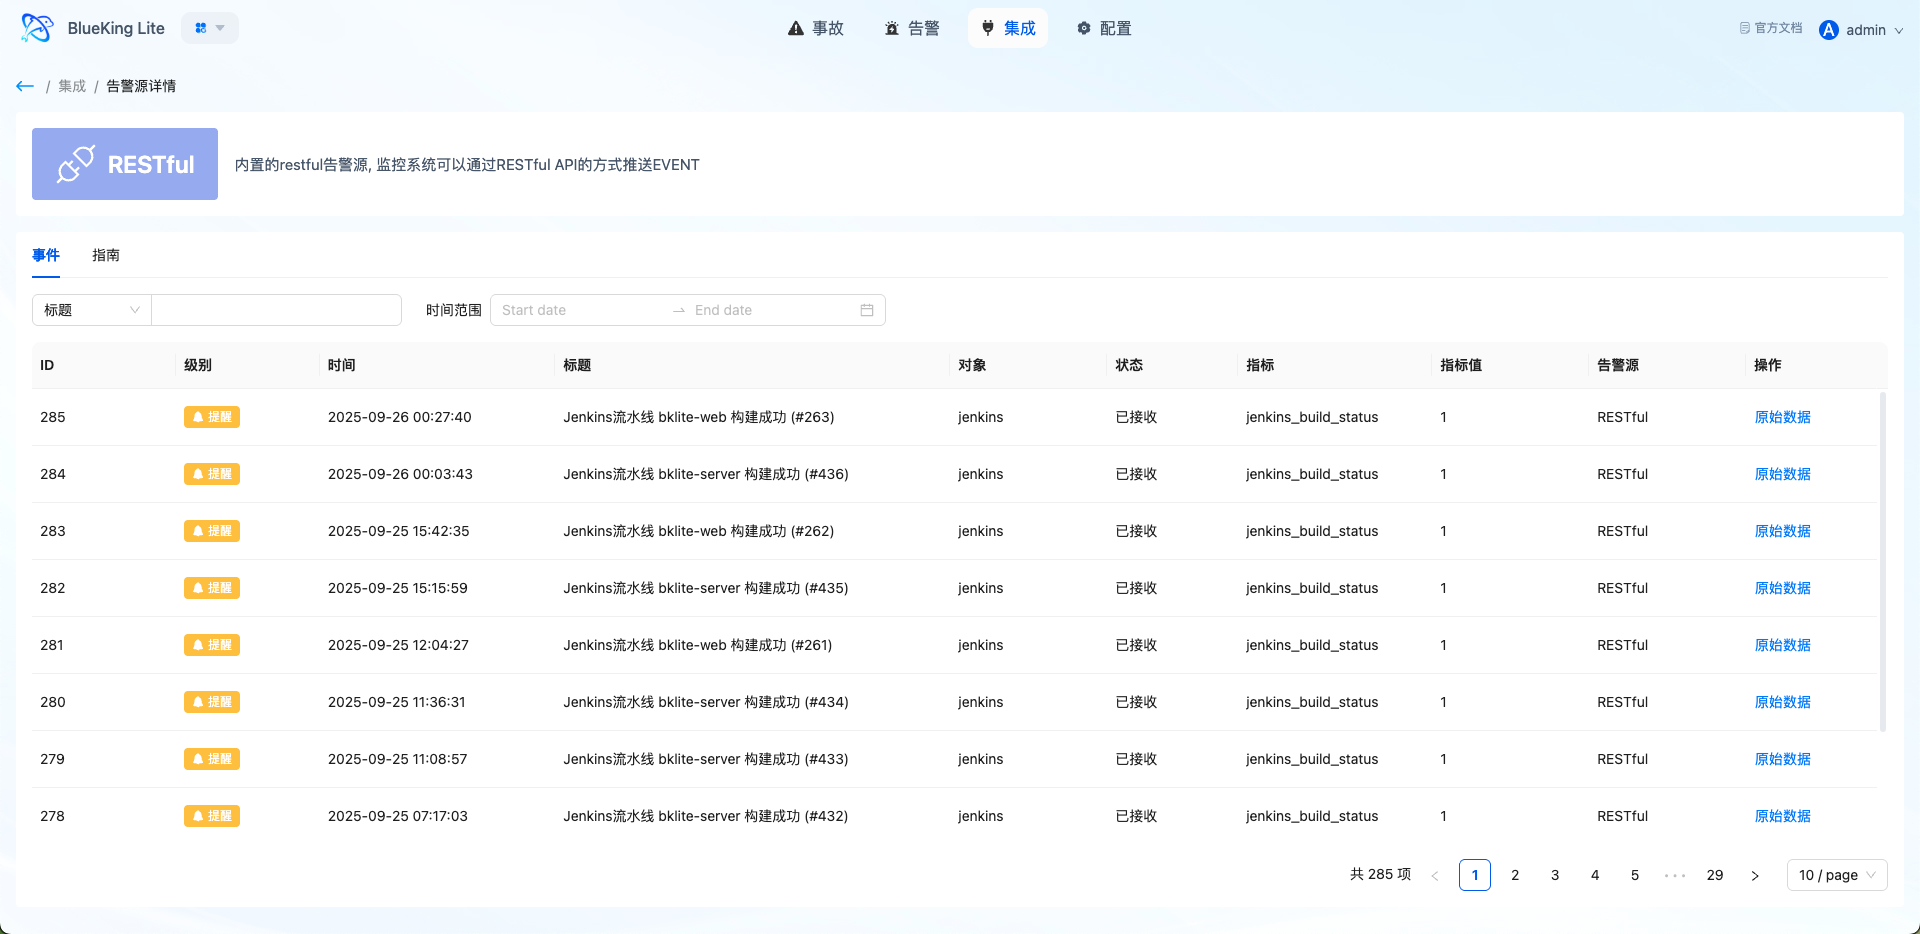
5.1 Verify Event Ingestion
Path: Alert Center -> Integration -> Events
After pushing events, first go to the Events page to verify that raw events have been successfully ingested into the platform:
- Whether events are from the expected alert source
- Whether fields such as
levelandresource_nameare parsed correctly - Whether timestamps are reasonable (to avoid time anomalies caused by timezone issues)
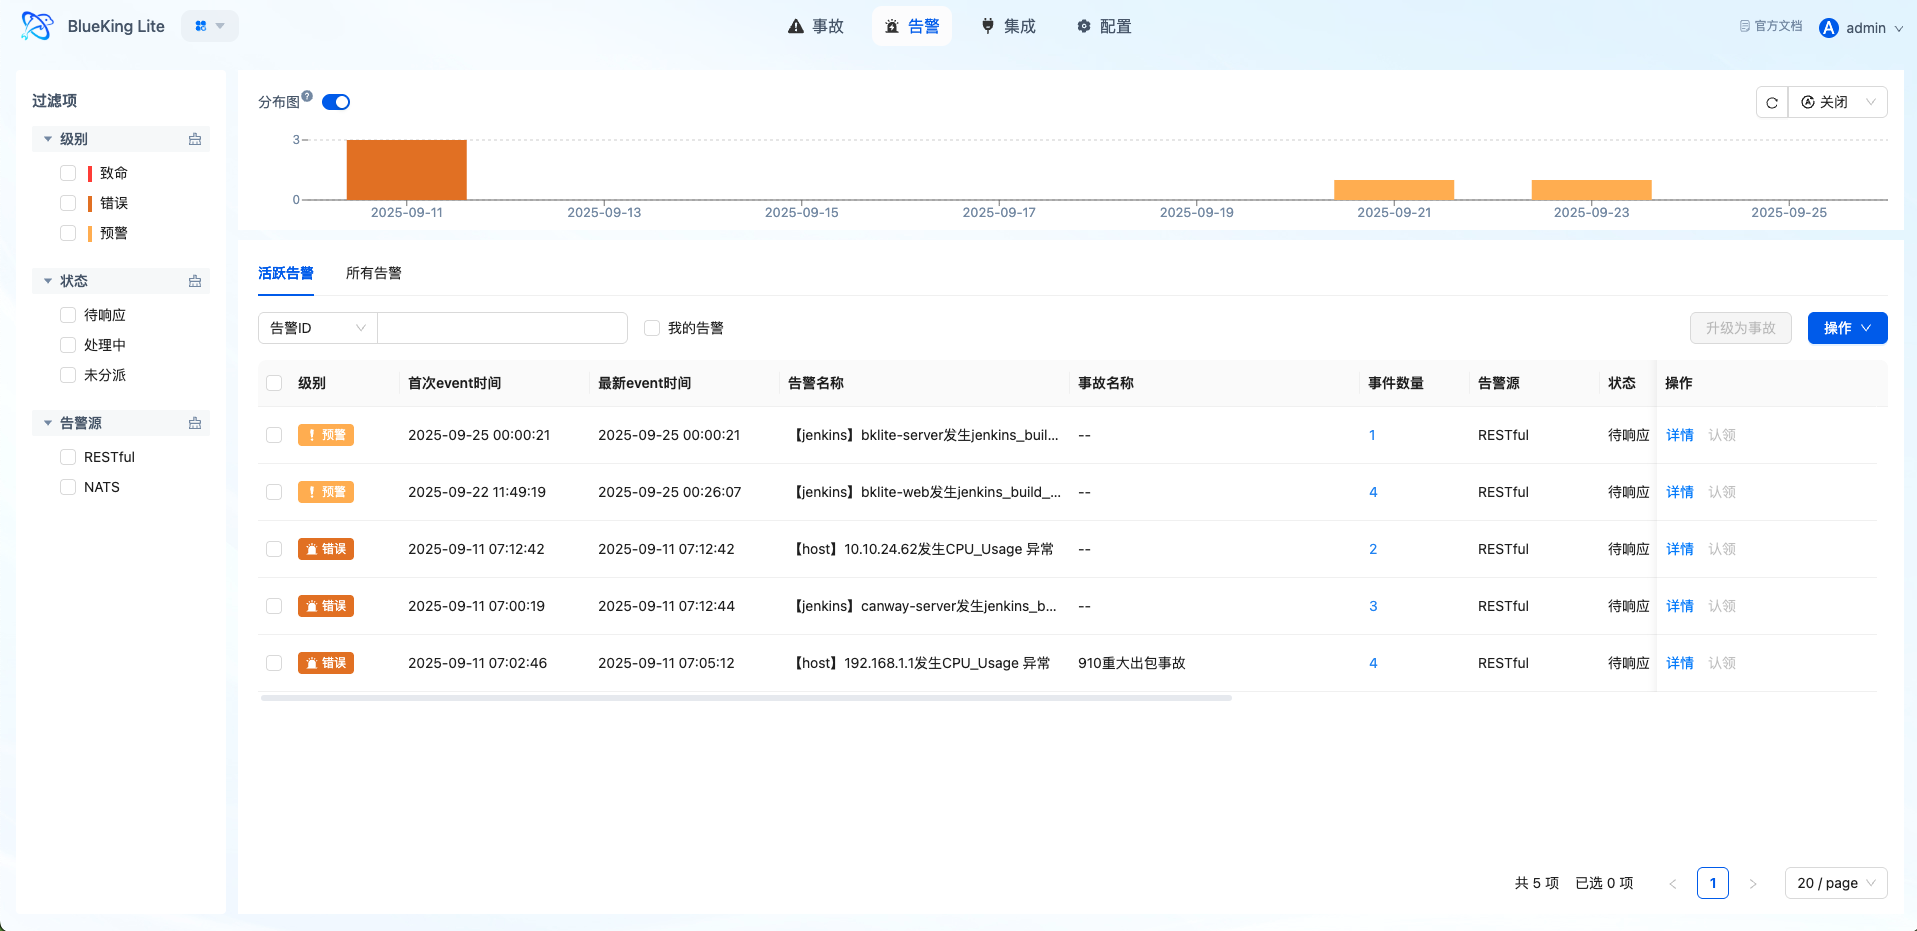
5.2 Verify Alert Generation
Path: Alert Center -> Alerts
Once events match rules and satisfy window conditions, the platform generates corresponding alerts:
- Whether the alert title, severity level, and source meet expectations
- Whether the associated event list is visible in the alert details
- Whether events with the same
group_bydimensions are correctly aggregated into the same alert - Whether alerts from session window policies correctly enter the "Observing" status
Interface Guide:
- Chart Interpretation / Configuration Logic: The alert detail page displays associated events, operation records, and notification status. If you find that the aggregation results do not meet expectations, go back and check the correlation rule's grouping fields and window configuration.
6. Step 5: Configure Automatic Dispatch Policies
Path: Alert Center -> Settings -> Alert Dispatch -> New
6.1 Basic Configuration
- Dispatch Name and Enable Status: Set the policy name and make sure the "Enable" toggle is turned on.
- Effective Time: Select the time range type (One-time / Daily / Weekly / Monthly).
- Match Type:
- Select "Match All": All undispatched alerts within the time period will be matched.
- Select "Condition Filter": Configure specific matching rules.
6.2 Condition Filter Configuration Example
[
  [
    {
      "key": "level",
      "operator": "eq",
      "value": "1"
    },
    {
      "key": "resource_type",
      "operator": "eq",
      "value": "host"
    }
  ],
  [
    {
      "key": "source_name",
      "operator": "contains",
      "value": "zabbix"
    }
  ]
]
The above rules mean: match alerts where (severity is critical AND resource type is host) OR (source name contains zabbix).
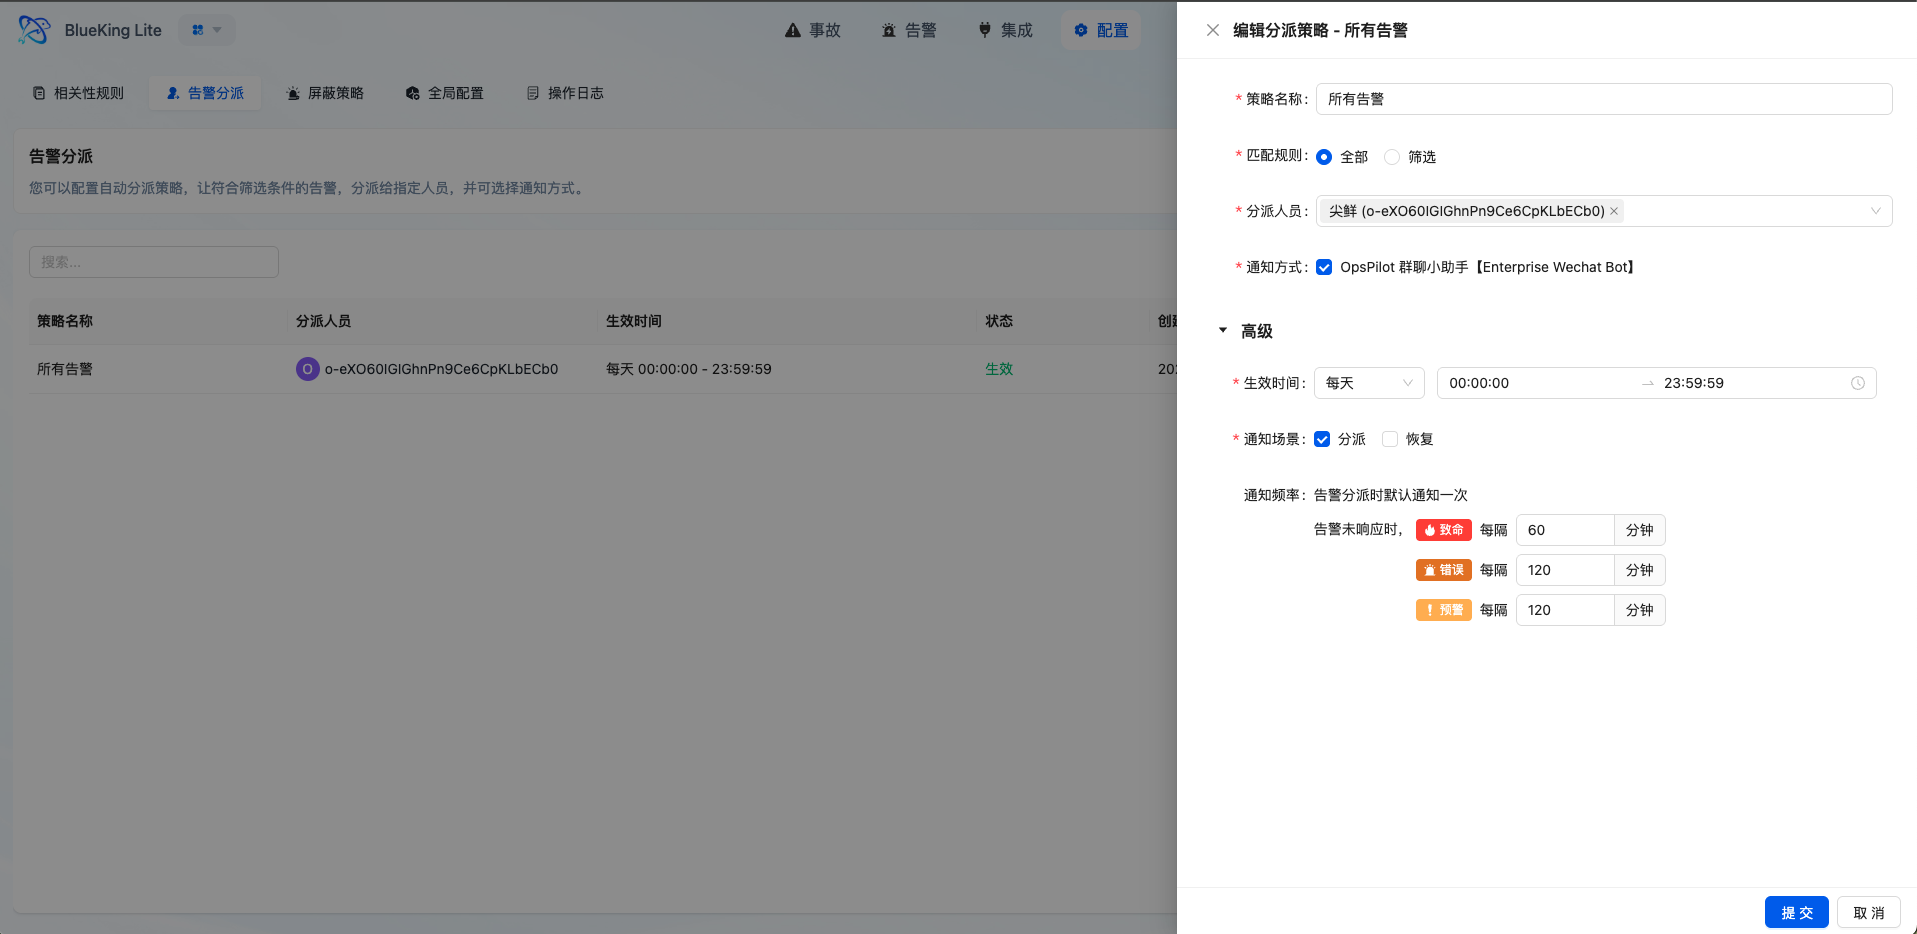
6.3 Dispatch Personnel and Notifications
- Dispatch Personnel: Select the responsible person(s) (supports multiple selections).
- Notification Channel: Select the notification method (WeCom, email, etc.).
- Reminder Configuration: Set the reminder frequency for unacknowledged alerts (e.g., remind every 30 minutes for critical severity).
After configuration, newly generated alerts will be automatically dispatched according to the policy, reducing manual judgment and reassignment overhead.
Interface Guide:
- Chart Interpretation / Configuration Logic: Dispatch policies are sorted by creation time, with priority running from first to last. It is recommended to place more granular matching rules first and general catch-all rules at the end.
7. Step 6: Configure Missing Detection Policy (Optional)
For scenarios such as scheduled tasks and heartbeat monitoring, you can configure a missing detection policy.
7.1 Policy Configuration Steps
Path: Alert Center -> Settings -> Correlation Rules -> New
- Policy Type: Select "Missing Detection"
- Matching Rules: Configure the expected event characteristics (e.g.,
service=daily-backup) - Cron Expression: Define the expected arrival schedule, e.g.,
0 2 * * *(every day at 2:00 AM) - Activation Mode:
- "First Heartbeat Activation": Monitoring begins after receiving the first matching event
- "Immediate Activation": Monitoring begins immediately after policy creation
- Grace Period: Set the delay (in minutes) after the expected time before a missing alert is triggered if no event is received
- Auto-Recovery: When enabled, if a matching event is received after a missing alert is generated, the alert is automatically recovered
7.2 How It Works
- After the policy enters monitoring mode, the platform calculates the expected arrival time based on the Cron expression.
- If no matching event is received after the expected time plus the grace period, a missing alert is triggered.
- After a missing alert is generated, if a subsequent event matching the rules is received, the alert is automatically recovered.
Note: Missing detection relies on Celery scheduled task scheduling. Please ensure that the platform's scheduled tasks are running normally.
8. Step 7: Escalate Major Issues to Incidents
When an alert has a clear business impact or requires multiple roles to handle collaboratively, it can be escalated to an Incident.
8.1 Escalation Steps
Path: Alert Center -> Alerts -> Select Alert -> Escalate to Incident
- Select the target alert from the alert list.
- Click the "Escalate to Incident" button.
- Fill in the incident title, severity level, participants, and other information.
- Confirm creation.
8.2 Incident Handling
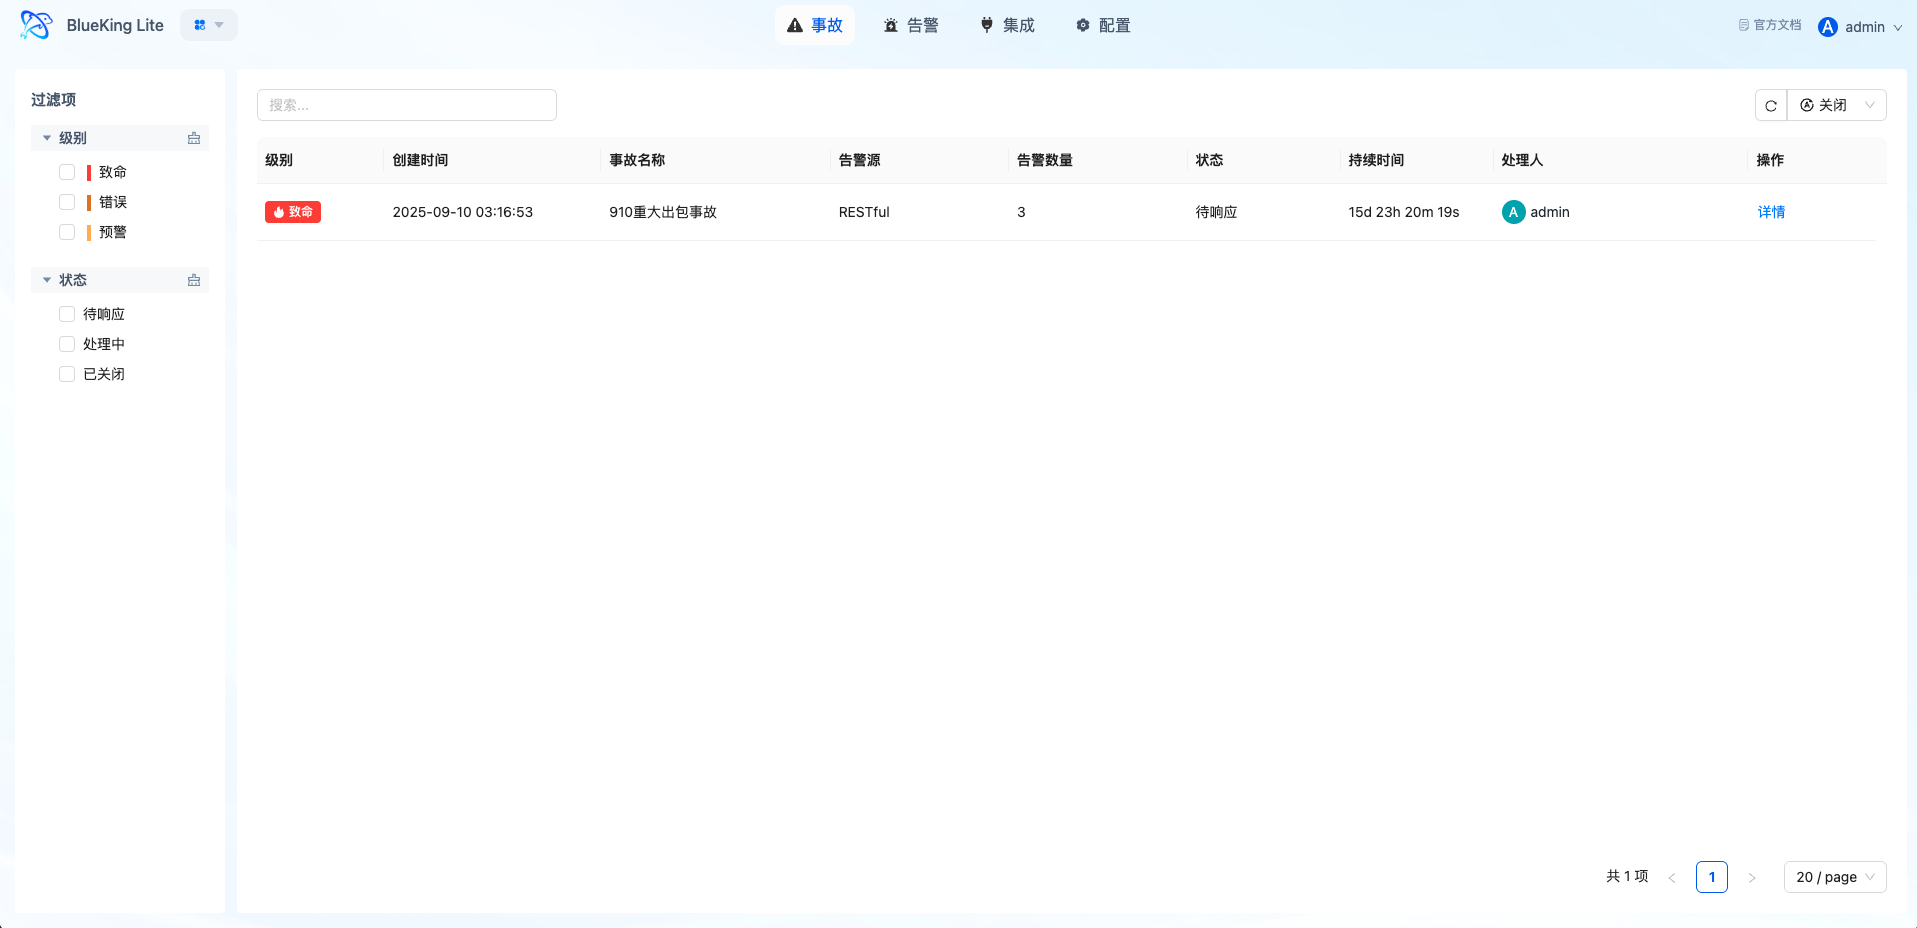
After the incident is created, you can go to the Incidents page to view:
- Incident details and status tracking
- Associated alert list and handling progress
- Gantt chart timeline showing the incident lifecycle
- Support for incident claiming, closing, and reopening
Interface Guide:
- Chart Interpretation / Configuration Logic: The Incidents page is used for unified tracking of escalated issues. Compared to the Alerts list, it emphasizes a collaborative perspective and cross-team communication.
9. Result Verification and Closure Recommendations
After completing the above steps, verify that the integration forms a complete closed loop as follows:
| Verification Item | Verification Location | Expected Result |
|---|---|---|
| Raw event ingestion | Events page | Pushed events are visible with correctly parsed fields |
| Event aggregation effect | Alert Details -> Associated Events | Events with the same dimensions are aggregated into the same alert |
| Automatic dispatch active | Alert Details -> Operation Records | Auto-dispatch records are visible with correct responsible persons |
| Notification delivery | Alert Details -> Notification Status | Notifications sent successfully |
| Automatic recovery | Alert status | After pushing a recovery event, the alert status changes to "Auto-Recovered" |
| Incident escalation | Incidents page | Associated alerts and handling progress are visible |
Continuous Optimization Recommendations
- Optimize aggregation rules: Adjust
group_byfields based on actual aggregation results to avoid over-aggregation or under-aggregation. - Refine dispatch policies: Add more granular dispatch rules for high-frequency issue scenarios to reduce the proportion of catch-all dispatches.
- Adjust suppression policies: Configure suppression policies for maintenance windows or known low-value events, but avoid excessive suppression.
- Optimize reminder frequency: Adjust reminder frequencies and maximum reminder counts for each severity level based on actual handling times.
- Conduct regular reviews: Combine operation logs and trend statistics to regularly review alert governance effectiveness.