The Service Is Not Down, but Slow Requests Are Already Consuming User Patience
Ten minutes after a release finished, the payment confirmation page showed no error.
Release owner Xiao Zhou watched the dashboard: instances were alive, the API returned successfully, and the error rate had not risen. But the business contact forwarded a customer-service message into the group: "The page keeps spinning. The user clicked twice and still got no result."
Xiao Zhou first checked availability. It was still green. He then checked average latency, which did not look outrageous either. Should he roll back? The evidence at that moment was not enough to support that decision.
But users were already waiting. The hardest part of this scene is that "the service is available" on the surface and "the operation feels smooth" to users are not the same thing.

The Root Cause: A Green Light Answers Only One Question
Availability answers whether the service can be accessed. It can quickly capture a complete outage, but it does not automatically explain whether every request finishes within the time users can accept.
Average latency can hide problems too. Suppose 90 percent of requests are still fast, while a small number are slowed down by downstream calls, queuing, or specific parameters. The average may remain flat. Users who fall into that small tail of requests, however, will click again, refresh, and eventually leave.
A service being online is only the starting point of reliability judgment. For an interactive path, once tail requests start slowing down, it is already a user-experience risk that deserves attention.
What Xiao Zhou lacks at this moment is not more overview charts, but a shared judgment language that can connect "users say it is slow" with "the system looks normal."
Split Experience Into Discussable Signals
If every health judgment is compressed into one green light, on-call engineers only receive an overly coarse answer. A more useful approach is to let each signal answer its own question:
| Signal | Question It Answers | Risk It Can Miss |
|---|---|---|
| Availability | Is the service still accessible? | The service is available but responding slowly |
| P95 / P99 | Are most and tail requests still within acceptable latency? | Averages hide local slow requests |
| Error rate | Are failures increasing? | Slow requests have not yet turned into errors |
| Throughput / no traffic | Is the traffic shape abnormal? | Entry points, routing, or paths have changed |
P95 is better for observing whether most user experience remains stable. P99 makes it easier for the team to see whether the slowest small portion of requests is continuously degrading. They should not be understood as just two more thresholds, but as a shared language for "which users are being slowed down."
Thresholds also cannot be separated from business actions. Payment confirmation, login, search, and background batch processing do not share the same expectation for waiting time. The purpose of an objective is not to escalate every fluctuation into an incident, but to consistently identify real exceptions.
Where Xiao Zhou Should Look Next
When P95 or P99 starts missing its target, troubleshooting cannot stop at "latency is high." That metric only says the problem is worth tracing; it does not determine the root cause for the team.
Xiao Zhou needs to narrow the scope to a specific service, environment, and endpoint: are all paths slow, or is a payment confirmation endpoint being held back after the release? Then he needs to follow traces to see whether the time is spent inside the service or in downstream dependencies.
At this step, error rate, throughput, and no-traffic signals should also serve as neighboring evidence. A flat error rate does not mean there is no experience risk. Lower throughput does not necessarily mean fewer users. Only when different signals are combined can the rollback decision move from intuition toward evidence.
Technical Insight: Objectives and Evidence Need to Form One Line
- Objective tells the team whether experience has deviated from the agreement.
- Scope tells the team which service, environment, or endpoint is deviating.
- Trace evidence tells the team where time is ultimately spent along the path.
If the team only has objectives without follow-up evidence, it gets stuck at "we found slowness." If it only has traces without experience objectives, it is hard to judge which fluctuations deserve priority handling.
Reconnecting the Layers
Back in Xiao Zhou's scene, green availability cannot end the judgment. It only means no complete interruption has occurred. P95 and P99 let him confirm that user waiting is not an isolated complaint, but an emerging tail-latency risk.
Then service, environment, and endpoint narrow the scope. Traces continue pushing the problem toward the concrete time-consuming path. Only at this point can the team discuss whether to optimize, rate limit, adjust dependencies, or roll back the release, instead of arguing repeatedly over whether the service has a problem.
The difficulty of reliability is not looking at a few more charts, but making each layer of observation point the next action toward more specific evidence.
Let APM Cover the Application-Side Breakpoint
When traces are reported through OTLP inside a trusted internal network, BK Lite APM provides application-side observation entries such as services, instances, RED metrics, endpoints, errors, traces, and service topology.
For scenarios where "the service is alive but requests are getting slower," it supports configuring three types of SLOs for a specified service and required environment: availability, P95 latency, and P99 latency. Latency objectives require thresholds, and the evaluation window can be rolling 7 days, rolling 30 days, or a calendar month. In this way, latency is no longer just a spike on a curve. It can enter the judgment of whether the service objective has been met.
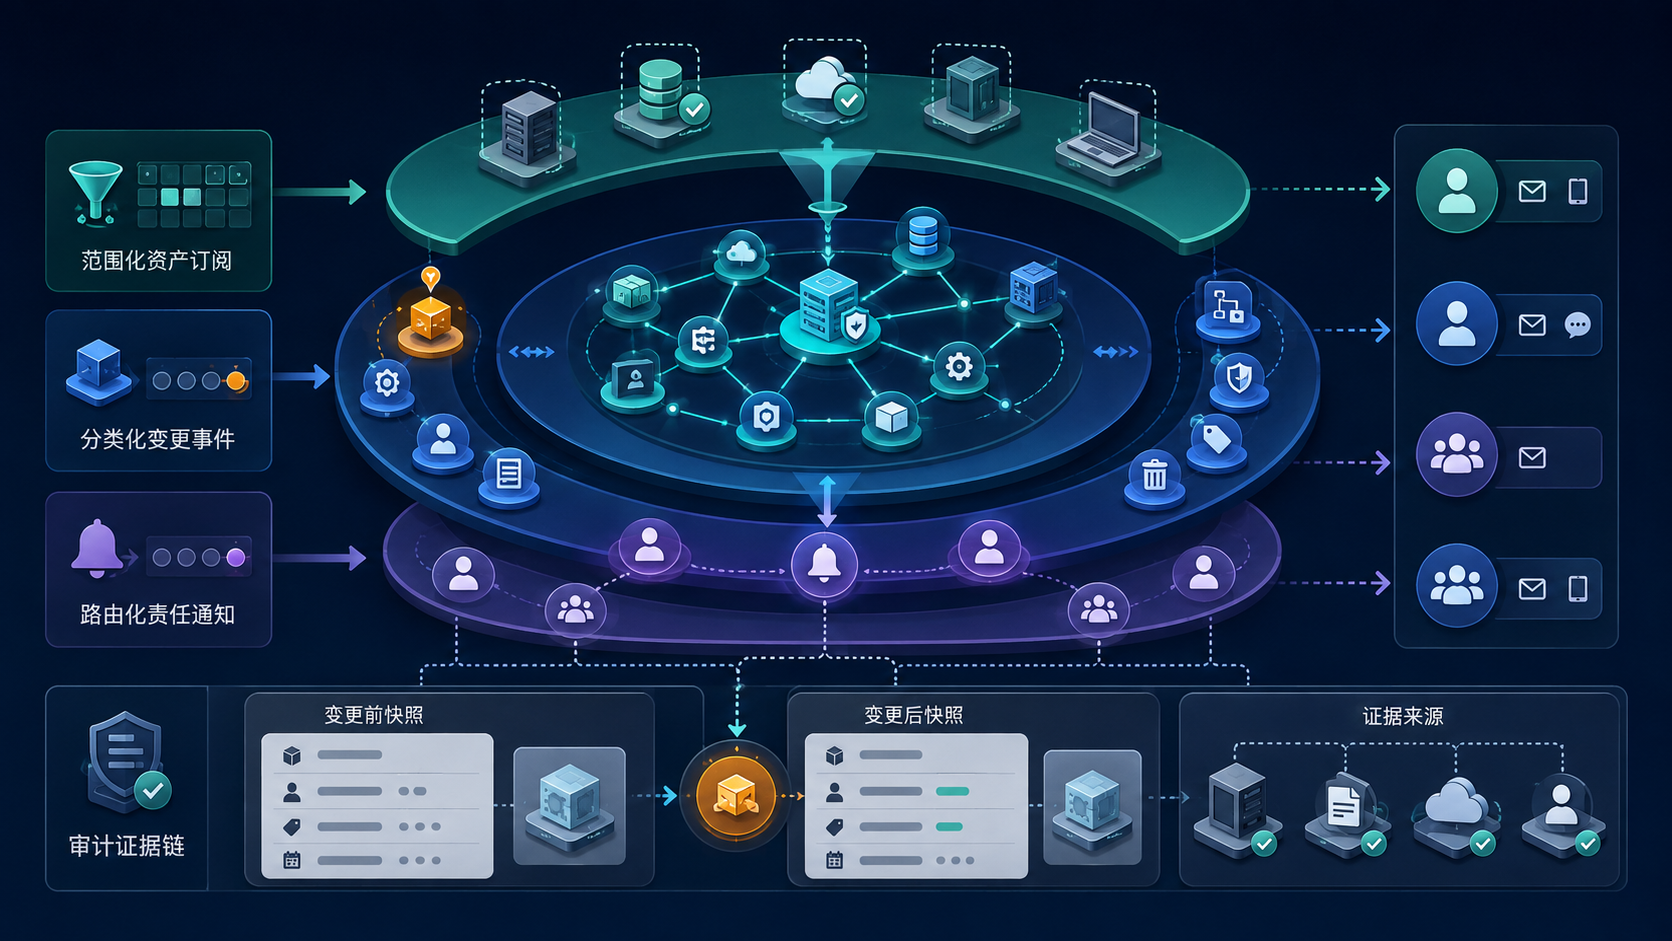
When notifications are needed, APM's native alerts are limited to five metrics: error rate, P95, P99, throughput, and no traffic, and they must be associated with an environment. It can deliver notifications and can also one-way copy event replicas to Alert Center. Alert Center does not write back to APM alert history.
Traces can be searched by time, service, and environment, with a maximum window of 35 days. Service topology has a maximum window of 7 days. Both provide application-side evidence, but they do not replace resource monitoring or log search: resource metrics should still be observed in the monitoring system, and log content should still be verified in the log system.
BK Lite APM is currently a first-party community Beta capability. It is suitable for validating how service objectives, traces, and alert evidence connect within the existing experimental boundaries. It should not be described as production-grade APM, automatic root-cause analysis, or out-of-the-box self-healing.
Questions to Ask After a Release
- Beyond this service's availability objective, has the team also defined P95 or P99 targets that match the business action?
- When latency misses its target, can the team directly narrow down to service, environment, and endpoint instead of guessing again from dashboards?
- Can traces continue providing evidence about time distribution?
- Are error rate, throughput, and no-traffic signals used as different kinds of supporting evidence instead of being compressed into one "healthy" conclusion?
- Are the responsibility boundaries between resource metrics, logs, and application traces still clear?
In the end, Xiao Zhou did not ignore customer feedback just because the dashboard was green, and he did not make a rushed conclusion without enough evidence. He first pulled tail latency into the service objective, then followed traces to confirm where time was spent.
It is good news that the service is not down. But for users, whether a request can finish in time is the more direct reliability experience. When objectives, scope, and evidence connect into one line, slow requests under a green light no longer have to wait until complaints appear before they are seen.