
2 posts tagged with "Alert Center"

View all tags

At 2 AM, a P1 Incident Spins Out in the Group Chat and No One Can Say What Stage It's At

· 8 min read

The Scene

At 2 AM, on-call engineer Xiao Zhou has just finished a round of monitoring curves and is about to get a glass of water. The first P1 alert pops up in the ops group chat: "Database connection pool alert on the payment callback path." He puts the cup down, replies "seen," and starts syncing in the group.

Within five minutes, the ops group, the business group, and the upstream dependency group all explode at once. Alert screenshots, monitoring curves, log snippets, temporary workarounds, follow-up questions — all of it piles up in a single message stream in chronological order.

Twenty minutes pass. The group has scrolled past 200 messages.

The business side @s Xiao Zhou in the group: "What stage is the incident at?"

Xiao Zhou scrolls through the chat history and hesitates for five seconds.

No one can answer it in a single sentence.
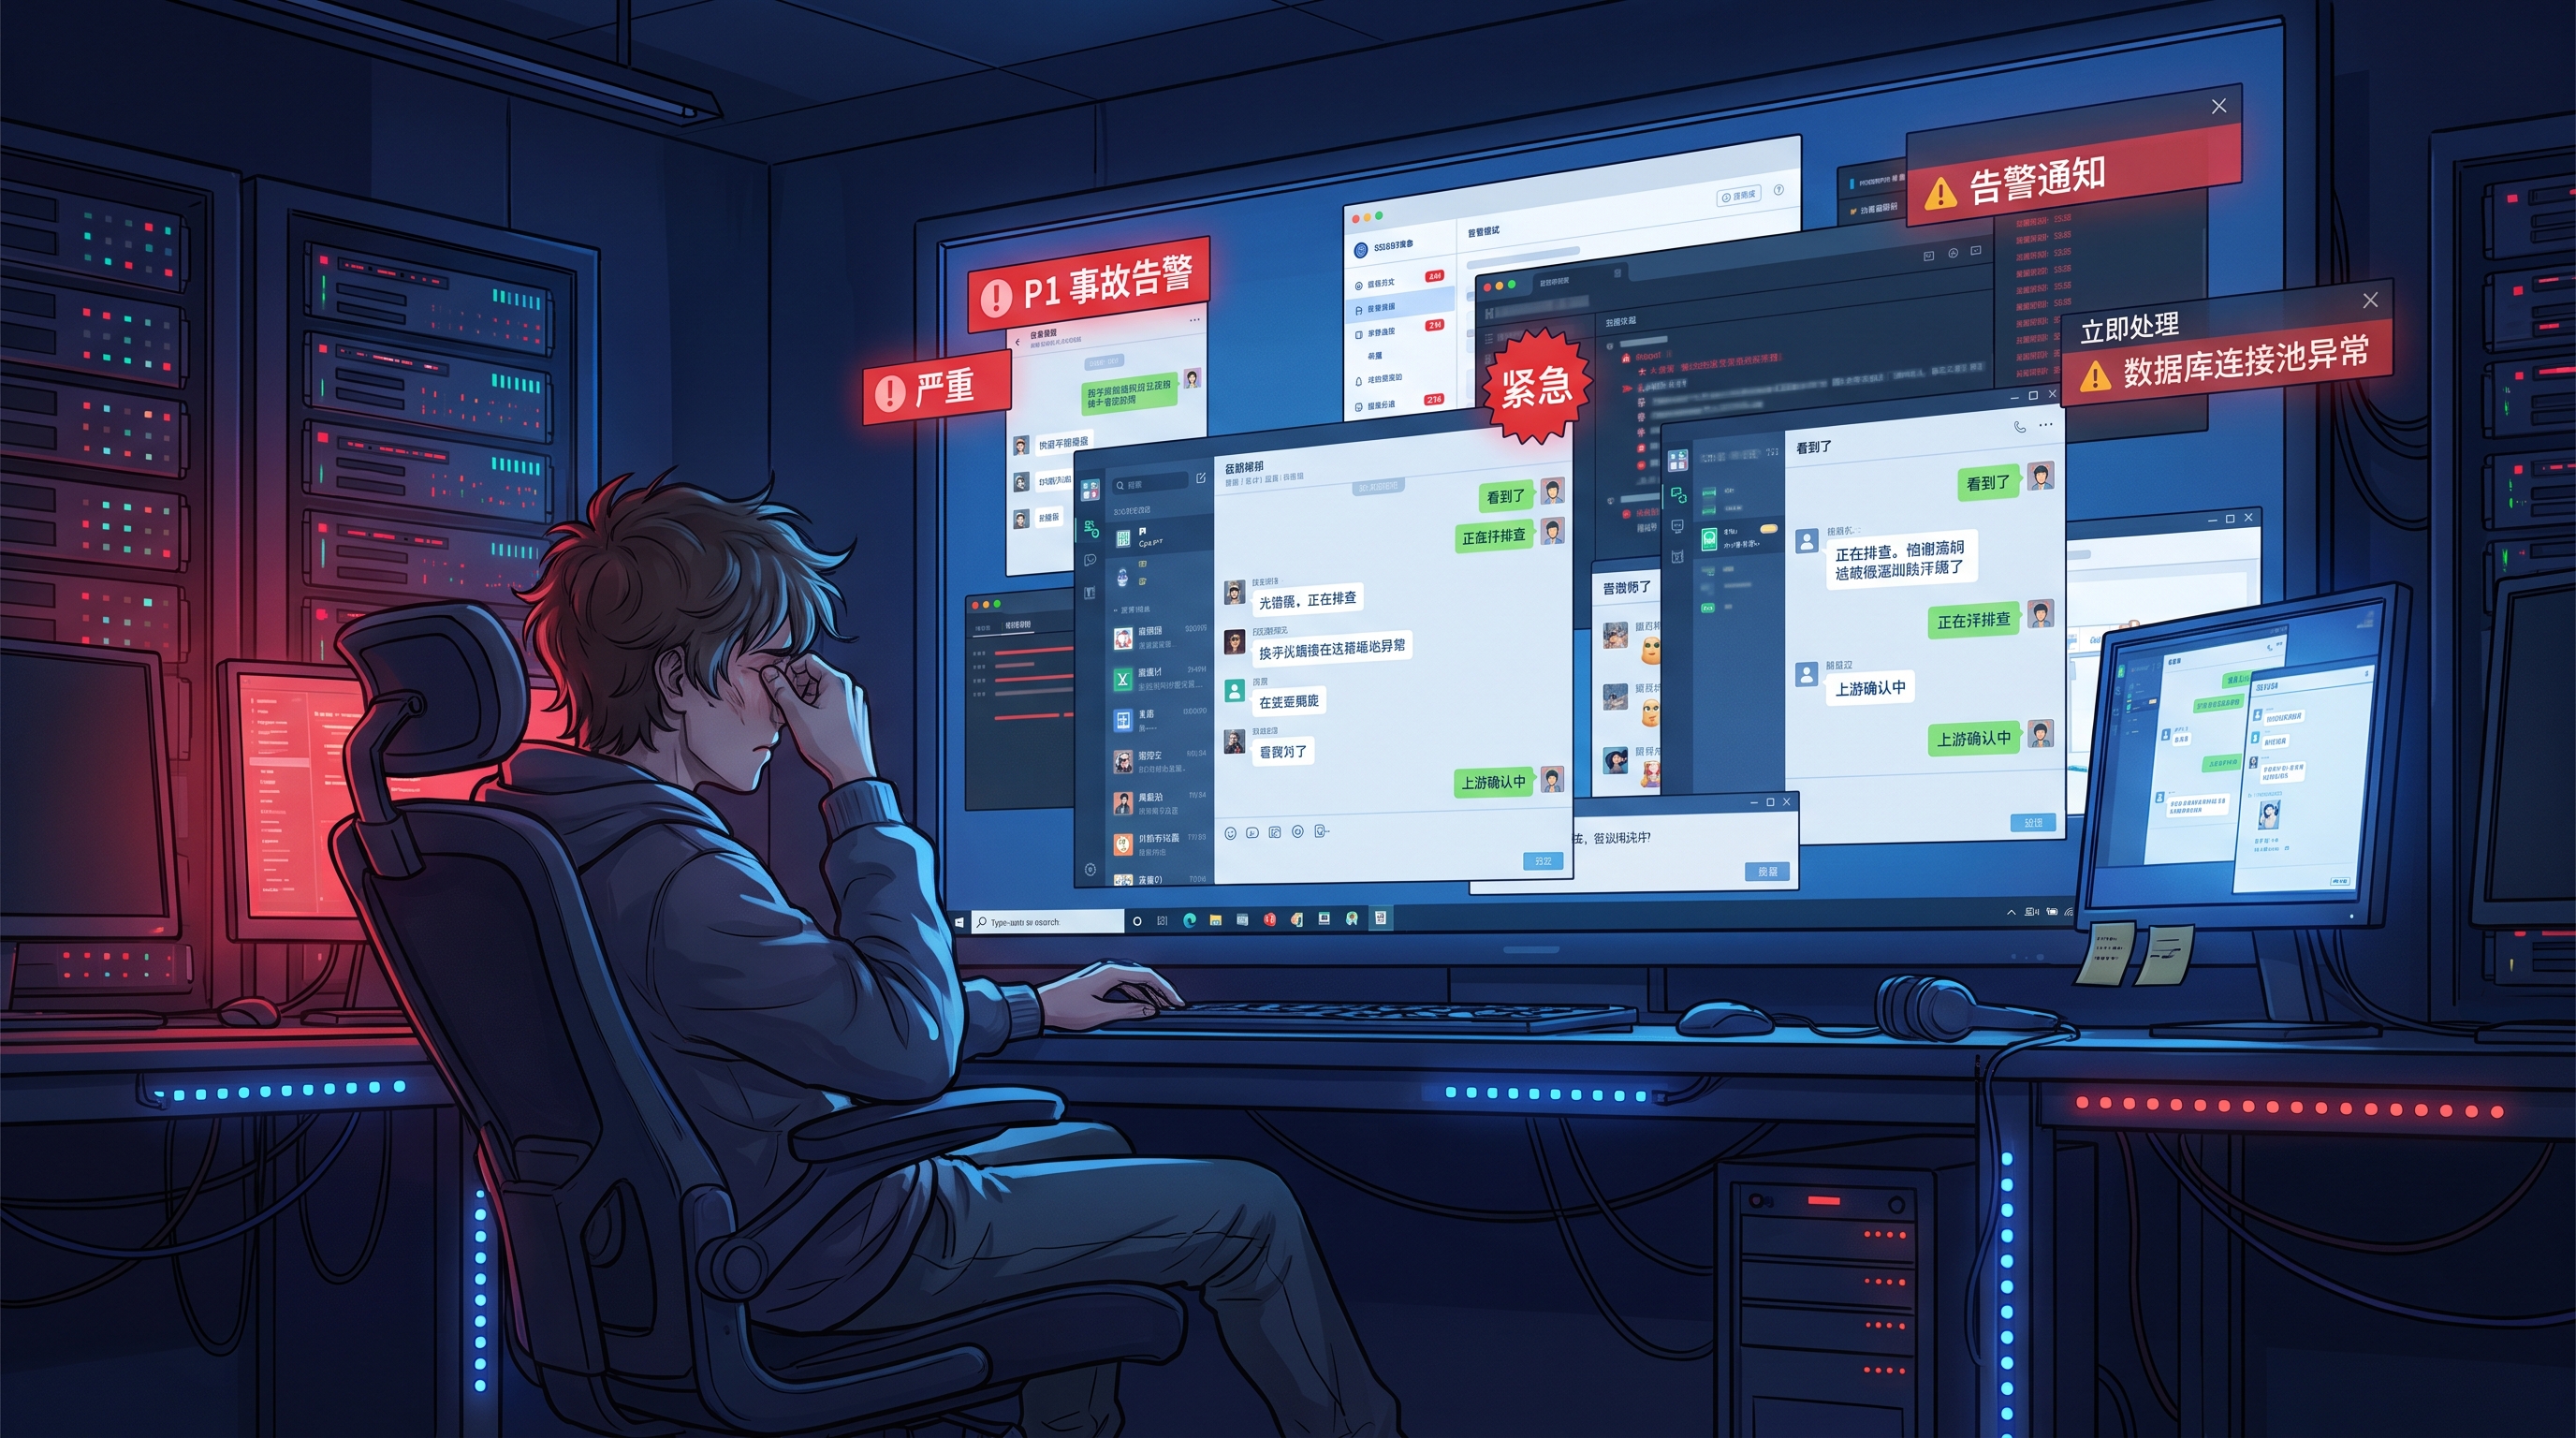
2 AM on-call scene: messages flooding the group chat, the on-call engineer staring at the screen

When 10 Alerts Actually Mean 1 Problem: How to Govern Alert Noise Efficiently

· 12 min read

Right after a release finishes, the alert list is already full of red states.

Host metrics are jittering, application error rates are rising, the log platform is surfacing anomalies, and the team channel is flooded with notifications from different sources within minutes. Lao Qian, the platform troubleshooter on duty, does not rush to claim alerts one by one. It is not because he is slow. It is because he knows the real danger in that moment is not that no one sees the problem. It is that everyone gets dragged in different directions by 10 alerts that all look equally urgent.

The hard part is rarely whether an anomaly has been detected.

The hard part is this: out of these 10 alerts, which one is the real handling unit?