Use Historical and Period-over-Period Alerts to Reduce False Positives From Cyclical Changes
During an alert review, operations engineer Lin is about to raise the CPU threshold for a batch-processing host. An alert fires every day after the job starts. After checking job progress and business response times, the on-call team usually confirms that it is another expected peak.
But when he expands the chart to include quieter hours, he finds a different change: CPU utilization is noticeably higher than usual, yet never reaches the existing alert threshold. Raising that threshold further would make these changes even harder for the same rule to detect.
Lin needs to decide both when a response is warranted and how to reduce repeated checks. This simplified policy review shows how historical comparisons can help him make that decision. All values are examples, not universal thresholds or measured outcomes.
Historical and period-over-period alerts turn past behavior into an explicit reference, so cyclical peaks do not need to be explained from scratch every time, while deviations during quieter periods are more likely to receive attention.

One Threshold Is Making Two Different Judgments
Lin's original condition is straightforward: trigger when CPU utilization exceeds 60%. He wants it to identify both resource pressure and departures from normal behavior.
For a metric with clear cycles, these two needs can pull the rule in different directions.
Load is normally high when batch processing starts. During quieter hours, the same value may already warrant investigation. An absolute value alone does not tell the rule which operating phase the host is in.
Raising the threshold can reduce some triggers, but it also widens the gap in detection during quieter periods. Lowering the threshold to capture those changes can cause repeated alerts during normal peaks.
A capacity limit asks, "Is this approaching a level that needs intervention?" A historical comparison asks, "Does this differ from behavior during comparable periods?"
Lin therefore keeps the capacity check and focuses the policy review on another question: which historical period should this host be compared with, and how should the deviation be expressed?
Make the Basis for Comparison Explicit
1. Identify Comparable Periods
Lin first reviews metric trends around several batch runs and compares them with the job schedule. He needs to establish whether peaks occur consistently and last for similar lengths of time. "It was high yesterday too" is not enough to make yesterday a suitable reference.
If the job starts at a fixed time every day, the corresponding period on the previous day may be useful. If weekday and weekend workloads differ, a weekly cycle may be more appropriate. When a job is delayed, the same clock time may no longer represent the same operating phase.
Period-over-period comparisons can reveal changes between adjacent periods. However, a substantial increase may be expected when moving from a quiet period into a batch-processing peak. This comparison helps show how quickly a value changes; whether that change deserves a response still depends on the business schedule.
After holidays, capacity expansion, or changes to batch schedules, the chosen historical window also needs to be reviewed. If the reference period happened to contain an incident, treating it as normal will distort later judgments.
Lin should be able to explain his choice of historical window: why these periods are comparable and which business changes would invalidate that choice.
2. Align the Measurement Definitions
After finding similar periods, Lin needs to confirm that both sides represent the same kind of data.
For example, the current value may come from one host while the reference includes other instances. The current statistic may be a maximum while the reference is an average, or the two may use different units and aggregation intervals. Even if both produce a percentage, the difference may not reflect a change in business activity.
Start by aligning four things:
- Object scope: The same metric, instance, and relevant filters.
- Grouping dimensions: Whether the compared results represent the same group of objects.
- Statistical method: Whether the aggregation method and data intervals are comparable.
- Units: Whether the original units, calculation units, and percentage definitions are consistent.
This affects how every later threshold is interpreted. If the objects being compared differ, even a finely tuned deviation condition will do little to help Lin identify a problem.
3. Express the Size of the Deviation
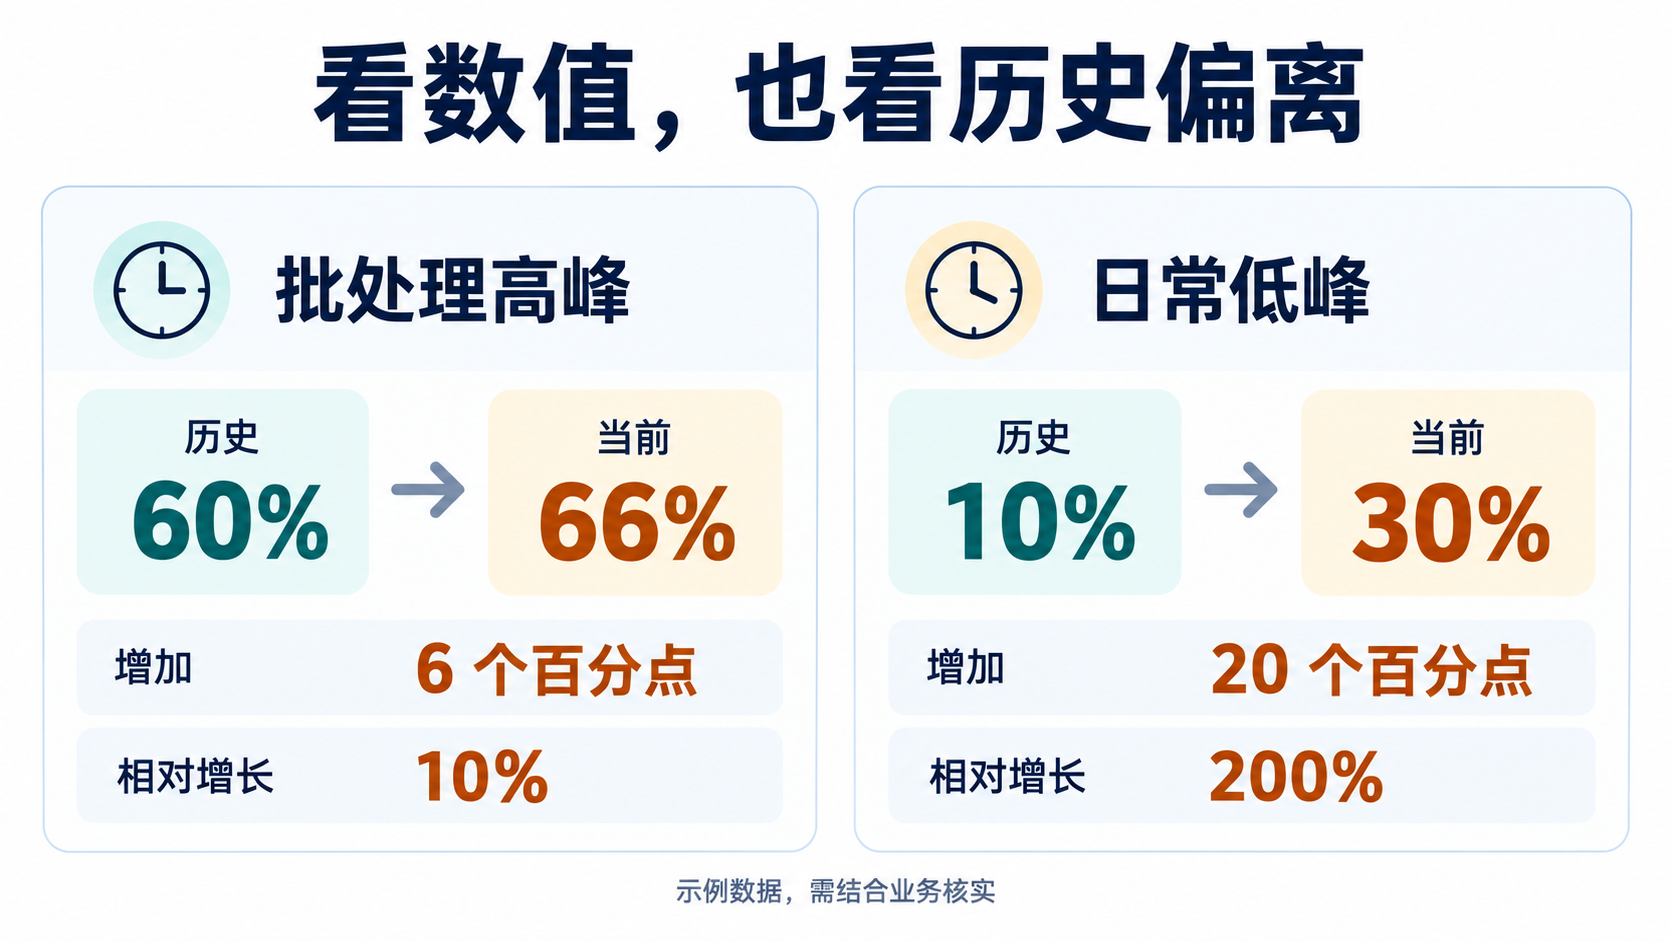
With the definitions aligned, consider two example periods for the same host:
| Operating phase | Comparable historical value | Current value | Difference | Relative increase |
|---|---|---|---|---|
| Batch-processing peak | 60% | 66% | 6 percentage points | 10% |
| Normal quiet period | 10% | 30% | 20 percentage points | 200% |
The original "above 60%" condition matches the first row but not the second. With a historical reference, Lin can assess whether the increase during the peak is expected and whether the deviation during the quiet period warrants checking processes and jobs.
The difference and rate of change in the table convey different information. CPU utilization rising from 10% to 30% is an increase of 20 percentage points, a 200% increase relative to the original value, and a current value three times the historical value. These numbers cannot be used as if they were the same threshold unit.
Differences describe absolute increases or decreases, while rates of change and multiples describe relative magnitude. But when the reference value is very small, even a slight absolute change can produce a large ratio. Missing historical data must not be treated as a normal baseline either.
At this point, Lin no longer needs to begin by debating whether 66% or 30% is more dangerous. He can explain how far each value has moved from normal, then decide on a response using capacity limits and business symptoms.
Technical Insight: Keep Both Checks
Historical comparisons give a rule operating context, but history alone cannot establish that a value is safe. A host that has long been close to its capacity limit may still need intervention even when the current value resembles the past.
Lin therefore maintains the two types of checks separately rather than replacing all existing absolute-value conditions:
| Basis for judgment | Main question | What needs validation |
|---|---|---|
| Absolute-value condition | Has resource usage reached a level requiring intervention? | Capacity headroom, business impact, and response requirements |
| Historical deviation condition | Does the value differ from comparable periods? | Window comparability, data completeness, and the definition of deviation |
Historical deviations provide another reason to investigate, while capacity conditions retain necessary risk limits. The two can serve different response needs, so a reduction in total alert count alone is not enough to assess the outcome.
Preserve the Comparison in the Policy
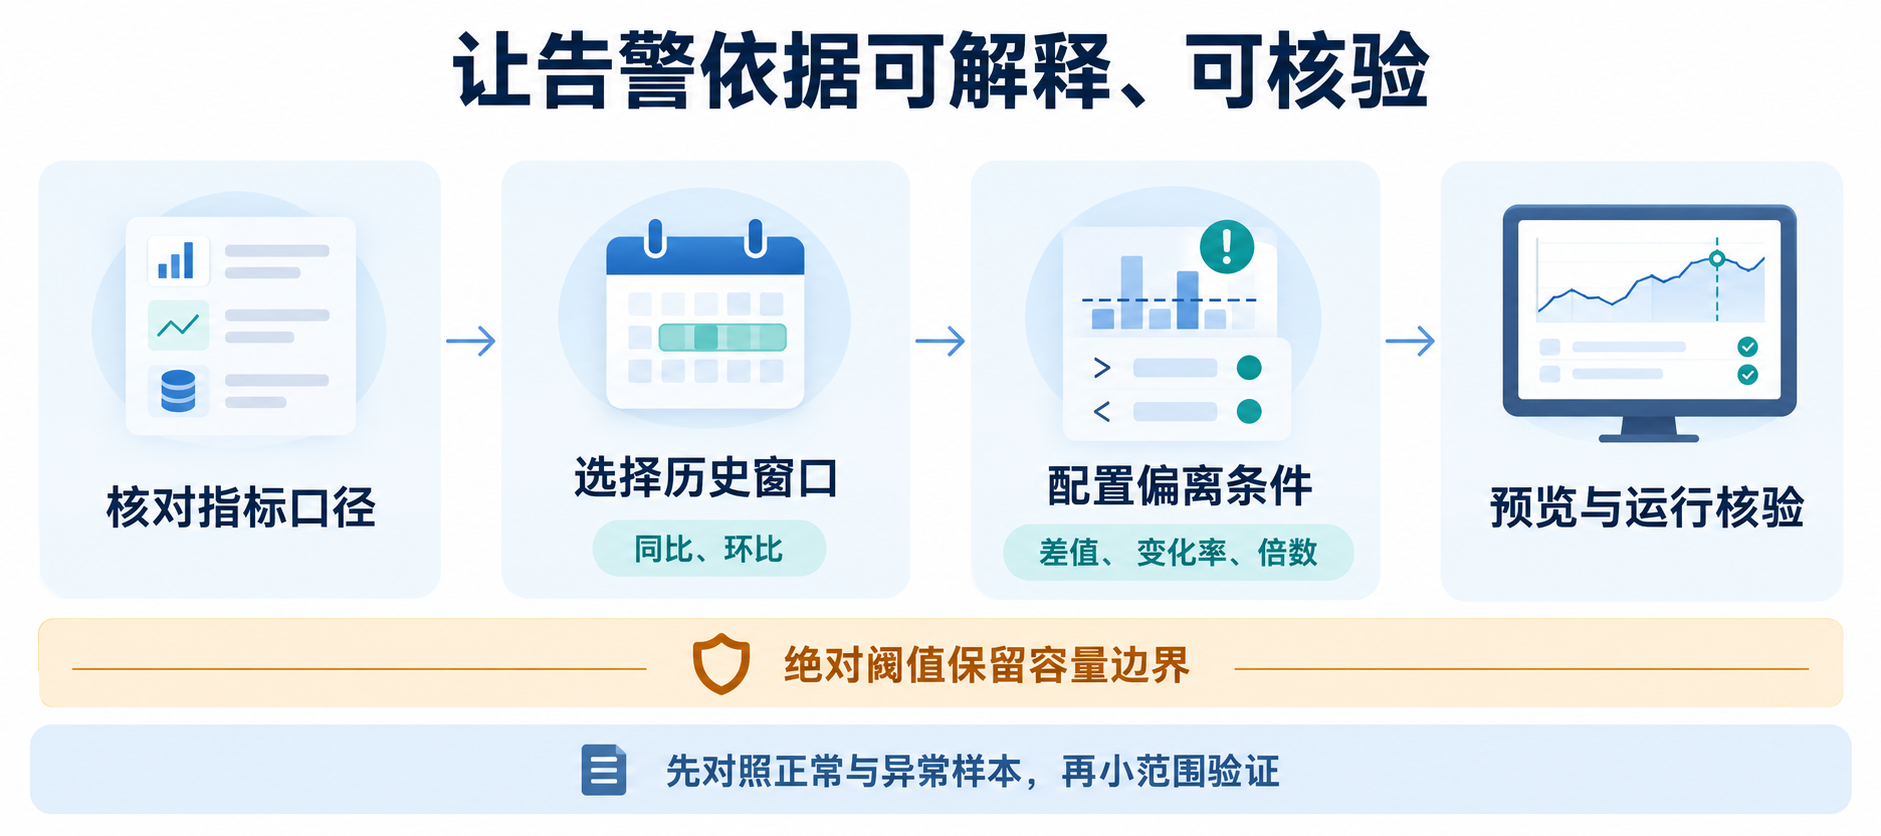
Lin now has a reference he can explain. Next, he needs that judgment to remain in effect and be understandable to other on-call engineers. If every alert still requires someone to retrieve charts and interpret them from personal experience, the cost of repeated confirmation remains.
WeOpsX Monitor Center can incorporate the historical reference into a policy's comparison baseline and alert conditions, turning that experience into configuration that can be reviewed.
Choose the Reference and Comparison Method
Monitoring policies support current-value evaluation, period-over-period comparisons, and historical comparisons. Historical references can use values from N hours ago or N days ago, or averages over the past N days or N weeks. Comparisons support differences, rates of change, and multiples. Here, the product's historical comparison, labeled "同比" in Chinese, follows the selected historical window and is not limited to the previous year.
When configuring the policy, Lin first needs to define the monitoring target, metric, filters, and grouping conditions. He then chooses the aggregation method and interval, followed by the appropriate historical reference and deviation condition.
Two time concepts also need to be kept separate: the aggregation interval determines how metric data within a period is calculated, while the historical comparison window determines which past data provides the reference. The product requires the comparison window to differ from the aggregation interval. Specific options must be selected from the range supported on the policy page.
These capabilities can encode the operating patterns Lin has already confirmed. Whether a business cycle is valid and whether a historical sample is suitable still require judgment based on the job schedule and actual metrics.
Preview Conditions and Inspect Actual Metrics
The policy page provides metric previews, threshold comparisons, and query result previews so Lin can check whether the target and conditions match. For a clear deviation, he should be able to explain where the reference comes from and whether the trigger uses a difference, rate of change, or multiple.
Historical periods can be compared manually through metric search. Once the policy is enabled, actual trigger records and metric observations help establish whether the conditions produce the expected judgments. Monitoring alert details retain metric snapshots from the alert lifecycle, supporting review of the situation at the time.
This creates two stages of validation: check the basis for comparison before configuration, then check the triggering results during operation. Data appearing in a preview is not enough to establish that a policy is ready for long-term on-call use.
Start Validation With One Metric
Lin can begin with this batch-processing host, validate within a small scope, and then consider a wider rollout. Validation should include normal peaks, normal quiet periods, and known abnormal periods.
| Check | Questions to answer |
|---|---|
| Is the data comparable? | Are the instance, metric, dimensions, units, and aggregation definitions consistent? Is the historical data complete? |
| Is the window appropriate? | Does it match the actual operating cycle? Does it include holidays, incidents, or schedule changes? |
| Can normal samples be explained? | Why should a normal increase not require repeated responses? Do the chosen conditions support that judgment? |
| Are signs of abnormal behavior still detectable? | Can deviations during known abnormal periods be expressed by the conditions and investigated further? |
| Are capacity risks still covered? | Are appropriate absolute-value conditions retained for sustained high utilization? |
| Are operating results consistent? | Do actual trigger records, observed metrics, and the business explanation agree? |
During validation, record why the window was selected and which situations require reassessment. When the batch schedule, host capacity, or business rhythm changes, the next person will know where to start reviewing the policy.
Returning to the original review, Lin's deliverable is a set of criteria that can be explained and validated: expected peaks should not require daily confirmation, deviations during quiet periods should have clear investigation conditions, and values approaching capacity limits should still have a path to a response.
Once those criteria are encoded in the policy and validated in operation, historical and period-over-period alerts can consistently reduce disruption from cyclical changes, leaving the on-call team more time for changes that deserve investigation.